All published articles of this journal are available on ScienceDirect.

Vehicle Effect on Vortex-induced Vibration of Flat Steel Box Girder
Abstract
Vortex-induced vibration (VIV) occurs at low wind speed under normal condition, affected greatly by section type of bridge and its ancillary facilities. Few researches on VIV of vehicle-bridge system are conducted, and many researchers pointed that vehicle-bridge system should be paid attention to in wind tunnel test. In this paper, type of vehicle, number of vehicle and distance of traffic flow’s influence on VIV were studied with a flat steel box girder model. Results obtained from wind tunnel tests were displayed in order to prove the following rules: First of all, compared with conditions without vehicles, response of VIV is reduced severely when a vehicle is placed on the bridge. Secondly, response of VIV and range of VIV with three vehicles are greater than one vehicle on the bridge. At last, VIV is reduced when distance of traffic flow increases. Mechanism from fluid dynamic point view is given by simulating the working conditions with ANSYS 14.5.
1. INTRODUCTION
VIV occurs at low wind speed under normal condition, affected greatly by the section types of bridge and its ancillary facilities. Long-term VIV can lead to structural fatigue and affect driving safety. Avoiding significant level of VIV is important not only for the structure safety but also for the comfort and the safety sensation of the drivers on the bridge. Wind tunnel test is a major approach in studying VIV, hence many researchers studied the factors effecting the VIV by wind tunnel test, such as railings, guide plate, maintenance guide, spring damping ratio, wind fairing, suppression vibration plate on deck, surface roughness, wind and rain occurs at the same time on the bridge [1-7]. However, wind tunnel test on vehicle-bridge system is rarely found in previous studies. M. Suzuki [8] found that aerodynamic properties of train and vehicle were not only relevant with shape but also with surroundings. Aerodynamic properties of train and vehicle on the bridge showed differences with train and vehicle on road. Four types of vehicles (sleeping car, passenger car, double decker bus, container car) were analyzed in three girders with different thickness. Conclusion that aerodynamic characteristic coefficient increased with thickness of girder was obtained. L. Zhou [9] studied the VIV from vertical and torsion VIV at six working conditions. Range of VIV with vehicles was ahead of situation without vehicles. Vehicles changed the shape of girder, thus vehicle effect on VIV shouldn’t be ignored. Y. L. Li [10] took a wind tunnel test with eight kinds of discrete double-box girders, getting a conclusion that vehicle location on the bridge and aerodynamic characteristic of bridge can affect the vehicle-bridge system’s Reynolds number. Y. Han [11] analyzed the aerodynamic characteristic of bridge and vehicles with three different traffic flows, including free traffic flow, busy traffic flow and normal traffic flow. Effects of different traffic flow and different wind attack angles were significant in aerodynamic characteristic of bridge, and vehicle-bridge system should be concerned in wind tunnel test. F. Dorigatti [12] studied the ideal and typical bridge deck’s aerodynamic characteristic when there was a traffic flow with cross wind speed higher than 10 m/s. Changes of lift coefficient, side coefficient and rolling coefficient on two types of bridge were found based on relationship between cross wind and yaw angle of vehicle.
Vehicle-bridge system studies mentioned above mainly paid attention to influence of vehicle-bridge system on situations that whether there were vehicles or not, different kinds of traffic flow and different kinds of bridge section. This paper mainly studied on types of vehicles, number of vehicle and distance of traffic flow’s influence on VIV.
2. BACKGROUND
2.1. Project’s Background
Cuntan Yangtze bridge including main section and approach bridge is located in Chongqing, China, with a span arrangement of 250m+880m+250m. Ratio of rise to span in this bridge is 1/8.8 and the distance of two main cables is 39.20 m. The width and height of the girder is 42.00 m and 3.50 m, respectively. The middle span is a suspension structure. Width of sidewalk and medial strip is 2.00 m, and the side trip is 0.50 m wide. This bridge has eight-lanes and distributions of lane are shown in (Fig. 1).
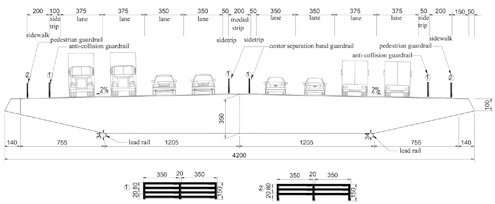
Standard cross-section of main girder (cm).
Attachment structures in this wind tunnel test included pedestrian guardrail, anti-collision guardrail, center separation band guardrail and lead rail. Two kinds of guardrails were used in this experiment, and dimensions were shown in (Fig. 1).
Frequency and amplitude of free vibration can provide data support for bridge analysis, so it’s necessary to calculate the bridge’s dynamic properties. The whole bridge structure was scattered according practical situation. Girder, cable bent tower and pier were scattered as beam elements, cables were scattered as member elements, and secondary permanent load was scattered as mass element. Finite element model can be seen in (Fig. 2). Fundamental frequencies and amplitude of free vibration can be seen in (Table 1).
Natural frequencies and mode features of bridge.
| Free vibration mode | Self-vibration frequency (Hz) |
|---|---|
| Inverse symmetric vertical vibration of first order | 0.11625 |
| Symmetric vertical vibration of first order | 0.17446 |
| Symmetric torsion vibration of first order | 0.39726 |
| Inverse symmetric torsion vibration of first order | 0.44029 |
Allowable design value on vertical is 0.3441 m according to inverse symmetric vertical vibration of first order and 0.2293 m according to symmetric vertical vibration of first order [13]. Allowable design value on torsion is 0.2733° according to inverse symmetric torsion vibration of first order and 0.2466° according to symmetric torsion vibration of first order. Inverse symmetric vertical an torsion vibration of first order are taken as the permissible value of VIV amplitude on usual, therefore 0.3441 m on vertical and 0.2733° on torsion are taken .
2.2. Section Model
Section model of the bridge was made of wood. Pedestrian guardrails, anti-collision guardrails and center separation band guardrails were manufactured in plastic plates by machine. The section model was 2.1m in length, 0.7m in width, and 0.0583m in height with a scalar of 1/60 to the real bridge. It was fixed by eight springs on supports, providing a vibration system with two degrees of freedom which can simulate vertical and torsional vibration [14-15]. The distance of springs was 108.0cm. Two laser displacement sensors placed under the section model were used in testing the displacement of bridge. The distance between laser displacement sensors was 40.0cm.
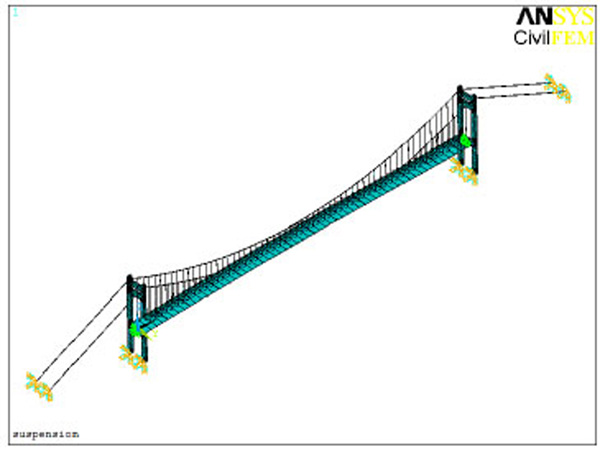
Finite element model of Cuntan Yangtze bridge.
2.3. Parameters
Wind tunnel test requires that the section model is similar to the real bridge in geometric dimensions, as well as frequency and damping ratio. But actually the section model of bridge can’t have similarity with the prototype model in all aspects. Deviation is allowable in the wind tunnel test. Allowable damping ratio deviation should be controlled less than 10% and allowable deviation of frequency, mass should be controlled less than 3% [13]. From Table 2, it can be calculated that the deviation is 4.3% on vertical bending damping ratio and 3.8% on torsion damping ratio, and other parameters keep the same as prototype modal. As a consequence, the results of experiment are effective.
Design parameters of VIV mode.
| Parameter | Unit | Actual value | Required value | Value in test |
|---|---|---|---|---|
| Height | m | 3.5 | 0.0583 | 0.0583 |
| Width | m | 42.0 | 0.7 | 0.7 |
| Linear mass | kg/m | 27600 | 7.667 | 7.667 |
| Linear mass moment of inertia | kg·m2/m | 5137700 | 0.3987 | 0.3987 |
| Vertical bending frequency | Hz | 0.17446 | 2.216 | 2.216 |
| Vertical bending damping ratio | % | 0.5 | 0.389 | 0.372 |
| Torsion frequency | Hz | 0.39726 | 5.404 | 5.404 |
| Torsion damping ratio | % | 0.5 | 0.439 | 0.422 |
According to the scale of section modal, frequency in Table 1 and Table 2, vertical wind ratio of 4.72 and torsion wind ratio of 4.41 are calculated [13].
3. WIND TUNNEL TEST
3.1. Working Conditions
The experiments were performed in the first test section of XNJD-1 wind tunnel. This test section is 2.40 m wide and 2.00 m high. The maximum wind velocity is 45.0 m/s and the minimum wind velocity is 0.5 m/s. Both turbulence flow less than 0.1% and uniform flow can be generated by this wind tunnel. The section model was placed in the middle of the test section and it spanned all the test section width. In fact a natural wind is a turbulent flow and a boundary layer exists near the surface of the ground, the effect of the boundary layer was neglected and the experiments were performed in a uniform flow. The condition in the wind tunnel tests was more severe than the actual condition because the side force estimated on this condition was considered to be larger than that in real-life condition [14].
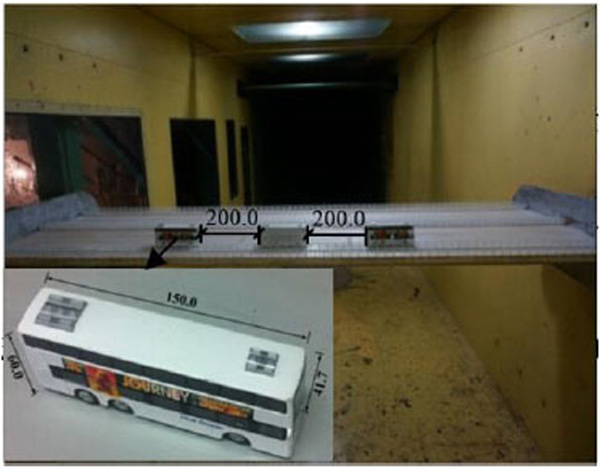
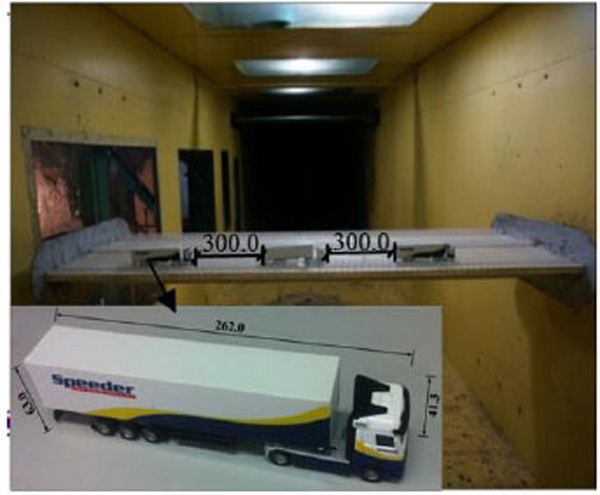
Influence of vehicle on the windward of section model is more significant than other locations [10].In order to observe vehicles’ influence on the bridge more easily, different types of vehicles were placed on the windward of section model. In this test, four typical types of vehicles were selected such as container car, double decker bus, single-decker bus and sedan car, and detailed information about dimensions and weight were shown in Table 3. In order to find the rules about vehicle effects on VIV of flat steel box girder, 17 working conditions listed in Table 4 were done. All of working conditions were done in XNJD-1wind tunnel at 0° wind attack angle with a uniform flow. When there was a vehicle on the bridge deck, it was located in the middle of exterior lane as shown in Fig. (3). When there were three vehicles on the bridge deck, the middle vehicle was placed in the middle of exterior lane and the other two were in a fixed distance from it, as seen in Fig. (4-6). The fixed distance referred to the distance from one vehicle’s front to the other’s back.
Dimensions and weight of vehicles.
| Vehicle | Width (mm) | Length(mm) | Height(mm) | Mass (g) |
|---|---|---|---|---|
| Container car | 41.3 | 262.0 | 63.0 | 205.0 |
| Double-decker bus | 41.7 | 150.0 | 60.0 | 194.0 |
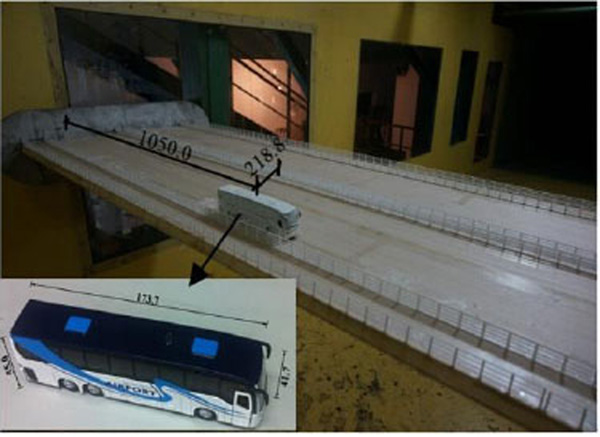
| Single-decker bus | 41.7 | 173.7 | 63.0 | 198.0 |
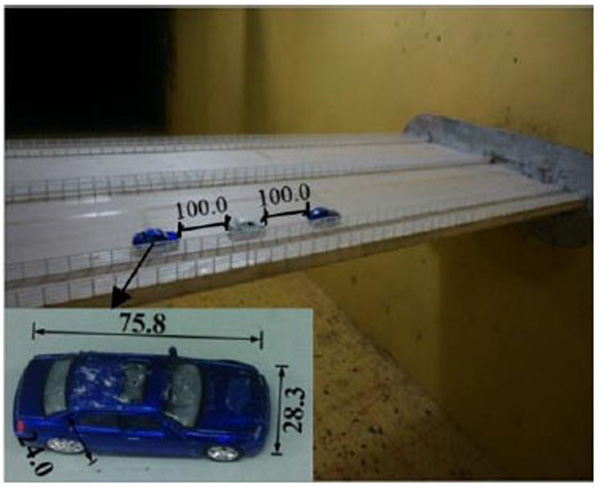
| Sedan car | 28.3 | 75.8 | 24.0 | 49.0 |
3# in wind tunnel test (mm).
Working conditions in wind tunnel test.
| Working condition | Type of vehicle | Number of vehicle | Space of vehicle (mm) | Space in actual (m) |
|---|---|---|---|---|
| 1# | container car | 1 | none | none |
| 2# | double-decker bus | 1 | none | none |
| 3# | single-decker bus | 1 | none | none |
| 4# | sedan car | 1 | none | none |
| 5# | container car | 3 | 100.0 | 6.0 |
| 6# | double-decker bus | 3 | 100.0 | 6.0 |
| 7# | single-decker bus | 3 | 100.0 | 6.0 |
| 8# | sedan car | 3 | 100.0 | 6.0 |
| 9# | container car | 3 | 200.0 | 12.0 |
| 10# | double-decker bus | 3 | 200.0 | 12.0 |
| 11# | single-decker bus | 3 | 200.0 | 12.0 |
| 12# | sedan car | 3 | 200.0 | 12.0 |
| 13# | container car | 3 | 300.0 | 18.0 |
| 14# | double-decker bus | 3 | 300.0 | 18.0 |
| 15# | single-decker bus | 3 | 300.0 | 18.0 |
| 16# | sedan car | 3 | 300.0 | 18.0 |
| 17# | no vehicle | none | none | none |
8# in wind tunnel test (mm).
10# in wind tunnel test (mm).
From Fig. (7) and Fig. (8), it can be seen that when there was no vehicle on the bridge deck, beginning of VIV wind speed started from 7.7 m/s.
13# in wind tunnel test (mm).
When there was a vehicle on the bridge deck, beginning of VIV wind speed was delayed and response of VIV was decreased. It can be calculated from Table 5 that vertical VIV decreased by 45.78%, and torsion VIV decreased by 86.93% at the extreme. From Fig. (7) and Fig. (8), it can be seen that different types of vehicles had different influence on VIV. Response of VIV was the smallest when there was a sedan car. All of responses were under the allowable design value. VIV can bring uncomfortable feelings to passengers and drivers, and hence working condition with a vehicle on the bridge is good for passengers and drivers because of decreasing in response of VIV. From Fig. (7) and Fig. (8), it can be seen that the VIV of the sedan car is the smallest in both vertical and torsional direction, so sedan car is more comfortable than other types of vehicles.
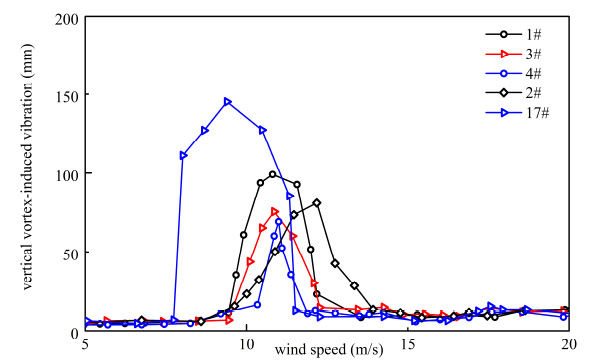
Vertical VIV with different types of vehicle.
Max response of VIV with a vehicle.
| Working condition | Max vertical vortex-induced vibration(mm) | Max torsion vortex-induced vibration(°) |
|---|---|---|
| 1# | 99.076 | 0.0545° |
| 2# | 80.790 | 0.0403° |
| 3# | 75.308 | 0.0374° |
| 4# | 69.046 | 0.0328° |
| 17# | 127.334 | 0.2510° |
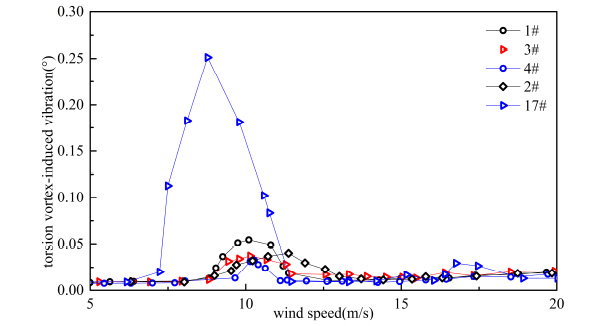
Torsion VIV with different types of vehicles.
3.2. Type of Vehicle’s Influence on VIV
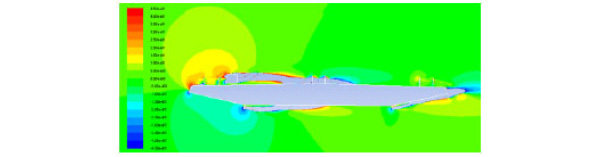
In order to find the mechanism of vehicles’ influence on bridges [16], ANSYS 14.5 was used to simulate the vortices from 7 m/s to 12 m/s wind speed which is the range of VIV for most working conditions. It was found that wind speed at 10 m/s can prove the mechanism from fluid dynamic point view better than others, and hence vortices simulation at 10 m/s wind speed was given. Middle cross section of model section was selected to analyze the mechanism. Vortices value between (0-5000)s-1 were shown in Fig. 9-11. From Fig. (9), it can be seen that vortices turned up around the attachment structures and the largest vortices value was concentrated on the pedestrian guardrail and lead rail on windward side. As can be seen in Fig. (9) and Fig. (10), the vortices had a great change when a sedan car was placed on the bridge. The sedan car changed vortices both on the bridge surface and under the bridge surface.
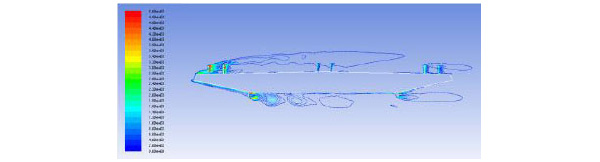
Vortices value without vehicle on the bridge (s-1).
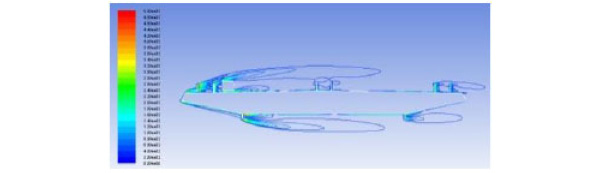
Vortices value with a sedan car on the bridge (s-1).
Vortices value decreased and the air flow was divided by sedan car on the bridge surface. Vortices value was increased and three vortices were combined into one under the bridge surface. Therefore, the response of VIV was induced by the sedan car. The same conclusion that the response of VIV was induced by the container car can be got from Fig (9) and Fig. (11) as stated above. In Fig. (10) and Fig. (11), when there were different types of vehicles on the bridge deck, vortices under the bridge surface didn’t change nearly but vortices on the bridge surface changed greatly, so different types of vehicles had different influences on VIV.
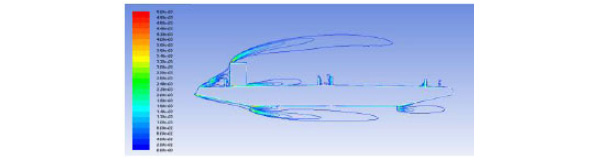
Vortices value with a container car on the bridge (s-1).
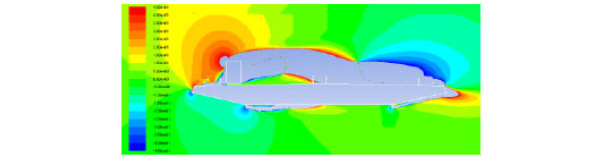
Vortices directions between (-45-45)°were shown in Fig. (12-14), and the aerodynamic configuration of the bridge saw a significant change due to the vehicles. From Fig. (12) and Fig. (13), it can be seen that the existence of the vehicle disrupted the aerodynamic flow around the bridge, and had a greater influence on the bridge surface than under the bridge surface. As seen in Fig. (13) and Fig. (14), vehicle section was one of the main factors that cause the changes in aerodynamic configuration of the bridge, and vortices direction around the container car was larger than the sedan car. Vortices direction was associated with lift force. Therefore the response of container car was larger than the sedan car.
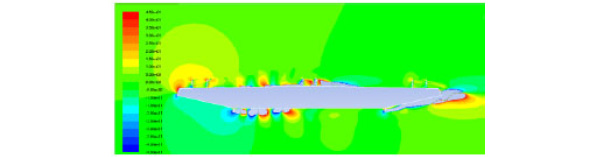
Vortices direction without vehicle on the bridge (°).
Vortices direction with a sedan car on the bridge (°).
Vortices direction with a container car on the bridge (°).
From Figs. (15-22), it can be seen that both of response and range of VIV with three vehicles were greater than a vehicle on bridge.
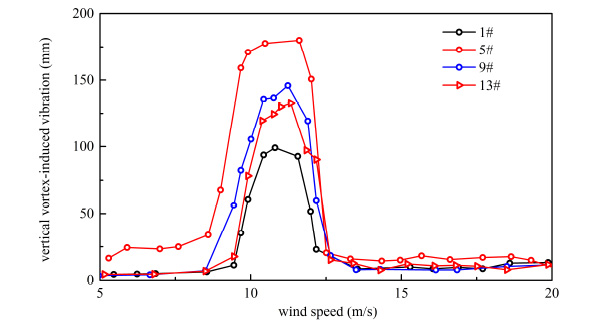
Vertical VIV of container car flow.
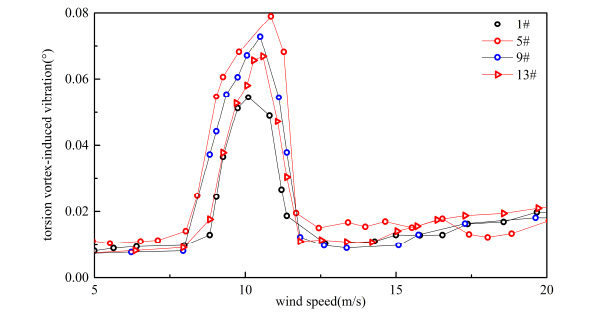
Torsion VIV of container car flow.
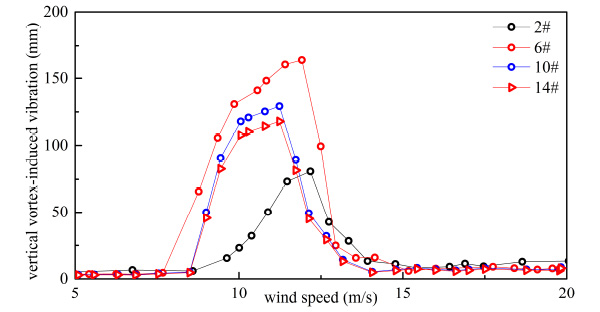
Vertical VIV of double-decker bus flow.
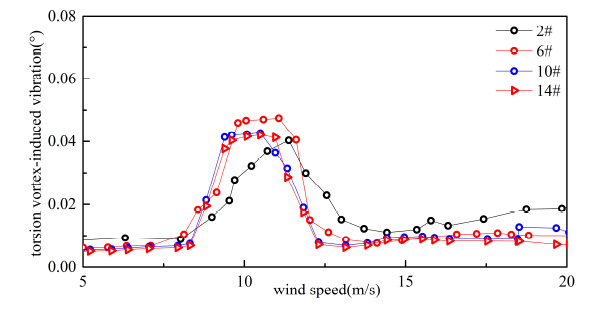
Torsion VIV of double-decker bus flow.
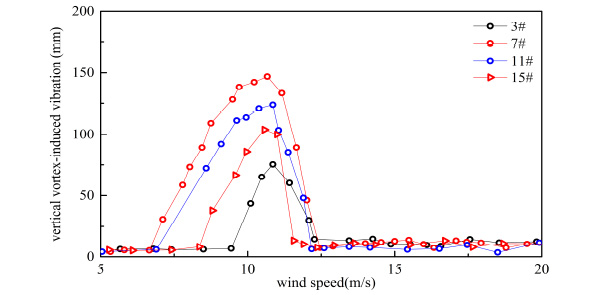
Vertical VIV of single-decker bus flow.
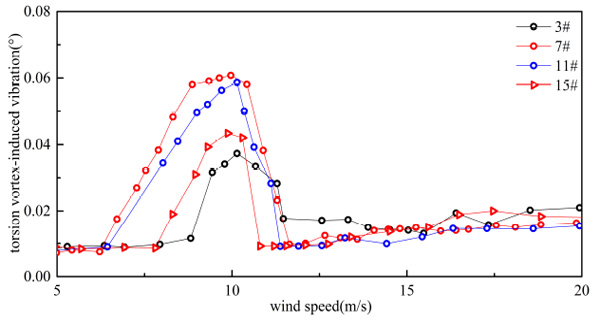
Torsion VIV of single-decker bus flow.
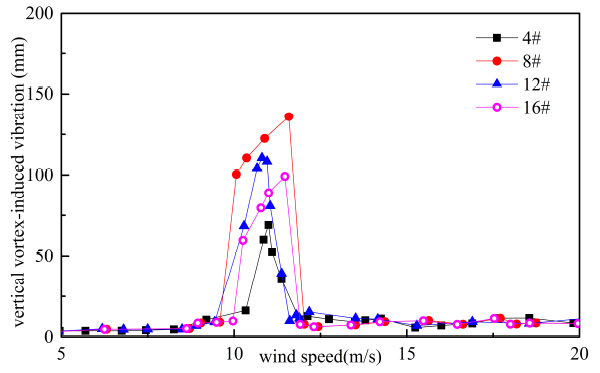
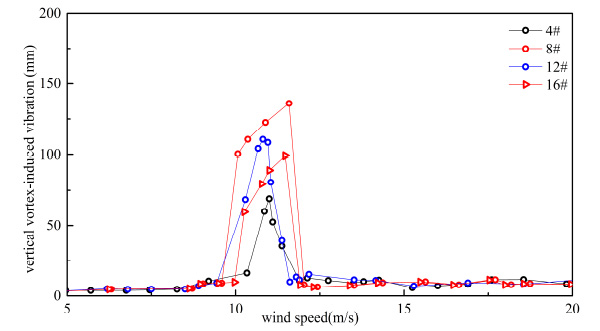
Vertical VIV of sedan car flow.
From Table 5 and Table 6, when the number of vehicles changed from three to one, container car, double-decker bus, single-decker bus and sedan car’s vertical VIV decreased by 44.963%, 50.616%, 48.742% and 49.248% at most, respectively. By comparing Table 5 and Table 6, when the number of vehicles changed from three to one, container car, double-decker bus, single-decker bus and sedan car’s torsion VIV decreased by 26.324%, 14.277%, 38.770% and 27.044% at most, respectively. Vertical VIV was more sensitive than torsion VIV when the number of vehicle changed. Change of vertical vibration was the greatest when double-decker bus number changed, and change of torsional vibration was the greatest when single-decker bus number changed in four types of vehicles.
As shown in Table 6, response of VIV was influenced by the traffic flow’s distance. VIV was reduced when the distance of traffic flow increased. When the distance of vehicle flow changed from 6.0 m to 18.0 m, vertical VIV of container car flow, double-decker bus flow, single-decker bus flow and sedan car flow were reduced 25.823%, 27.931%, 29.245% and 27.095% respectively, and torsion VIV of container car flow, double-decker bus flow, single-decker bus flow and sedan car flow were reduced 15.57%, 11.392%, 28.501% and 19.551% respectively at the same condition. In general, the change of vehicles’ number had more significant influence on VIV than change of traffic flow’s distance. Vertical VIV was more sensitive than torsion VIV when the traffic flow’s distance changed.
Torsion VIV of sedan car flow.
Max response of VIV with three vehicles.
| Type of vehicle | Max vertical (mm) | Max torsion VIV (°) | ||||
|---|---|---|---|---|---|---|
| 6.0m | 12.0m | 18.0m | 6.0m | 12.0m | 18.0m | |
| Container car | 180.016 | 145.938 | 132.756 | 0.079 | 0.0727 | 0.0667 |
| Double-decker bus | 163.577 | 129.220 | 117.888 | 0.0474 | 0.0427 | 0.042 |
| Single-decker bus | 146.921 | 123.780 | 103.954 | 0.0607 | 0.0586 | 0.0434 |
| Sedan car | 136.046 | 110.553 | 99.185 | 0.0445 | 0.0386 | 0.0358 |
The vehicle can resist and separate the airflow on windward side. The airflow tunnel was narrowed and speed of airflow was accelerated when the distance between vehicles decreased. Pressure of separation recirculating flow was decreased on the leeward side. The effect of pressure intensity sink became more evident with the decreasing of distance between vehicles, which implied the resistance became larger. In consequence, the response of VIV with three vehicles was greater than a vehicle on bridge.
CONCLUSION
- VIV is related to type of vehicle. VIV is reduced when there is a vehicle on the windward side of bridge. Different types of vehicles have different influences on VIV. Compared with conditions without vehicles, VIV is reduced most heavily when a sedan car is on the bridge in four types of vehicles, and hence sedan car is more comfortable than other types of vehicles. The vehicle disrupts the aerodynamic flow around the bridge, and has a greater influence on the bridge surface than under the bridge surface. The aerodynamic configuration of bridge is changed by the vehicle greatly.
- VIV is related to the number of vehicle. Response of VIV and range of VIV with three vehicles are greater than a vehicle on the bridge. Vertical VIV is more sensitive than torsion when the number of vehicle changed.
- VIV is related to the distance of traffic flow. VIV is reduced when distance of traffic flow increases. The single-decker bus flow has the largest influence on VIV at the same condition in four types of vehicles. The airflow tunnel is narrowed and speed of airflow is accelerated when the distance between vehicles decreases. In consequence, response of VIV with three vehicles is greater than a vehicle on the bridge.
CONFLICT OF INTEREST
The authors confirm that this article content has no conflict of interest.
ACKNOWLEDGEMENTS
This work was funded by science and technology project of Chongqing Municipal Construction Commission (20130844) and National Science Foundation of China (51578098).

