All published articles of this journal are available on ScienceDirect.

Study on Security Angle of Gas Pipeline Elbow Based on Stress Analysis Method
Abstract
The gas pipelines usually undergo complicated and changeable regional environment. As the level of the potential difference or pipeline’s route changes in the space and therefore elastic bending cannot meet the needs when pipe changes its direction, we generally use pipe bend to connect two pipelines with different spatial extend direction during the pipe laying period, and it can reduce the temperature stress. Unreasonable design of elbow will lead to pipeline damage. We established mountain area pipeline model, and conducted analysis on pipeline stress under different elbow angles. Research shows that different angles of the bends suffer different operation stress, and we have come to the conclusion that the angle of pipe bends should not be within the range of 15 degrees to 35 degrees.
1. INTRODUCTION
There are a variety of reasons that can cause pipeline failure, such as material defects, corrosion, third-party damage, design defects, misuse, and geological disasters. However, there is amost important influencing factor, that is, the extremely high stress due to the failure of damage.
Stress can affect the safe operation of oil and gas pipelines to a large degree. During the long-distance pipeline construction process, it will inevitably go through the mountains, hills and other complex locations. Therefore, pipeline stress concentration is the weakness of pipe system security in complex mountainous area. The stress concentration exceeds allowable stress of the pipelineeasily which will lead to failure damage for the pipe and make it unable to meet the strength requirements.
When gas pipeline goes through the mountains, some special place, especially at the elbow, often cannot meet the strength and flexibility requirements. Currently, scholars and researchers conducted few pipeline stress analysis research and the design of the structure relies only on empirical parameters. The pipe stress analysis should be taken seriously in the pipeline design stage. In order to ensure pipeline safety and reduce security risks, it is necessary to do research on pipeline stress analysis and determine the security elbow angle range.
Nowadays, pipe stress analysis software CAESAR II is most widely used. Intergraph developed CAESAR II whichhas a powerful static and dynamic calculation and analysis capabilities. It includes pipeline combined load stress calculation and analysis, container nozzle flexibility and stress check analysis, natural frequency, time history analysis.Its theory is one-dimensional beam element finite element method. And its pipe stress check method follows the relevant provisions of the American National Standards B31.
In this paper, we simulate the XX pipeline using stress analysis software CAESAR II to explore the pipeline stress distribution and determining where the stress concentration of key points is. The main factors of the gas pipeline stress have been obtained through comparative analysis. And eventually we come to the security elbow angle range by doing stress analysis of the different angle of the pipeline elbows.
2. METHODS
Gas pipeline stress analysis is divided into three steps: pipeline model establishment, load cases definition and static analysis.
Pipeline model establishment: Pipeline model includes piping input, soil (for buried pipeline). The actual project, pipeline system, is composed of a variety of devices and supporting accessories, so modeling needs to add kinds of constraints to limit the displacement of the pipe. In CAESAR II software, we need to input the constraint node and the type of constraints.
In the overburden process, we need to set soil parameters (internal friction angle, soil depth, the linear expansion coefficient, etc.) and select buried point and unearthed point.
Load cases definition: In CAESAR II software, according to the stress analysis needs, conditions can be calculated separately, or can be combined. The result of the combined condition is calculated for each individual condition of linear summation. Usually set loads are pressure, temperature, gravity and uniform load and so on.
Static analysis: After the pipe and soil model is complete, CAESAR II can output the stress analysis report. Analysis report not only lists the bending stress at each node, the node stress, hoop stress, operating stress ratio, etc., but also lists the displacement of each node and constraint conditions. We can check it according to the specification.
3. CLASSIFICATION AND CHECKING CRITERION OF GAS PIPELINE STRESS
The basic stress can be divided into the hoop stress, axial stress, radial stress and shear stress (Fig. 1). CAESAR II software follows ASME B31.8 Gas Transportation and Distribution Piping Systems specification. According to the checking method of the CAESAR II software, stress is usually divided into primary stress σL, secondary stress σE and peak stress σOPE [1, 2].
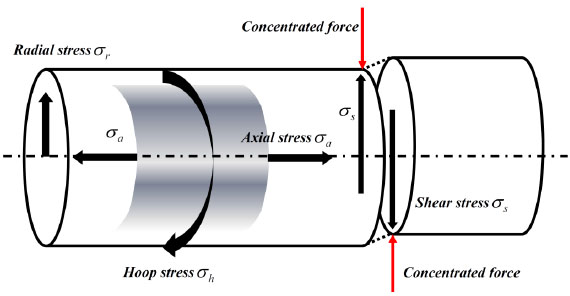
Schematic diagram of pipe stress.
Peak stress which can lead to brittle fracture and fatigue failure is the maximum stress value of local stress concentration due to the sudden change of load and abrupt deformation of shape and structure. It should be less than or equal to the minimum yield strength of the pipe σS, scilicet σOPE≤σS.
Primary stress which mainly brings about plastic failure is normal stress or shear stress in the pipe caused by external load, and it does not have characteristic of self-limiting. Specification requires that primary stress σL must not exceed the allowable stress of the pipeline [σ], scilicet σL ≤ [σ].
Secondary stress which has characteristic of self-limiting and localization and mainly leads to fatigue failure is normal stress or shear stress caused by constraints due to the deformation of the pipe. Specification requires secondary stress σE must not exceed the allowable stress range σa, scilicet σE ≤ σa.
4. CASE STUDY OF BURIED XX GAS PIPELINE
4.1. Project Overview
In this paper, we did research on XX pipeline. The design pressure of XX project pipeline is 12MPa, and operating temperature is 50 °C.
According to the design information of XX pipeline, project uses the API X80 steel pipes, specifications for Φ1219×18.4mm, wall thickness of elbow is 23.8mm, pipe allowable stress is 555MPa.
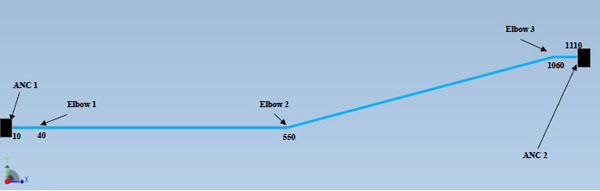
Total length of the pipeline model is 1080m, pipeline inlet and outlet will be respectively installed with fixed buttress 1 and fixed buttress 2, which are used to block the effect from outside the pipeline on the model. On the west side in the soil before the guidance, there is a 30m long section, and the angle between this section of the pipeline and the buried department is 60°. The length of the west drift is about 490m; the length of slope section pipeline is 500m, the longitudinal slope of this slope is 15°. The length of the east drift is 50m.From west guidance to the east fixed buttress 2, this section of pipeline is buried, and the buried depth is 1.2m (Fig. 2).
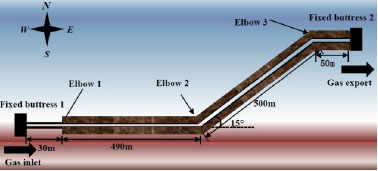
Schematic diagram of XX pipeline route.
The curvature radius of the gas pipeline elbow is R=6D, D represents the pipe diameter. The length of elbow calculated according to Eq. (1). Specific pipe parameters are shown in Table 1, the soil parameters are shown in Table 2, elbow parameters shown in (Table 3).
| Material | Diameter(mm) | Wall thickness of straight pipe (mm) | Wall thickness of Pipe bend(mm) | Corrosion(mm) |
|---|---|---|---|---|
| API X80 | 1219 | 18.4 | 23.8 | 1 |
| Fluid density(kg/m3) | Insulating layer thickness(mm) | Pressure(MPa) | Temperature(°C) | Allowable stress(MPa) |
| 95 | 0 | 12 | 50 | 551.6 |
| Friction coefficient | Soil density(kg/m3) | Buried depth to top of pipe(m) | Friction angle | Yield displacement factor | Over-burden compaction multiplier | Thermal expansion coefficient |
|---|---|---|---|---|---|---|
| 0.6 | 2650 | 1.2 | 37° | 0.015 | 5 | 11.214 |
 |
(1) |
| Location | Specification | Quantity | Remark |
|---|---|---|---|
| Elbow 1 | hot bending elbow ϕ1219×23.8 α = 60° | 1 | API X80 steel R=6D |
| Elbow 2 and elbow 3 | hot bending elbow ϕ1219×23.8 α = 5°~50° | 2 | API X80 steel R=6D |
4.2. Model Overview
According to engineering data, pipeline model is divided into straight pipe, inclined pipe and elbow. For straight pipe model, we only need to input the length of pipeline in one direction (Fig. 3a). Inclined pipe model at least requires the length of pipeline in two directions or the cosine value of the intersection angle (Fig. 3b). In this case, the longitudinal slope of this slope is 15 °, so we need to input Cos X=0.966 and Cos Y=0.259. The establishment of elbow needs to input the curvature radius of the elbow (Fig. 3c). The effect picture of the overall model is shown in (Fig. 5).
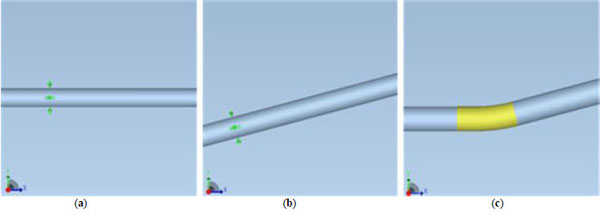
Three kinds of piping system model (a) Straight pipe model (b) Incline pipe model (c) Elbow model.
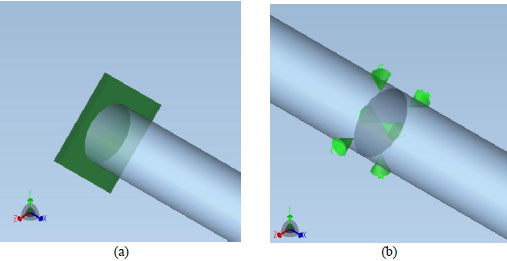
Constraint model (a) Fixed buttress model (b) Soil load model.
In this paper, as the project is buried pipeline, we need to establish these two constraint models: one is fixed buttress model; another is soil load model [3].
(a) Fixed buttress model: Fixed buttress is used to block the outside pipelines’ effect on the model, it is a pipeline fitting which can limit the axial displacement, so we simplify it to ANC constraint (Fig. 4a).
(b) Soil load model: The soil around buried pipeline, in addition to the pipe with longitudinal and transverse constraint, there is an axial friction. So the soil load model is simplified to the +Z and-Z constraints on the Z direction, +Y and-Z constraints on the Z direction, LIM constraints on the axial direction (Fig. 4b).
The effect picture of the overall model.
4.3. Define the Load Cases
As the study subjects were buried pipeline and in a relatively closed environment, the main static analysis checking loads are the weight W, the internal pressure P and temperature T [4].
In software, peak stress condition is expressed as [OPE]D1=W+P+T.
In software, primary stress condition is expressed as [SUS]D2=W+P.
In software, secondary stress condition is expressed as [EXP]D3=D1-D2.
Where,
W=Weight load;
T=Temperature load;
P=Pressure load.
5. RESULTS AND DISCUSSION
5.1. XX Pipeline Stress Analysis Results
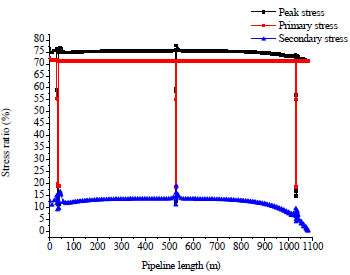
Stress analysis report of software CAESAR II includes the points stress value, displacement and constraint conditions. From Tables 4 to Table 6 is the check situation of the peak stress, primary stress and secondary stress. Fig. (6) is the distribution of XX gas pipeline peak stress, primary stress and secondary stress [5-9].
| Type | Stress (kPa) | Node | Location | Ratio (%) | Allowable stress(kPa) |
|---|---|---|---|---|---|
| Code Stress | 385709.3 | 550 | Elbow 2 | 77.6978 | 496422.5 |
| Bending | 27334.95 | 542 | Elbow 2 | 5.506388 | |
| Torsional | 0 | 20 | Fixed buttress 1 | 0 | |
| Axial | 65361.24 | 20 | Fixed buttress 1 | 13.16645 | |
| Hoop | 397500 | 20 | Fixed buttress 1 | 80.07292 | |
| 3D Max Intensity | 426431.8 | 20 | Fixed buttress 1 | 85.90098 |
According to the ASME B31.8 specification, pipeline stress should not exceed 90% of the pipeline’s allowable stress. From Tables 4, 5, and 6, it can be seen that the maximum stress mostly generates at the elbow 2 and fixed buttress 1, and the maximum node stress does not exceed 0.9[σ]=496422.5kPa, which meets the strength and flexibility requirements.
According to Fig. (6), it can be obtained that:
(1) Maximum peak stress and secondary stress generate at elbow 2. Once again it illustrates the elbow is the key point of stress concentration of pipeline.
(2) Secondary stress is significantly less than the peak stress and primary stress, which proves that the pressure is the main factor affecting pipe stress, and temperature impact has little effect on the pipeline stress.
| Type | Stress (kPa) | Node | Location | Ratio (%) | Allowable stress(kPa) |
|---|---|---|---|---|---|
| Code Stress | 359521.5 | 10 | Fixed buttress 1 | 72.4225 | 496422.5 |
| Bending | 24186.98 | 10 | Fixed buttress 1 | 4.872257 | |
| Torsional | 0 | 20 | Fixed buttress 1 | 0 | |
| Axial | 119250 | 20 | Fixed buttress 1 | 24.02188 | |
| Hoop | 397500 | 20 | Fixed buttress 1 | 80.07292 | |
| 3D Max Intensity | 426431.8 | 20 | Fixed buttress 1 | 85.90098 |
| Type | Stress (kPa) | Node | Location | Ratio (%) | Allowable stress(kPa) |
|---|---|---|---|---|---|
| Code Stress | 94473.64 | 550 | Elbow 2 | 19.03089 | 496422.5 |
| Bending | 27334.76 | 542 | Elbow 2 | 5.50635 | |
| Torsional | 0 | 42 | Elbow 1 | 0 | |
| Axial | 67752.25 | 780 | East slope midpoint | 13.6481 | |
| Hoop | 0 | 20 | Fixed buttress 1 | 0 | |
| 3D Max Intensity | 99773.03 | 550 | Elbow 2 | 20.09841 |
The distribution of XX gas pipeline peak stress, primary stress and secondary stress.
5.2. Stress Analysis of Different Angle Elbow
We do stress analysis of different elbow angle pipeline using CAESAR II software. Elbow angle range is 5 to 50 degree, and different elbow angles have different lengths (Table 7).
| Angle(°) | 5 | 10 | 15 | 20 | 25 | 30 | 35 | 40 | 45 | 50 |
|---|---|---|---|---|---|---|---|---|---|---|
| Elbow length(m) | 0.64 | 1.28 | 1.91 | 2.55 | 3.19 | 3.83 | 4.47 | 5.10 | 5.74 | 6.38 |
It can be seen from Fig. (7), peak stress and secondary stresses have the same trend. From 10 degrees to 25 degrees, stress ratio shows a rising trend; on the contrary, from 25 degrees to 50 degrees, the stress ratio shows a downward trend. What’s different is that the ratio of secondary stress almost stay the same (Table 8).
In order to ensure the safe operation of the pipeline, we propose to set the angle of elbow away from the range of 15 degrees to 30 degrees as far as possible.
| Elbow angle(°) | 5 | 10 | 15 | 20 | 25 | 30 | 35 | 40 | 45 | 50 |
|---|---|---|---|---|---|---|---|---|---|---|
| Peak stress ratio (%) | 76.20 | 77.03 | 77.70 | 78.07 | 78.09 | 77.81 | 77.34 | 76.74 | 76.17 | 75.64 |
| Primary stress ratio (%) | 71.18 | 71.18 | 71.18 | 71.18 | 71.17 | 71.17 | 71.17 | 71.17 | 71.17 | 71.17 |
| Secondary stress ratio (%) | 15.57 | 17.52 | 19.03 | 19.84 | 19.89 | 19.29 | 18.23 | 16.85 | 15.50 | 14.19 |
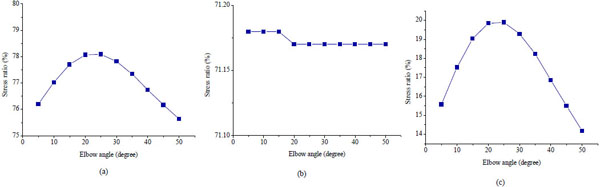
Stress ratio of elbow 2 (a) Peak stress (b) Primary stress (c) Secondary stress.
CONCLUSION
In this paper, we have come to the conclusion that the elbow is the stress concentration point by XX pipe stress analysis, pressure distribution analysis and fluid disturbance analysis. Through comparison of peak stress, primary stress and secondary stress, we have drawn the conclusion that the pressure is the main factor affecting pipe stress, and temperature has little effect on the pipeline stress.
We perform stress analysis of different elbow angle pipeline using CAESAR II software, and conclude that the peak stress and secondary stress get bigger before they are smaller in the range of 5 to 15 degrees. Considering that the slope of longitudinal slope is usuallygreater than 30 degrees in the tunnel crossing engineering, we suggest setting the elbow angle outside the range of 15 degrees to 30 degrees.
CONFLICT OF INTEREST
The authors confirm that this article content has no conflict of interest.
ACKNOWLEDGEMENTS
Declared none.

