All published articles of this journal are available on ScienceDirect.
Simulation of Well Wall Stress Distribution Model and Well Stability
Abstract
Horizontal well has gained increasing importance in oil and gas development. Thus stress distribution models around the horizontal well attract more people than earlier. In the last few years, a lot of stress distribution models have been proposed by domestic and international scholars. Through numerical simulation analysis, the differences between five models have been analyzed. The classic model suits for qualitative characterization. Using D-P principle to judge well wall stability of different models instructs that the differences between models decrease with the increase of stability factor.
1. INTRODUCTION
With the increasing complexity of oil and gas reservoir, horizontal well has been used in growing numbers in fields. The stability of horizontal well concerns more people. Scholars have proposed different kinds of models to predict the stress distribution around the well wall.
In 1898s, Kirsch established the 2-D stress distribution formulae around borehole in elastic plates [1]. And then Jaeger and Cook made a thorough derivation of Kirsch’s formulae [2]. B. Haimson and C. Fairhurst put forward a classic model to predict stress distribution based on elastic mechanics [3]. The model is established for linear elastic formation, which makes it suitable for completely homogeneous formation, regardless of pore pressure effect, permeability effect, Burshtein, Fairhurst and Adler et al. derived bilinear stress formulae for beams [4-6]. Haimson further investigated the stress distribution in bilinear elastic rocks and realized that stresses around circular holes are a function of the material’s elastic properties [7].
And then several researchers studied the additives attached to the classic models [8, 9]. Nowadays, the stress distribution models spread towards heterogeneous formation and become increasingly accurate and complex. Lekhnitskii received displacement distributions of vertical well under two direction stress condition [10]. Nevertheless, the classic homogeneous model is still important and worth-studying.
In this paper, classic model and several models with added items were combined with numerical simulation study. All of the simulations are operated on homogeneous and isotropic formation, assuming that the rock of well wall is linear-elastic. And the effect of temperature is ignored.
Reservoir numerical simulation study was put forward in the middle of the 20th century. Watson, et al. used ideal dual porosity medium model to do numerical simulation of shale capacity [11]. Bustin studied the effects of crack spacing and matrix diffusion on shale capacity [12].
Wu established fractured tight-gas reservoirs multiple media model [13]. With the progress of science and technology, several scholars choose numerical simulation softwares to study the reservoir and rock situation around the well. In this paper, the authors used FEM (finite element method) software to simulate the stress distribution around the well.
2. RESEARCH ON STRESS MODELS
2.1. Haimson-Fairhurst Model
The classic model, the most famous and widely used one, was proposed by B. Haimson and C. Fairhurst [3, 7, 14]. The basic theories used in the model are the additivity of pressure and theory of elasticity. The authors separated the pressure field around the well into four parts according to the cause of pressure fields, maximum horizontal principal stress σH1 , minimum horizontal principal stress σH2, vertical stress σv, and wellbore pressure pwf Fig. (1). To make it easier to calculate, they changed the coordinates into rectangular coordinates whose Z axis coincides with well axis, so that the original σH1, σH2 and σv will be changed into σxx, σyy, σzz, τxy, τxz, and τyz under new coordinates Fig. (2).
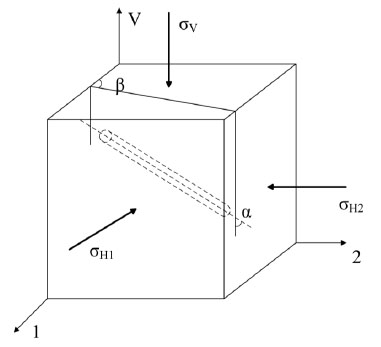
Original stress distribution.
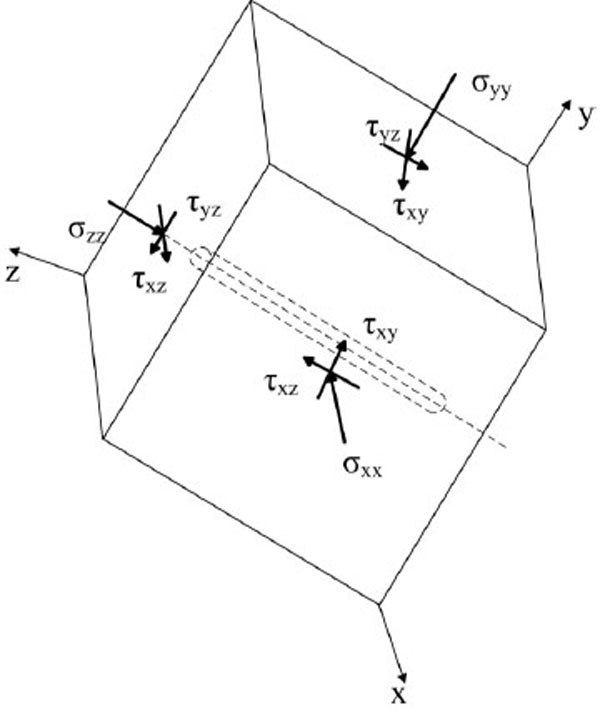
Changed coordinate.
 |
(1) |
 |
(2) |
 |
(3) |
 |
(4) |
 |
(5) |
 |
(6) |
Where α is the hole deviation angle; β is the hole azimuth angle. For horizontal well, α = π/2, we have received the coordinates changed equations as followed:
 |
(7) |
 |
(8) |
 |
(9) |
 |
(10) |
 |
(11) |
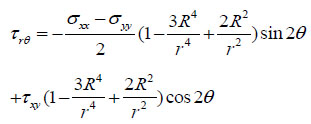
Based on the stress additivity theory, B. Haimson and C. Fairhurst derived the stress distribution model around the well wall in cylindrical coordinates Fig. (3) as:
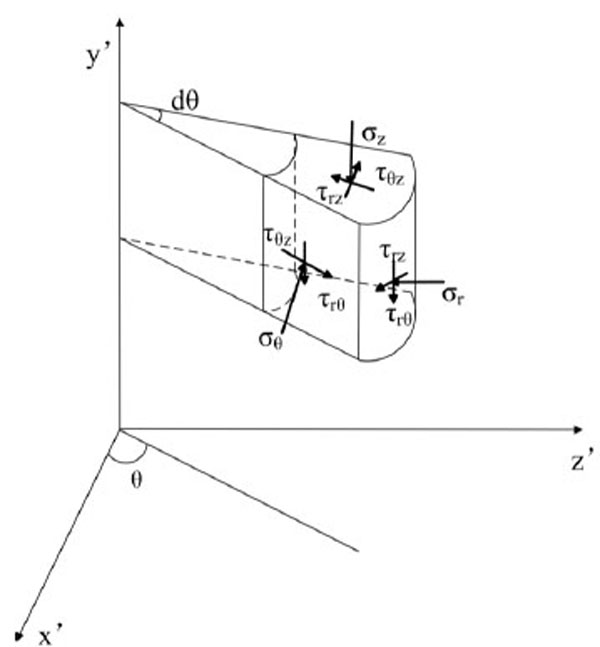
Bore hole cylindrical coordinate.
 |
(12) |
 |
(13) |
 |
(14) |
 |
(15) |
 |
(16) |
 |
(17) |
Where r is the stress point radius from well axis, m; R is the well radius, m; θ is the around well angle, rad.
And if r=R, combined with equation (12)-(17), we derive the stress distribution on well wall.
 |
(18) |
 |
(19) |
 |
(20) |
 |
(21) |
 |
(22) |
The H-F model is widely used in the wellbore pressure prediction. If the formation around the well is extraordinarily homogeneous and the pressure field around the well can be simplified into 2 dimensions, the relative simple form can also be simplified into a simpler form, a 2D form. While in most cases, the formation is not totally homogeneous, but under most situation ns, we can regard the formation as homogeneous and linear elastic one that can use the H-F model. If the formation is too far heterogeneous, we add attachments to the origin equations.
2.2. Percolation Equations
Considering actual down well operation, the drilling fluid is injected into the formation. As we know, the wellbore wall is permeable. So it’s reasonable to consider the stress field caused by wall permeability. According to [8, 9], items should be added.
 |
(23) |
 |
(24) |
 |
(25) |
With the equations above and equations (18-22), when r=R, we derive the model considering percolation.
 |
(26) |
 |
(27) |
 |
(28) |
 |
(29) |
 |
(30) |
Where δ is the permeability coefficient, its value is 1 when permeable, otherwise 0; Ø is the porosity; Pwf is the pressure inner the well, MPa; P0 is the pore pressure, MPa; η is the Biot coefficient; v is the Poisson’s ration.
2.3. Biot Coefficient Addictive
In the last few years, an increasing attention has been paid on Biot coefficient [15, 16]. The effect of pore pressure, during calculation of wellbore pressure distribution, can not be ignored. Therefore, another additive to the equations has now been considered as follows:
 |
(31) |
 |
(32) |
 |
(33) |
Where P0 is the pore pressure, MPa; η is the Biot coefficient.
2.4. Three Principle Stresses
Three principle stresses [17] are obtained from stress components in cylindrical coordinates.
 |
(34) |
 |
(35) |
 |
(36) |
After calculating the values, σ1 is the maximum of the three values, σ2 is the medium value, and σ3 is the minimum of the three values.
3. SIMULATION AND RESULTS COMPARISON
Numerical simulation based on FEM has been widely used. The numerical simulation can imitate the fluid-structure interaction process. Moreover, the simulation takes the flow, the effective stress coefficient, et al., into consideration. According to various models’ requirements, the distinct boundary conditions are considered. After that, the model is divided into grids for software to use adaptive mesh. Depending on different accuracy requirements, the grids can be tetrahedrons or hexahedrons. Using numerical simulation to predict and calculate reservoir condition has been widely used since the late 20th century. The modeling method and theory decide that the numerical simulation is reliable. In addition to this, scholars [18-21] discussed this issue and verified its reliability. So for homogeneous and isotropic formation mentioned in this article, the numerical simulation is regarded as real stratum situation. Fig. (4) is the model established by FEM software.
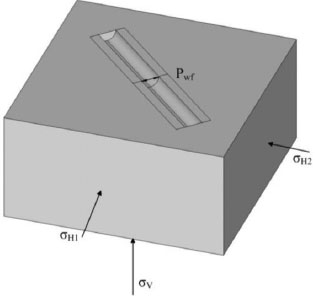
Simulation model.
To compare the above equations with numerical simulation results, we used the data from a horizontal well of Northwest of China. And the basic data of the well and rock are listed in Table 1. Where E is the Young’s Modulus; v is the Poisson’s ratio; R is the radius of the well; Ø is the porosity; η is the Biot coefficient; δ is the permeability coefficient; r is the length from well axis; Ψ is the internal friction angel and C is cohesion. In addition, we assume that the formation is homogeneous, regarding the effect of temperature, and the rock breaks once the stress reaches the limit value.
Fig. (5) and Fig. (6) are images of stress distribution of numerical simulation result. Particularly, Fig. (6) is the vision from the middle cross section. The figures show that the points on well wall in the horizontal direction have the minimum stress value, while the ones in vertical direction have the maximum value.
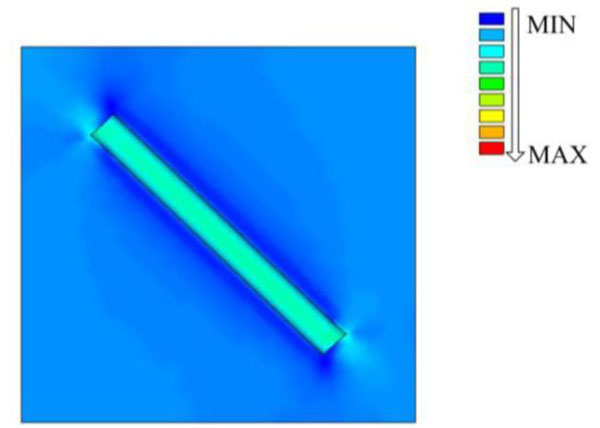
Stress distribution.
According to the different models mentioned above and the numerical simulation, we are able to replay the stress distribution directly (Fig. (7) - Fig. (10)). In figures, σ represents the classic H-F model stress; σP represents the stress of H-F model considering percolation equations; σB represents stress of equations which have Biot coefficient additives; σPB represents the stress of model of H-F model with both percolation equations and Biot coefficient additives; and σA represents the numerical results. The number 1, 2, 3 mean the 1st, 2nd and 3rd principle stress around the well.
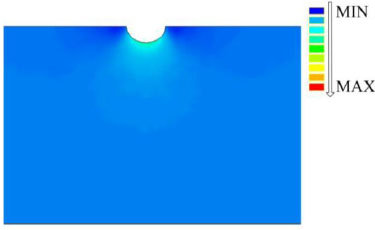
Stress distribution of cross section.
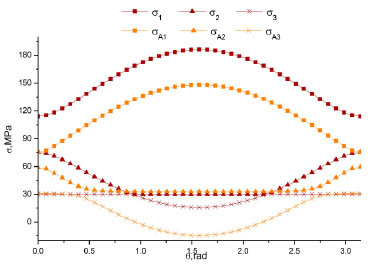
Three principle stress of δA and δ.
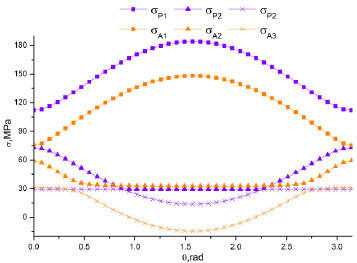
Three principle stress of δA and δP.
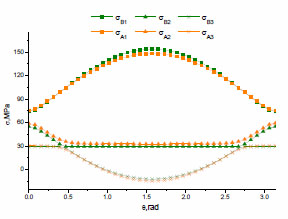
Three principle stress of δA and δB.
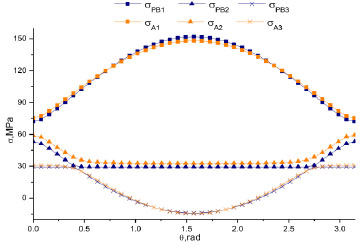
Three principle stress of δA and δPB.
As it can be seen from figure, the relation between σA and σ varies widely, but the trend along the well round angle is almost the same: so does the relation between σA and σP. Meanwhile, the relation between σA and σB and the relation between σA and σPB are far more ideal. σPB and σA have almost the same value and trend. So it shows that the model with both percolation equation and Biot’s coefficient is the most accurate solution. But the classic model with Biot coefficient is also accurate and representative to predict the stress distribution. If the Biot coefficient of a formation is too small or the pore pressure is smaller compared to the three principle pressure, we can ignore the effects of them. Then the σ and σP models are accurate and simple. Beyond that, we can further instruct that the numerical simulation is reasonable for wellbore wall stress prediction.
4. WELL STABILITY
The wellbore stability is characterized by many principles such as the Mohr-Coulomb Principle, the Drucker-Prager Principle, the Von Mises Principle, the Griffith Principle, et al. Here we use Drucker-Prager Principle [17, 22]. And the well stability is judged by stability factor S.
The Drucker-Prager Principle is known as following equations:
 |
(37) |
 |
(38) |
 |
(39) |
 |
(40) |
Where J1 is the first constant stress tensor; J2 is the second constant stress tensor; H1 and H2 are material parameters.
The stability of the well wall is judged by stability factor S, which is known as equation (41). The stability gains with the increase of S.
 |
(41) |
With the equations above, we compare the stability factors derived from the five models above, S, SA, SB, SP and SPB.
Fig. (11) is the comparison of five different stability factors. Combined with Fig. (6), for all the stability factors, the weakest points are on the well wall in horizontal direction (θ=0 or π), while the max values occur in the vertical direction (θ=π/2 or 3π/2). And they are close between different models. Stability factors of different models are not the same. Nonetheless, the stability factor of simulation model, model considering of Biot coefficient and model considering of both Biot coefficient and percolation are almost the same around the weakest well wall points. Around the strongest well wall points, the model with percolation is the closest to the simulation value.
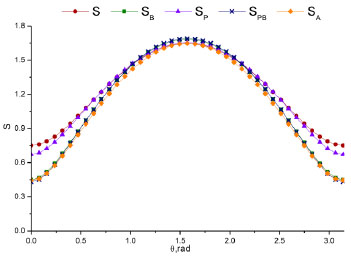
Stability factors of different models.
CONCLUSION
Following conclusions have been drawn from this study:
- The four kinds of analytic solution have the same trend with simulation solution. Although the value between them has differences, all of the four models are representative to forecast the stress trend around the well wall.
- Classic Haimson-Fairhurst model is the simplest one, which can be used for qualitative analysis. And yet the most accurate solution is the model with Biot coefficient additive and percolation additive. While the percolation equation has little effect on the value, so the classic model with Biot coefficient additive is also accurate.
- With the increase of well wall stability, the differences between different models decrease. All the models have the same trend along the well wall angle and have almost the same biggest stability factor value. Around the weakest points of well wall, model SB, model SPB and simulation model is highly similar. While around the strongest points of well wall, simulation model is similar to SP.
For predicting the stress around the well wall, the classic model is suitable for qualitative analysis. According to the demand of accuracy, chose the proper model for predicting the stability distribution.
CONFLICT OF INTEREST
The authors confirm that this article content has no conflict of interest.
ACKNOWLEDGEMENTS
This research is supported by the National Natural Science Foundation of China Petrochemical Joint Fund Project (U1262209) and applied basic research projects of Sichuan province ‘Formation of Large Scale Pressure Fracture Network of Horizontal Well Borehole Trajectory Optimization Research’ (2014JY0092).


