All published articles of this journal are available on ScienceDirect.

Stress Analysis of Oil Pipe Bend in a Hilly Region Under Pigging Conditions
Abstract
Pigging is a significant part of a pipeline system that is required for production and operational maintenance. However, if the bend is not set properly, it is likely to cause congestion, which could cause the pipeline system to deviate from its normal operation or even lead to cracks or explosions due to overloaded stress. Due to the potential risk mentioned above, this report aims to build an oil pipeline model using the finite software CAESAR II and analyze the stress in the bend of an oil pipe under pigging conditions in a hilly region. Based on the comparison of the maximum stress in a pipe bend using different angles, the author concludes that to guarantee the safety and efficiency of the pipeline system, the angle of the pipe bend should be limited within a safe range of 15-40° under pigging conditions.
1. INTRODUCTION
With the rapid construction of pipeline networks around the world, pipeline accidents are bound to occur. These accidents not only cause damage to property but also threaten the staff’s safety as well as the environment. According to statistics, up until December 2012, dangerous liquids were transported through 279,000 km of pipelines, and 928 accidents occurred, which contributed to 218 casualties. In Canada, there were 34 pipeline accidents from 1992-2011. Based on a survey conducted by the European Gas Pipeline Incident data Group (EGIG), which monitors pipeline leak accidents among 15 countries in Europe, 1309 pipeline incidents have been recorded in the EGIG database from 1970-2013 [1]. Although the development of the domestic pipeline construction lags behind that of foreign countries, accidents still occur. Based on studies that investigate the cause of these accidents both at home and abroad, there are several reasons that contribute to the failure of pipelines, such as external disturbances, corrosion, material defects, mechanical damage, improper operation, and natural disasters [2]. Furthermore, the failure of a pipeline resulting from stress related problems is common; therefore, a proper analysis of the stress is significant for the reliability and efficiency of the pipeline network.
In 2008, Tang Yongjin investigated the characteristics of a pressured pipeline, including a stress analysis, pressured pipeline safety evaluation method, and checking criterion [3]. In 2011, Song Keke made a supplement to the content of stress analysis and made it circumstantial to the evaluation of the stress under certain conditions [4].
In 2012, Wu Xiaonan et al. modeled an inclined shaft in a tunnel and analyzed the stress under certain conditions [5]. In the same year, Huang Kun et al. created a stress analysis model of an elastic pipeline [6].
For nearly a year, the stress analysis of the pipeline primarily focused on particular regions or special conditions. In 2013, Wu Xiaonan constructed a stress analysis model of a perpendicular gas transport pipeline in a tunnel under earthquake conditions [7]. Moreover, Chen Liqiong proposed a method that determined the stress of a pipeline in a landslide area [8].
Pigging is a key factor that affects the production and maintenance of oil and gas pipelines; however, if the bend is not set properly, it could risk congestion at the pipe bend, which would lead to the failure of the pipeline system or even cracks or explosion due to the overloaded stress. By establishing a pipeline model under certain mechanisms, we can simulate the stress using finite element software. Moreover, analyzing the stress in the bend under pigging conditions allows us to understand the stress distribution and its values with a change in the bend angle for the convenience of reliable design as well as safe and efficient operation. Thus, it is necessary to conduct a stress sensitivity analysis at the bend of the pipeline.
2. THEORY AND METHOD
2.1. Stress Analysis of the Pipe Bend Under Pigging Conditions
Pigging is important for the safety and efficiency of the pipeline network, which cleans up the impurities and water content before the pipeline is put into production or during periods of operation. A pig is widely used under the pigging condition, which is based on the pressure of the fluid or other devices using water or gas pressure as the driving power. By moving along the interior of the pipe, the pig manages to scrape the deposit and move it out of the pipe [9].
The self gravity of the pig, resistance at the pipe bend during pigging, differential of the pressure before and after the pig and resistance of the fluid are not considered in this model.
The impact force of the pig to the bending point of the pipe is depicted, and the coordinate system is set as indicated in Fig. (1). The force to the bend is symbolized as F. According to the law of conservation of momentum, for the control volume presented in Fig. (1), the equations can be expressed as follows:
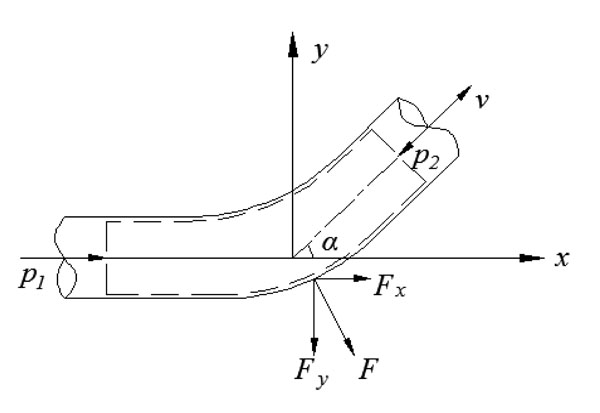
Impact force of the pig to the bend of the pipe.
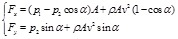 |
(1) |
where Fx and Fy are the axial and vertical impact force to the bend, N, respectively;
p1 : the pressure after the pig, Pa;
p2 : the pressure before the pig, Pa;
α : the angle between the bend and the horizontal direction, degrees;
ρ : the density of the fluid, kg/m³;
A : the pipe flow area, m2; and
V : the velocity of pig, m/s.
2.2. Soil Model of the Underground Pipe
The underground pipe is under a continuous friction constraint of the soil, especially the long straight pipe, and the primary failure is axial buckling and fatigue (flexible) damage due to the hot stress. To avoid an accident, we must consider the factors that contribute to the failure of the underground pipe [5].
Soil constraint primarily embodies in the friction of the soil, which is the instinct attribute and relates to the soil and surface roughness along the pipe. When the model is established, the continuous constraint is typically simplified as discrete on the pipeline model node point and categorized into an axial frictional constraint, horizontal soil pressure constraint and vertical direction soil constraint.
2.3. Loading Conditions
There are several loads on the pipeline during operation that should be taken into consideration. Based on the relationship between load and time, they can be categorized as permanent load, variable load or infrequent load. A permanent load does not vary with time, and any variation can be ignored compared to the average load, such as the load of the soil. A variable load varies during the expected service time of the pipe, and the variation cannot be ignored, e.g., the load of the pig during pigging. An infrequent load occurs infrequently; however, once it appears, it is large and transient.
Hoop stress refers to the direct stress or shear stress, which is caused by the gravity of the pipe, fluid flow and internal stress and conforms to the law of external forces. Expansion stress due to the heat is the direct stress or shear stress caused by the distortion of the pipe. Equivalent compound stress is the maximum stress, which is a combination of the primary stress and the secondary stress due to the stress concentration caused by the partial distortion of the structure [6].
This report is primarily concerned with the stress of the pipe bend during pigging. The compound stress is the essence of the analysis. In the finite software CAESAR II, the stress of the pipe bend can be depicted as follows: [OPE]W1+W2+T+P+F.
where W1: the gravity of the pipe;
W2: the gravity of the fluid;
P: the operation pressure;
F: the forces on the pipe bend;
T: the hot stress during operation.
2.4. Stress Analysis
According to the ASME B31.4-2012 “Pipeline Transportation System for Liquids and Slurries”, the comprehensive compound stress Seq can be calculated as follows:
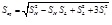 |
(2) |
The stress should conform to:
 |
(3) |
where:
Seq: Equivalent combined stress, MPa;
St: Torsional stress, MPa;
SY: Pipeline’s minimum yield strength, MPa; and
SL: Longitudinal stress, MPa.
3. CASE STUDY
According to the design parameters of the XX oil pipeline, the operational temperature is 90°, the pressure is 9 MPa, and the minimum yield strength of the pipe is 485 MPa. The parameters of the pipeline are provided in Table 1. The overall length of the pipe is 260 m, with anchor 1 and anchor 2 at the inlet and outlet, respectively, preventing any influence from the other part. The inlet pipe is 30 m long with an anchor and at a 30° angle to the west parallel pipe to minimize deviation; the west parallel pipe is 100 m long while the western inclined pipe is 100 m long with a 15° angle. The eastern parallel pipe is 30 m long with an anchor 1; the direction is indicated in Fig. (2). The radius of the curvature of the cold bend pipe can be demonstrated as R=10D, where D is the external diameter, and the speed of the pig is 2.5 m/s.
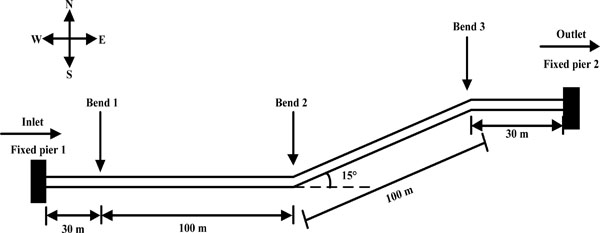
Pipeline model.
| Material | Diameter (mm) | Wall thickness of straight pipe (mm) | Wall thickness of pipe bend (mm) | Corrosion (mm) |
|---|---|---|---|---|
| API X70 | 610 | 7.9 | 7.9 | 1 |
| Fluid density (kg/m3) | Insulating layer thickness (mm) | Pressure (MPa) | Temperature (°C) | Allowable stress (MPa) |
| 900 | 60 | 9 | 90 | 485 |
Based on the relevant data provided in the design data, the parameters of the soil are provided in Table 2. We can obtain the corresponding soil density, friction coefficient and other parameters based on the soil material of the buried pipeline in a mountainous area. An over burden compaction multiplier determines the deformation of the pipe in the horizontal direction, and we can obtain the soil model compaction multiplier based on the over burden of the compaction degree in the actual pipeline construction.
Pipe stress distribution diagram in φ610x7.9.
With regards to the commonly used stress analysis software, which is based on the theory of finite elements, the pipe mechanical model is typically simplified to a shell model and a 3D beam element model. The CAESAR II software simplifies the pipes as a 3D beam element model and simplifies the forces acting on the pipeline as forces acting on the nodes, which can satisfy the analysis accuracy for the stress analysis. In this report, the pipe model and soil model are established based on the actual situation with corresponding simplified pipeline model node spacing that is not greater than 10 m, thus the model is fairly accurate and reliable.
To study the pipe diameter and the wall thickness of the pipe bending stress under pigging conditions while using a baseline pipeline model of φ610×7.9 and keeping other parameters constant, four groups of models were established, with pipe diameters and wall thicknesses of φ610×6.3, φ610×10, φ559×7.9, φ711×7.9. Then, the wall thicknesses of the four groups of models are calculated and meet the requirements of the specification.
| Friction coefficient | Soil density (kg/m3) | Buried depth to top of pipe (m) | Friction angle (°) | Yield displacement factor | Overburden compaction multiplier | Thermal expansion coefficient (m/°C) |
|---|---|---|---|---|---|---|
| 0.4 | 2400 | 1.20 | 30 | 0.015 | 5 | 11.214×10⁻⁶ |
4. RESULTS AND DISCUSSION
4.1. Results of the Stress Analysis
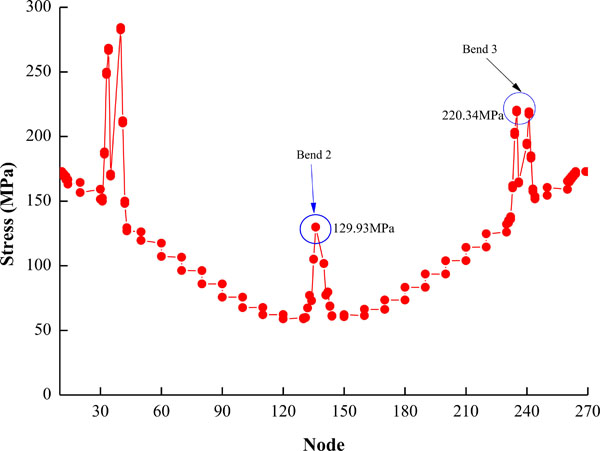
Using a pipe bend with a 15° angle as an example (the pipe from node 10 to node 50 is set to minimize the deviation and not considered in the result), as indicated in Fig. (3), for the distribution of the stress along the pipe, the stress of node 3 is maximum while bend 2 and bend 3 appear to have stress peaks of 129.86 MPa and 220.34 MPa, respectively. Generally, the stress in the pipe bend under normal operating conditions is large to a certain degree. Due to the influence of the pig under pigging conditions, the stress peak phenomenon will be more evident.
4.2. Influence of the Angle of the Pipe Bend
Then, we varied the angle of pipe bend 2 (Fig. 2) in 5° increments between 15-60° and repeated the analysis one by one (ten times in total). The model is presented in Fig. (4). The speed of the pig is 2.5 m/s. Using formula (1), the impact force to pipe bend 2 and pipe bend 3 in a different model with a different diameter is calculated, as indicated in Table 3. Known by the formula for different pigging velocities, while the velocity of the pig increases, the impact focus on the bend becomes larger. Based on the results, the impact force increases with an increase in the angle of the pipe bend in the range of 15-60°.
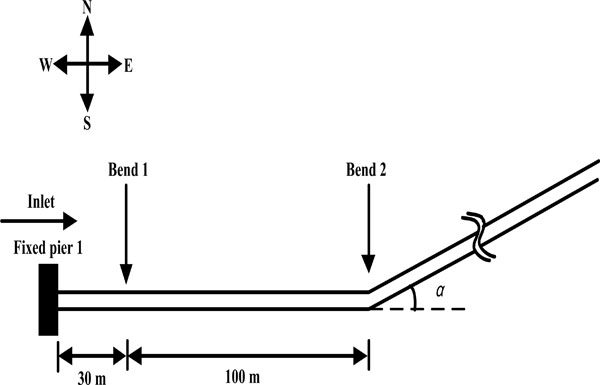
Diagram of the pipe bend.
| Bend angle° | Force | 15 | 20 | 25 | 30 | 35 | 40 | 45 | 50 | 55 | 60 |
|---|---|---|---|---|---|---|---|---|---|---|---|
| φ559 | Fx (N) | 44.57 | 78.88 | 122.54 | 175.23 | 236.53 | 305.99 | 383.08 | 467.20 | 557.44 | 653.63 |
| Fy (N) | 338.51 | 447.33 | 552.75 | 653.95 | 750.18 | 840.71 | 924.82 | 1001.92 | 1070.84 | 1132.12 | |
| φ610 | Fx (N) | 53.15 | 94.07 | 146.14 | 208.98 | 282.09 | 364.93 | 456.86 | 557.19 | 664.81 | 779.52 |
| Fy (N) | 403.71 | 533.49 | 659.21 | 779.91 | 894.67 | 1002.63 | 1102.95 | 1194.89 | 1277.09 | 1350.17 | |
| φ711 | Fx (N) | 72.23 | 127.84 | 198.60 | 284.00 | 383.36 | 495.94 | 620.87 | 757.22 | 903.48 | 1059.37 |
| Fy (N) | 548.64 | 725.01 | 895.87 | 1059.90 | 1215.86 | 1362.57 | 1498.91 | 1623.86 | 1735.57 | 1834.88 |
For example, when the pipe diameter is 610 mm and the wall thickness is 7.9 mm in the pipe model, by comparing the results from the above ten groups, the relationship between the maximum equivalent compound stress and the pipe bend with different angles can be plotted (as indicated in Fig. 5). As seen from the trend, the maximum equivalent compound stress increases with an increase in the angles in the range of 15-60°; within 15-40°, the stress increases sharply while remaining nearly constant in the range of 40-60°. It is clear that when the bend angle is small, the stress in the bend increases rapidly; however, the stress value is small, thus the influence on the pipeline remains small. When the stress in the pipe bend increases along with the bend angle to a certain extent, the rate of increase will reduce and flatten, thus the change in the bend angle on the influence of the stress value is small. According to formula (3), the minimum yield strength of the pipe material is 485 MPa, and the comprehensive compound stress is less than 436.5 MPa. As shown in the modulation of this pipe, the maximum stress peaks at 322.04 MPa, which is within the allowable stress, thus conforming to the specification of the standard.
Taking a pipeline with a pipe diameter of 610 mm as for example, the wall thickness of the pipe can be changed, and the stress for different bend angles under the corresponding pipe model can be analyzed. Thus, the relationship between the maximum equivalent compound stress and the pipe bend with different angles can be plotted (as indicated in Fig. 6). As seen from the diagram, the trend in the maximum stress and the change in the angle are similar. However, for the same pipe diameter for a reasonable range of wall thickness, the value is large and the maximum stress value is small.
Taking a pipeline with a pipe wall thickness of 7.9 mm as for example, three groups of different diameters can be modeled, and the stress for the different bend angles under the corresponding pipe model can be analyzed. Then, the relationship between the maximum equivalent compound stress and the pipe bend with different angles can be plotted (as indicated in Fig. 7). As can be seen from the diagram, the maximum stress value of a large diameter pipe bend is also large for the same wall thickness.
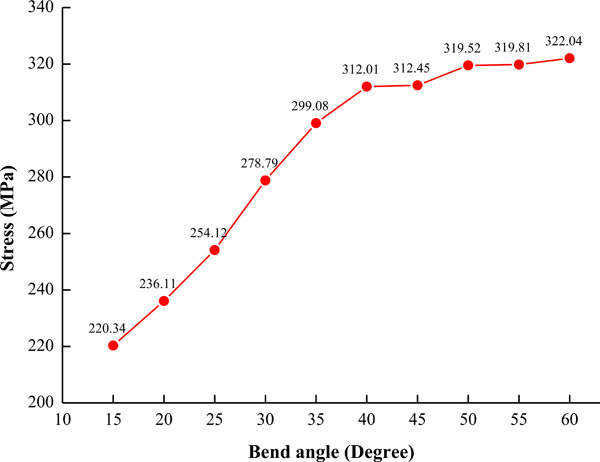
Bend angle - stress change trend chart.
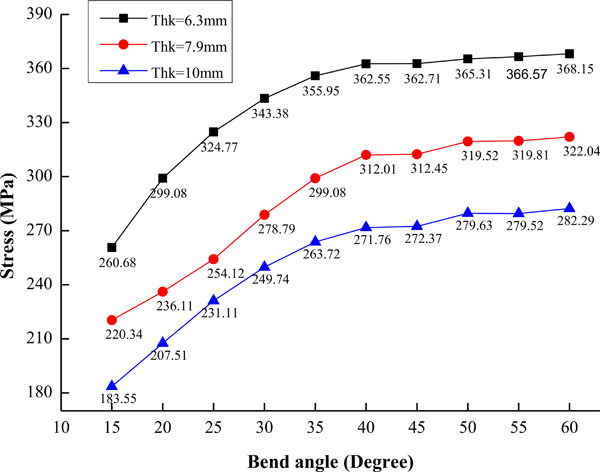
Bend angle - stress change trend chart for different wall thicknesses.
CONCLUSION
After analyzing the bend in an oil pipe in a hilly region under pigging conditions, the conclusions can be drawn as follows:
Under the pigging condition, the impact force caused by the pig is related to the angle of the pipe bend, physical properties of the medium, diameter and the velocity of the pig: the larger the angle, the larger the impact force; the larger the pipe conveying the medium density, the higher the density of the transporting medium, and the greater the impact force; the larger the pipeline diameter, the larger the impact force; and the larger the velocity of the pig, the larger the impact force.
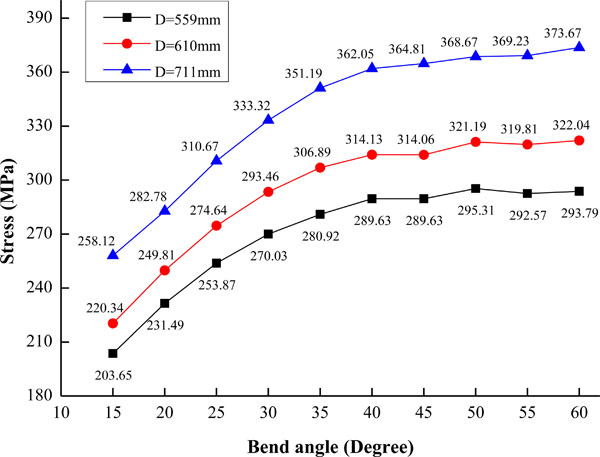
Bend angle - stress change trend chart for different wall thicknesses.
The stress in the pipe bend is relatively large under the pigging condition. The radius of the curvature and the material of the pipe bend should meet the standard of the yield strength, and performing a stress analysis is necessary.
Under the pigging condition, the stress in the pipe bend varies with the angle. When the angle is within 40°, the stress in the pipe bend increases sharply. However, when the angle is beyond 40°, the stress curve for the different angles remains nearly flat, except for high stress levels, which should be avoided. Therefore, the safe range of the pipe’s angle should be from 15-40°.
Under the pigging conditions, the stress in the pipe bend increases with an increase in the pipe diameter, thus we should pay more attention to a larger diameter pipe. Furthermore, the stress in the pipe bend decreases with an increasing wall thickness, thus selecting an appropriate wall thickness is important for the safe operation of the pipeline.
CONFLICT OF INTEREST
The authors confirm that this article content has no conflict of interest.
ACKNOWLEDGEMENTS
Declared none.

