All published articles of this journal are available on ScienceDirect.
Restoring Force Model of Concrete-Filled Square Steel Tubular Columns with Binding Bars
Abstract
This paper presents a trilinear restoring force model based on the test results of two square concrete-filled steel tubular (CFT) stub columns without binding bars and eight square CFT stub columns with binding bars subjected to constant axial load and cyclic lateral load. The effects of binding bars and axial load level on the specimens are considered to determine the feature points of the skeleton curves. Calculation formulas for the characteristic parameters of the model, including the yield load, the peak load and the ultimate load, are given by analyzing the influence of the confinement factor of steel tube, the confinement coefficient of binding bars and the axial load level. Additionally, the hysteretic rule under cyclic lateral load is confirmed. The predicted hysteretic cures and skeleton curves based on the proposed model are in good agreement with the experimental results.
1. INSTRUCTION
Concrete-filled steel tubular (CFT) columns have been used for more than 100 years in the construction of the building structures and bridges [1, 2]. The CFT columns can utilize adequately the tensile characteristics of steel tube and the compressive property of core concrete, respectively. In recent years, the mechanical behavior and the seismic performance of square CFT columns have been studied [3-8]. Additionally, the binding bars have been set to improve the mechanical behavior of square CFT columns. The static performance of square CFT columns with binding bars have been investigated and discussed in the literature [9]. Previous studies confirmed that the local buckling of steel tube can be delayed or restricted, and the core concrete can be effectively confined by both the steel tube and binding bars [10]. Thus, the ultimate strength and ductility of the square CFT columns with binding bars are highly improved. However, the seismic behavior of square CFT columns with binding bars has not yet been studied and discussed.
The restoring force, which refers to the ability to restore the deformation of the structures, is the important basis to analyze the elastic plastic analysis of CFT columns [11]. Usually, the restoring force model is proposed by experimental results or parametric analysis, and it is the relationship between the force and the displacement. Several restoring force models for square CFT columns have been proposed [12, 13]. However, the effect of binding bars has not been considered in these models.
In this paper, ten square CFT columns, including two without binding bars and eight with binding bars, were tested under constant axial load and cyclic lateral load. A simplified restoring force model, including the skeleton curve and hysteretic rule, for the square CFT columns with binding bars was proposed based on the theoretical model and experimental analysis. The effects of axial load level, confinement factor of steel tube and confinement coefficient of binding bars are considered.
2. DESCRIPTION OF THE EXPERIMENTAL INVESTIGATION
Ten square CFT columns, including 8 columns with binding bars and 2 columns without binding bars were designed and tested subjected to constant axial load and cyclic lateral load. All the specimens were made of square steel tube with the width of 200mm in cross-section and 600mm in height. The thickness of steel tube is 6mm. The diameter of binding bars is 10mm. The material properties of core concrete, steel tube and binding bars are listed in Table 1, respectively. The experimental parameters are the axial load level, the horizontal spacing of binding bars and the longitudinal spacing of binding bars. Fig. (1) shows the details of the cross section of specimens. The configurations of binding bars are given in Fig. (2). All the specimens were tested under a constant axial load and cyclic lateral load. The configuration for all specimens is shown in Fig. (2).
Parameters and experimental results of specimens.
| Specimens |
B/t/L mm |
as/bs/ds mm |
fcu MPa |
fy MPa |
fay MPa |
N kN |
n | Pme | Pmc |
Pmc/ Pme |
|---|---|---|---|---|---|---|---|---|---|---|
| kN | kN | |||||||||
| A1 | 200/6/600 | - | 50.3 | 498 | 330 | 577 | 0.2 | 336.5 | 353.9 | 1.052 |
| A2 | 200/6/600 | - | 50.3 | 498 | 330 | 1730 | 0.6 | 445.5 | 452.4 | 1.016 |
| B1 | 200/6/600 | 100/100/10 | 50.3 | 498 | 330 | 577 | 0.2 | 377 | 343.0 | 0.910 |
| B2 | 200/6/600 | 100/100/10 | 50.3 | 498 | 330 | 1153 | 0.4 | 404 | 417.1 | 1.033 |
| B3 | 200/6/600 | 100/100/10 | 50.3 | 498 | 330 | 1730 | 0.6 | 450.5 | 438.5 | 0.973 |
| B4 | 200/6/600 | 100/50/10 | 50.3 | 498 | 330 | 1153 | 0.4 | 409 | 404.3 | 0.988 |
| C1 | 200/6/600 | 50/50/10 | 50.3 | 498 | 330 | 577 | 0.2 | 365 | 379.4 | 1.040 |
| C2 | 200/6/600 | 50/50/10 | 50.3 | 498 | 330 | 1153 | 0.4 | 480.5 | 461.4 | 0.960 |
| C3 | 200/6/600 | 50/50/10 | 50.3 | 498 | 330 | 1730 | 0.6 | 480.5 | 485.0 | 1.009 |
| C4 | 200/6/600 | 50/100/10 | 50.3 | 498 | 330 | 1153 | 0.4 | 381.5 | 404.3 | 1.060 |

Details of the cross section of specimens.
The setup of specimens is also given in Fig. (2). Before testing, the bottom of the specimen was fixed to the strong floor. During testing, the constant axial load was applied to the top of the column by a hydraulic jack and maintained during the testing. Then, the cyclic lateral load was applied by two hydraulic jacks. The method of displacement control was used to apply cyclic lateral load. Three full cycles were imposed at each control deformation level and the angle of rotation of the specimen was 0.5%, 1%, 1.5%, 2%, 3.3% and 5%, respectively. The test was conducted until the lateral load resistance dropped to 85% of the peak lateral load capacity or the specimen damaged.
3. SUMMARY OF THE EXPERIMENTAL RESULTS
Fig. (3) shows the measured hysteretic curves of the specimens and Fig. (4) illustrates the skeleton curves of the specimens. The experimental results show that the square CFT stub columns have the plump hysteretic curves and the specimens with binding bars have better seismic behavior than those without binding bars. The ductility and the energy-dissipation capacity of the specimens with the binding bars are obviously improved, because setting binding bars can enhance the confinement effects on the core concrete and delay the local buckling of the steel tube. With the increase of the axial load level, the ductility of the specimen decreases. Furthermore, the ductility and the energy-dissipation capacity are obviously improved by decreasing both the horizontal and longitudinal spacing of the binding bars simultaneously. Compared with the specimens under the axial load level of 0.4, the seismic behavior can be improved by decreasing the horizontal or longitudinal spacing of the binding bar only.
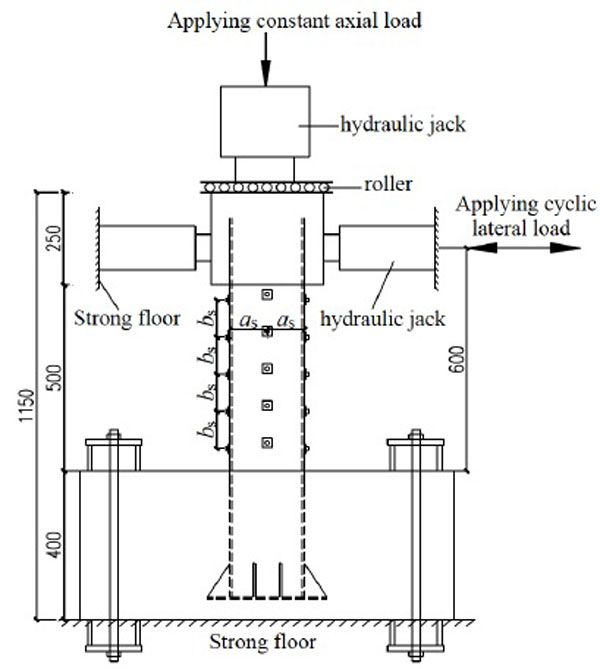
Configuration for specimens.
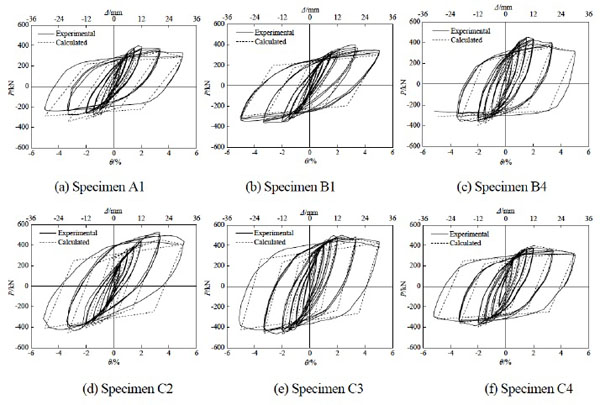
Comparison of calculated and experimental hysteretic curves of the specimens.
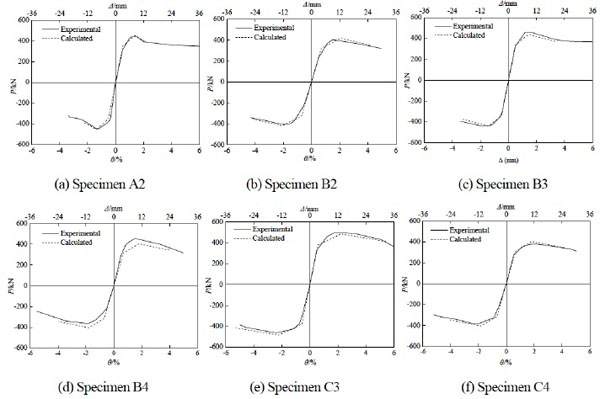
Comparison of calculated and experimental skeleton curves of the specimens.
The test results of Table 1 also showed that the peak lateral load was improved remarkably by decreasing the longitudinal spacing and the horizontal spacing of binding bars. Such as the peak lateral load of specimen C2 was 30.9% larger than that of specimen B2, and the peak lateral load of specimen C3 was 11.5% larger, 7.8% larger than that of specimen A2 and specimen B3, respectively. However, the peak lateral load increases with the increase of axial load level among the test results. For instance, the peak lateral load of specimen A2 was 12.1% larger than that of specimen A1, and the peak lateral loads of the specimen B2 and specimen B3 were 2.0% larger and 16.1% larger, than that of specimen B1 respectively. Additionally, Fig. (5) shows the local buckling of specimens A1 and B2, respectively. It can be found that for specimens without binding bars, the local buckling of the steel tube occurred at the bottom and the half wave length of local buckling wave appropriately equaled to 100 mm. And for specimens with binding bars, the local buckling occurred between the longitudinal spacing of binding bars with the half wave length of local buckling wave equaling to the longitudinal spacing.
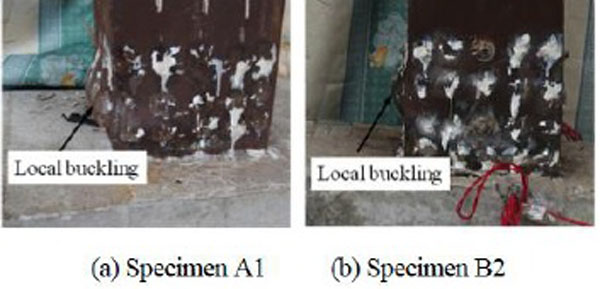
Local buckling of the specimens.
As shown in Fig. (4), the skeleton curves can be obviously divided into three stages that are defined as elastic stage, elastic-plastic stage and failure stage. Thus, the trilinear restoring force model can be better matched to describe the hysteretic behavior of square CFT columns with binding bars.
4. DETERMINATION OF SKELETON CURVE
The characteristics of restoring force model can be represented by the skeleton curve and hysteretic rule. The skeleton curve can reflect the yield, peak and failure characteristics, meanwhile the hysteretic rule represents the strength and stiffness degradation of the members under cyclic loading. In this paper, the skeleton curve can be determined by four feature points: zero point, yield load point, peak load point and ultimate load point. Namely, the following parameters should be determined: elastic stiffness K1, yield load Py, yield displacement Δy, peak load Pm, peak displacement Δm, strain hardening stiffness K2, ultimate load Pu, ultimate displacement Δu and degradation stiffness K3. Fig. (6) gives the feature points and the parameters on the skeleton curve.
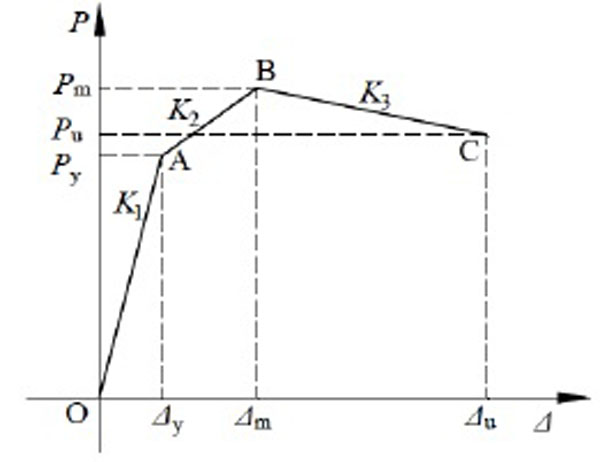
Restoring force model.
4.1. Elastic Stiffness K1
Experimental results showed that there is no obvious influence on the skeleton cures by the binding bars, so the effect of binding bars is not necessary to consider in the elastic stiffness. And the skeleton curve can be simplified as a straight line. According to the lateral stiffness of a cantilever member in structural mechanics, the elastic stiffness is given by:
 |
(1) |
where L is the length of the member; Ke is the sectional flexural stiffness. According to the experimental study, with the increase of the axial load level, the sectional flexural stiffness increase exponentially. Hence, considering the effect of steel tube and core concrete, the sectional flexural stiffness Ke can be calculated by the following equation.
 |
(2) |
where Es and Ec are the elastic modulus of steel tube and concrete respectively, and Ic and Is are the cross sectional moment of inertia of steel tube and concrete respectively; n is the axial load level.
4.2. Peak Load Pm
The peak load is the strength capacity of the member. The results show that the binding bars can improve the strength capacity of square CFT columns. Basing on the bearing capacity of rectangular CFT columns [14], the peak load Pm and the flexural bearing capacity Mu can be expressed by Eq. (3) and Eq. (4), whereas the second order effect caused by the lateral load is ignored.
 |
(3) |
 |
(4) |
 |
(5) |
 |
(6) |
 |
(7) |
where ξ is the confinement coefficient of steel tube; ξ is the confinement coefficient of binding bars; B is the width of square steel tube; t is the wall thickness of steel tube; as and bs are the horizontal and longitudinal spacing between binding bars respectively; fy and fay are the yield strength of binding bars and steel tube respectively; fck is the characteristic strength of core concrete, defined as 0.76fcu, and fcu is the cubic compressive strength of core concrete; Aa and Ac are the area of steel tube and core concrete on the cross section respectively; As is the area of binding bar.
4.3. Yield Load Py
It is difficult to consider many parameters to determine the yield load. However, the average value of the ratio between the yield load and peak load is about 0.78 for all specimens. Thus, the yield load can be approximately calculated by the following formula:
 |
(8) |
4.4. Yield Displacement Δy
The yield displacement is the displacement corresponding to the yield load. The member is assumed to be elastic before reaching the yield load. Hence, as shown in Fig. (6), the yield displacement is given by:
 |
(9) |
4.5. Peak Displacement Δm
The relative displacement corresponding to the peak load is the peak displacement. In the analysis of the test results, the peak displacement, which can be calculated by the yield displacement, considers the influence of the axial load level and the confinement coefficient of binding bars. The regression equation for the peak displacement is given by:
 |
(10) |
4.6. Strain Hardening Stiffness K2
The strain hardeding stiffness K2 is the stiffness between the yield load point and peak load point. Thus, as illustrated in Fig. (6), the strain hardening stiffness K2 can be calculated by the yield load point and the peak load point and expressed as follow:
 |
(11) |
4.7. Ultimate Load Pu
It is assumed that the member would fail when the load drops to 85% of the peak load at the descending stage. Thus, the ultimate load is expressed as:
 |
(12) |
4.8. Ultimate Displacement Δu
The ultimate displacement is the displacement corresponding to the ultimate load. As illustrated in Fig. (5), the ultimate displacement can be obtained by the peak load point and the ultimate load point. The calculation formula of the ultimate displacement is expressed as follow.
 |
(13) |
4.9. Degradation Stiffness K3
The degradation stiffness K3 is the stiffness between peak load point and ultimate load point. The test results show that with the decreasing of the axial load or the spacing of binding bars, the descending stage of skeleton curve becomes smooth. Namely, the degradation stiffness of the member decreases. It is found that the ratio of degradation stiffness to elastic stiffness is influenced by the axial load level and confinement coefficient of binding bars. Through the regression analysis, the degradation stiffness can be given by:
 |
(14) |
4.10. Comparison of Skeleton Curves Between Calculated and Experimental Results
Fig. (4) gives the comparison of skeleton curves between the calculated and experimental results and Table 2 shows the comparison of the calculated and experimental results of the specimens for feature points. The average value of peak load is shown in Table 1. It can be found that the calculated results are in good agreement with the experimental skeleton curves. The mean value and covariance of Pmc/Pme are given as 1.004 and 0.069, respectively.
Comparison of the calculated and experimental results of specimens for feature points.
| Specimens |
Pye kN |
Pyc kN |
Pyc/ Pye |
Δye mm |
Δyc mm |
Δyc/ Δye |
Δme mm |
Δmc mm |
Δmc/ Δme |
Δue mm |
Δuc mm |
Δuc/ Δue |
|---|---|---|---|---|---|---|---|---|---|---|---|---|
| A1 | 264.7 | 276.0 | 1.043 | 4.35 | 4.80 | 1.103 | 15.28 | 17.72 | 1.160 | 28.61 | 27.81 | 0.972 |
| A2 | 367.3 | 352.9 | 0.961 | 2.84 | 3.14 | 1.104 | 8.10 | 8.30 | 1.025 | 15.19 | 13.74 | 0.904 |
| B1 | 287.7 | 267.5 | 0.930 | 5.12 | 4.65 | 0.909 | 18.50 | 17.82 | 0.963 | 33.98 | 31.39 | 0.924 |
| B2 | 314.6 | 325.3 | 1.034 | 4.42 | 4.25 | 0.962 | 9.64 | 12.48 | 1.295 | 25.07 | 24.86 | 0.992 |
| B3 | 361.4 | 342.0 | 0.946 | 3.40 | 3.04 | 0.895 | 10.16 | 8.48 | 0.835 | 20.25 | 19.95 | 0.985 |
| B4 | 321.5 | 315.4 | 0.981 | 3.91 | 4.12 | 1.053 | 10.03 | 10.82 | 1.079 | 23.10 | 23.82 | 1.031 |
| C1 | 244.0 | 295.9 | 1.213 | 5.63 | 5.15 | 0.915 | 28.77 | 27.08 | 0.941 | 42.48 | 37.23 | 0.876 |
| C2 | 380.6 | 359.9 | 0.946 | 5.40 | 4.71 | 0.872 | 18.26 | 21.07 | 1.154 | 31.71 | 32.81 | 1.035 |
| C3 | 380.6 | 378.3 | 0.994 | 3.84 | 3.36 | 0.875 | 14.17 | 13.26 | 0.936 | 30.09 | 32.41 | 1.077 |
| C4 | 313.4 | 315.4 | 1.006 | 3.98 | 4.12 | 1.037 | 12.39 | 10.99 | 0.887 | 27.31 | 24.94 | 0.913 |
| Mean | 1.005 | 0.972 | 1.028 | 0.971 | ||||||||
| Covariance | 0.078 | 0.088 | 0.136 | 0.062 |
5. RESTORING FORCE MODEL
A degrading trilinear restoring force model is put forward for the square CFT columns with binding bars as shown in Fig. (7). The restoring force model includes the skeleton curve and the stiffness degeneration. The skeleton curve has been discussed above, and then the stiffness degeneration and hysteretic rule would be studied.
5.1. Unloading Stiffness K4
It is important to note that the hysteretic rule of the stiffness is mainly related to the unloading stiffness. The unloading stiffness can be determined by the elastic stiffness. With the increase of the displacement, the degradation of unloading stiffness becomes small. Additionally, the high axial load level is not beneficial to the unloading stiffness. Based on the regression analysis, the equation of unloading stiffness, considering the confinement coefficient of binding bars, is obtained as below.
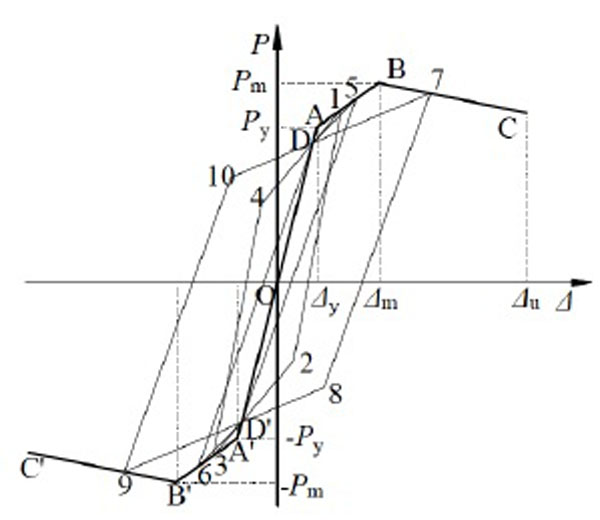
Restoring force model.
 |
(15) |
5.2. Hysteretic Rule
The hysteretic rule is needed to describe the hysteretic behavior of square CFT columns with binding bars. Considering the skeleton curve and the unloading stiffness, a simple symmetric trilinear restoring force model is described to model the hysteretic behavior of square CFT columns with binding bars. The feature point parameters of the restoring force model can be obtained from the skeleton curve. It should be noted that the hysteretic cures for the reloading pass the fixed point on the skeleton curves and the ordinate of fixed point, which is the intersection point, is about 0.7Pm. As shown in Fig. (7), the detail of the typical hysteretic rule for the restoring force model is described as follows.
- In the elastic stage (O-A and O-A’), the lateral load is less than the yield load. The stiffness degradation and residual displacement are ignored. Thus, the loading stiffness and reloading stiffness are equal to the elastic stiffness.
- In the elastic-plastic stage (A-B and A’-B’), the lateral load is between the yield load and the peak load. The stiffness degradation and residual displacement are considered. As presented in Fig. (7), the unloading stiffness is adopted from point 1 to point 2. Then, the hysteretic cure is aimed at point 3 through the fixed point D’. However, if the unloading stiffness is too small, the cure may not pass through the fixed point D’, and this is not accord with the experimental results. It is assumed that in this case, the unloading path of the hysteretic curve is aimed at point D’ directly from point 5. Then, the point 6, which is symmetry with point 5, would be reached. The loading and unloading rules of negative direction are the same with that of positive direction.
- In the failure stage (B-C and B’-C’), the lateral load is between the peak load and the ultimate load. The stiffness degradation and residual displacement are also considered in the failure stage. From the point 7, the unloading path of the hysteretic curve is aimed at point D’ through the softening point 8. Then, the point 9, which is symmetry with point 7, is been reached.
5.3. Comparison of Calculated and Test Hysteretic Curves
Fig. (3) shows the calculated and experimental hysteretic curves of the specimens. It can be seen that the calculated results are in good agreement with the experimental results. Additionally, the loading and unloading stiffness calculated by the restoring force model are also shown satisfactory agreement. Thus, the restoring force model proposed in this paper can predict the hysteretic behavior reasonably for the square CFT columns with binding bars.
However, it is very important to note that the inflection point of the column should be determined when the suggested restoring force model is used since it is based on the cantilever column. So for the bottom columns the inflection points are assumed to be at about 2/3 storey height above the basis, while the inflection points are assumed to be at mid-section of the columns for other storey. In addition, the specimens adopted in this study are the square CFT columns with or without binding bars. Namely, the proposed model applies mainly to such typical columns in the engineering application. Further research can be taken to study the restoring force model of other sectional columns with binding bars.
CONCLUSION
Based on the theoretical analysis and the analysis of experimental hysteretic behavior of square CFT columns with binding bars, a trilinear restoring force model is proposed. The skeleton curve is described by the yield load point, peak load point and ultimate load point. And the feature parameters are determined by the theory and regression analysis. Then, hysteretic rules are given to describe the loading and unloading rule for the cyclic load. The skeleton curves and hysteretic curves calculated by the proposed model match quite well with the experimental ones.
CONFLICT OF INTEREST
The authors confirm that this article content has no conflict of interest.
ACKNOWLEDGEMENTS
This research was supported by the National Natural Science Foundation of China (Grant No. 51008085), Guangzhou Pearl River New Star of Science & Technology Project (Grant No. 2012J2200100) and State Key Lab of Subtropical Building Science, South China University of Technology (Grant No. 2013ZC14,No. 2013ZC19). The support is greatly appreciated.


