All published articles of this journal are available on ScienceDirect.
Construction System Reliability Analysis Based on Improved Firefly Algorithm
Abstract
To solve the problems of multi-objective control, objective quantification difficulties and computational complexity existing in the construction management, the construction system reliability was introduced into the project management. The process of construction project was divided into several units of work based on system decomposition theory. And the reliability of each unit of work was calculated. Then, the system reliability was optimized by the improved firefly algorithm. To avoid that the basic algorithm is highly depended on the initial solution and easy to fall into local optimum at later stage, the dynamic population firefly algorithm was proposed. Engineering practice shows that the improved algorithm has higher convergence speed and accuracy of optimization. The study provides a novel method for effective construction management.
1. INTRODUCTION
With the development of the construction project, more and more uncertain factors appeared, the project management becomes more and more complicated, and the traditional methods of construction project management were difficult to adapt to the new situation. Therefore, it has become an urgent question to ensure the effective control of large construction projects, measure the demand among the various objectives of the project comprehensively, and improve the reliability of the whole construction system [1, 2].
Construction system reliability is the ability to complete the expected project quality safely and effectively, within the limited time and limited budget funds, through the project construction production process. At present, the study of theory and application of construction reliability has just started, but some of the related works have been concerned by more and more construction management staffs [3]. For example, A. Afshar et al. described multi-objective optimization of time-cost-quality using multi-colony ant algorithm [4]. S. AbouRizk et al. set up the model and finished the simulation for improving construction engineering operations [5]. S. Lee et al. took a predictive tool for estimating accident risk in construction project [6]. A. Jafari et al. investigates the internal and external factors contributing to the successful implementation of quality costs construction programmers [7]. H.M.E. Abdelsalam et al. used the prevention–appraisal–failure (PAF) model to evaluate the cost of quality (CoQ) and to determine its optimum value – the level of quality that minimizes the total CoQ – for the residential construction projects in Dubai [8]. M.H.A. Samiaah et al. study contractors' perception of costs of quality system building construction projects based on Chi-Squared test and Relative Importance Index techniques [9]. These studies promote the development of the construction reliability study, but we have a long way to go to overcome the numerous control objectives, difficulties in target quantification, reliability computational complexity and other problems existed in construction reliability analysis. For this reason, firefly algorithm was introduced into optimization process of reliability to improve the speed and accuracy.
Firefly Algorithm (FA) is a novel evolutionary algorithm proposed by Cambridge scholar Yang Xinshe in 2009
[10]. This algorithm is developed from simulating luminescence phenomenon of wild firefly individuals in nature, by foraging, finding mates and alerting. It is a random nonlinear search optimization algorithm based on smart groups. Because it has advantages of simple operation, strong robustness and easy to parallel processing, it was widely used in many fields, such as pattern recognition, network route selection, automatic control, portfolio optimization, robot path planning and social science [11-13]. Here, firefly algorithm was applied to construction system reliability analysis to provide a new optimization method. At the same time, because the basic algorithm is highly depended on the initial solution and easy to fall into local optimum at later stage, the characteristics of chaos and dynamic population were employed to improve the initial solution and the scope of search.
Applying improved firefly algorithm to construction system reliability analysis is a new attempt for reliability analysis, which solves the problems of multi-objectives control and computational complexity. It helps construction enterprises achieve the dynamic integrated management of each target and element of the projects. It can improve the management efficiency and practical feasibility of the project. At the same time, the study also expands the applications of swarm intelligence algorithms and system reliability theory.
2. SYSTEM RELIABILITY OF CONSTRUCTION
The system reliability of construction mainly analyzes the relationship between the various elements, and deals with all the elements involved integrally and systematically. It aims to reflect the relationship between every element in the whole construction process, to ensure the whole system is in the best condition [14].
Because the construction process involves numerous factors and is full of inevitable hierarchy and uncertainty [15], the construction reliability analysis should be carried out under four aims: quality, cost, schedule and safety. Each part of the construction process should be considered comprehensively. Calculation model of construction system reliability should be built. Here, the main work was divided into the following two parts:
1) The system decomposition was introduced. The construction system was divided into several units of work, and every work unit has different schedule, cost, quality and safety objectives.
Reliability of construction project is reflected in each construction process of construction, and it is influenced by the personnel, materials, machinery and equipment, construction technology and construction environment. The hierarchical relationship between these factors and the construction system reliability was shown in Fig. (1).
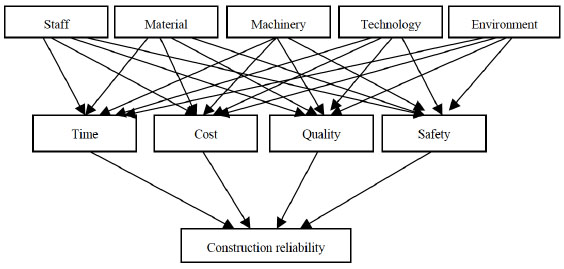
Hierarchical relationship between construction reliability, production elements and construction goals.
2) Based on probability theory and mathematical statistics, Monte Carlo simulation and fault tree analysis method [16] were employed. Various factors of construction process were taken into consideration synthetically, construction reliability of each unit of work was measured, and model was built.
The objective function:
 |
(1) |
where:
CP –critical path of network;
T – total construction period;
ti – work time of the ith unit of work on the critical path;
C – the total cost;
ci – the cost of the ith unit of work;
RQ – quality reliability;
qi – quality reliability of the ith unit of work on the critical path;
Rs – safety reliability;
Si – safety reliability of the ith unit of work on the critical path.
 |
(2) |
where:
T' – expected total construction period;
C' – expected total cost;
RT' – lowest construction period reliability;
RC' – lowest cost reliability;
RQ' – lowest quality reliability;
RS' – lowest safety reliability.
To optimize this model, the improved firefly algorithm was introduced.
3. IMPROVED FIREFLY ALGORITHM
3.1. Basic Firefly Algorithm
The reasons of attracting each other among fireflies depend on two factors: their own brightness and attractiveness. The brightness of fireflies depends on the target of their location. The higher brightness indicates better location, which means the better target. Attractiveness is related to brightness. The brighter fireflies own higher attractiveness which can attract fireflies with weaker brightness to move in this direction within the scope of sight. If the brightness is identical, fireflies will move randomly. Brightness and attractiveness are inversely proportional to the distance between fireflies, both decrease with increasing distance. Mathematical description of the algorithm is as follows [17]:
Definition 1: The firefly relative fluorescence brightness is:
 |
(3) |
where: I0– firefly maximum fluorescence brightness, the higher brightness indicates better location, which means the better target, more easy to attract other fireflies move to himself. γ– absorption coefficient of light intensity. It is usually set to be a constant, and represent a change of the fluorescence intensity in the communication process. rij– spatial distance between firefly i and j, It is determined by the initial position of fireflies, the greater the distance, the lower the attraction between fireflies.
Definition 2: The firefly's attractiveness is:
 |
(4) |
where: β0– the maximum attractiveness, which is the attractiveness of light source. Fireflies were attracted by the one which has a better attractiveness, and other fireflies will move to it. β(r)- the attractiveness after moving.
Definition 3: The location update. Where the firefly i attracted by the firefly j moves is determined by the following equation:
 |
(5) |
where: xi,xj – the spatial location of firefly; α – step factor, which is usually a constant between [0, 1]; rand– random factor, which is uniformly distributed between 0 and 1.
3.2. Improved Dynamic Population Firefly Algorithm
Firefly algorithm has advantages and potential in searching for the global optimal solution and solving NP-hard problem, but the basic algorithm has defects, which are highly depended on the distribution of the initial solution, easy to stagnation in early stage, low solution accuracy, and slow convergence in late stage [18, 19].
In order to avoid stagnation existing in FA, reduce the possibility of falling into local optima in the initialization, cube mapping equation (6) was applied to produce the m individual fireflies. Then the equation (7) was applied to obtain the projection of the locations of m fireflies.
 |
(6) |
 |
(7) |
where: NP – upper limits of the search space; NP – lower limits of the search space; NP – dth dimension of the ith firefly produced by equation (6); NP – coordinate of the ith firefly on the dth dimension of the search space.
On this basis, dynamic population firefly algorithm was introduced. Firstly, set a threshold value MaxT, and then global search was done. When iterations reach MaxT, the equation (8) was used to get ps new individuals. In order to maintain the diversity of population, and strengthen the scope of the search, the original populations of ps individuals were replaced by some new generation individuals with a random way.
 |
(8) |
where: yi,j – the location of the new generation of firefly individual i; ps– the number of new individuals generated; dim – dimension.
The equation (8) shows that the new firefly individuals scattered around the global optimum position. It can effectively increase the traction of the original population, greatly improve the convergence rate and make more opportunities for the algorithm to search more accurate solution. Finally, Gaussian disturbance was employed on the current optimal solutions of each generation generated based on equation (9), and a new global optimal solution was obtained by using equation (10).
 |
(9) |
where: NGbest – position after disturbance; Gbest*– position before disturbance
 |
(10) |
The framework of the algorithm was shown in Fig. (2).
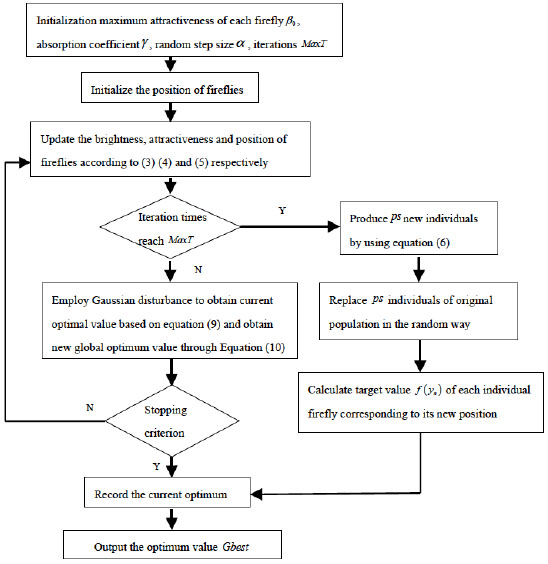
Framework of the improved algorithm.
3.3. Performance Analysis of Algorithms
TSP problem (Travelling Salesman Problem) is one of the famous combinatorial optimization problems with NP-hard. In order to verify the performance of the improved algorithm, three typical TSP problem (Berlin52, Pr107, D1198) were selected. Improved firefly algorithms and several typical basic algorithms (basic ACO, basic PSO, basic FA) were compared. The basic sparameters of our improved algorithm: Population size is 200 and the maximum evolution algebra is 600. The results were shown in Table 1.
As shown in Table 1, the basic ACO and basic PSO have slow convergence and low accuracy, and are easy to fall into local optima. The basic firefly algorithm is more successful, and it overcomes the premature defects to some extent, although there are some errors between the calculation results and the optimal value. The improved algorithm is better in local optimization, avoids the local stagnation effectively. The convergence rate and the number of iterations are better than basic firefly algorithm. The Fig. (3) shows four algorithms iterations and curve optimal value for D1998 test function.
Comparison of four methods of calculation results.
| TSP | Basic ACO [20] | Basic PSO [20] | Basic FA | Improved FA | ||||
|---|---|---|---|---|---|---|---|---|
| Convergence algebra | Shortest path |
Convergence algebra | Shortest path |
Convergence algebra | Shortest path |
Convergence algebra | Shortest path |
|
| Berlin52 | 510 | 7712 | 460 | 7558 | 290 | 7542 | 252 | 7537 |
| Pr107 | 550 | 44686 | 405 | 44385 | 330 | 44283 | 308 | 44262 |
| D1198 | 590 | 16313 | 520 | 16197 | 440 | 15796 | 550 | 15790 |
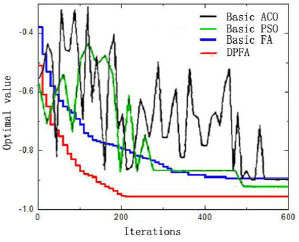
Four algorithms iterations and curve optimal value.
4. APPLICATION OF IMPROVED FIREFLY ALGORITHM ON CONSTRUCTION SYSTEM RELIABILITY
4.1. Optimization Process
According to the ultimate aims of construction system reliability, which are shortest duration and the lowest cost, best quality and best safety performance, the objective function was established, as shown in equation (1). Constraints were set to meet the goals of the project, which are minimum duration, minimum costs, minimum schedule reliability, minimum cost reliability, minimum quality reliability and minimum safety reliability, as shown in equation (2). Calculation model of construction system reliability was established. Dynamic firefly algorithm was applied to optimize the function. Specific steps were shown as follows.
Step 1: Initialize the firefly size N, the number of firefly m, maximum attractiveness β0 of each firefly, absorption coefficient γ, random step size α and the iterations MaxT.
Step 2: Initialize the position of fireflies: select the optimum firefly as an initial individual in feasible space.
Step 3: Update the brightness, attractiveness and position of fireflies according to equations (3), (4) and (5) respectively.
Step 4: If the number of iterations is equal to MaxT, then,
Apply equation (6) to produce ps new individuals.
Replace ps individuals of original population by the new individuals in the random way.
For each replaced individual firefly, calculate the target value f(ti, ti,ci,qi,si) corresponding to its new position.
Record the current optimum, go to step 7.
Step 5: Employ Gaussian disturbance to obtain current optimal value based on equation (9) and obtain new global optimum value through equation (10).
Step 6: If the algorithm stopping criterion is satisfied, then stop. Otherwise, go to step 3.
Step 7: Output the optimum value Gbest.
4.2. Engineering Examples
A sub-project of a large construction project in Handan City, Hebei Province, China was selected as an example, and its construction reliability was analysed. The sub-project is a residential building of thirty-two-story frame shear wall structure. Construction area is 30240 square meters, the completion period stipulated is 428 days, and the estimated total project cost is 42088622 yuan. The network plan was divided into thirteen partitioned projects and each partitioned project of engineering was regarded as unit of work. The construction reliability relationship is shown in Fig. (4).
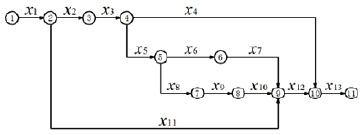
Construction reliability relationship.
The raw data were shown in Table 2.
List of raw data.
| Symbols | Unit of work name | Quantities | Duration (days) | Unit direct costs (yuan) | |||||
|---|---|---|---|---|---|---|---|---|---|
| Unit | Quantity | a | m | b | a | m | b | ||
| x1 | Earthworks | m3 | 57110 | 15 | 24 | 29 | 36 | 40 | 45 |
| x2 | Foundation engineering | m3 | 3760 | 28 | 36 | 39 | 909 | 1010 | 1080 |
| x3 | Main structure | m3 | 4330 | 70 | 72 | 76 | 1098 | 1220 | 1280 |
| x4 | Roofing project | m2 | 9460 | 20 | 32 | 39 | 86 | 95 | 107 |
| x5 | Masonry works | m3 | 4600 | 30 | 34 | 41 | 303 | 337 | 375 |
| x6 | Wall decoration | m2 | 39810 | 25 | 32 | 37 | 47 | 52 | 60 |
| x7 | Apron and stairs | m2 | 860 | 10 | 15 | 19 | 36 | 40 | 45 |
| x8 | Interior plaster | m2 | 30400 | 35 | 41 | 42 | 13 | 14 | 15 |
| x9 | Ground floor | m2 | 38860 | 31 | 35 | 38 | 95 | 105 | 118 |
| x10 | Doors and windows installation | m2 | 7430 | 15 | 19 | 23 | 441 | 490 | 520 |
| x11 | Scaffolding dismantling | m2 | 54980 | 214 | 230 | 255 | 14 | 15 | 18 |
| x12 | Paint and coatings | m2 | 91160 | 38 | 41 | 44 | 23 | 25 | 28 |
| x13 | Completion and acceptance | Item | 1 | 4 | 4 | 6 | 4300 | 4500 | 4800 |
4.3. Determination of Construction System Reliability
Here, four aspects of unit of work, which are work time, cost, quality and safety, were taken into consideration. Based on the data shown in Table 2, Monte Carlo simulation and Fault Tree method were used to acquire probability distribution histogram of the total duration of the completed project (Fig. 5), probability distribution histogram of the total cost of the completed project (Fig. 6), quality reliability and safety reliability (Table 3), and cost - time, quality - time, safety - time relationship model (Table 4).
Through the statistics, the probability density function of the total duration approximately obeys normal distribution N (413.79,11.4422). The duration reliability of 428 days (the completion period stipulated) is RT =0.8365.
And the probability density function of the total cost approximately obeys normal distribution N (415.32,13.9522). The cost reliability of 42088622 yuan (the estimated total project cost) in 428 days is RT =0.7357.
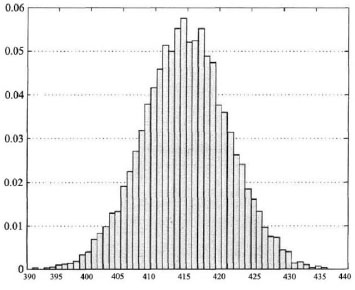
Probability distribution of the total duration of the completed project.
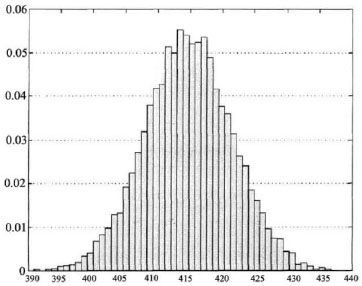
Probability distribution of the total cost of the completed project.
Quality reliability and safety reliability of each unit of work.
| Unit of work | Quality reliability | Safety reliability | Unit of work | Quality reliability | Safety reliability |
|---|---|---|---|---|---|
| x1 | 0.8745 | 0.8523 | x8 | 0.8216 | 0.9875 |
| x2 | 0.9168 | 0.8475 | x9 | 0.8923 | 0.9589 |
| x3 | 0.8346 | 0.7990 | x10 | 0.9243 | 0.9213 |
| x4 | 0.8659 | 0.9016 | x11 | 0.9658 | 0.8546 |
| x5 | 0.9923 | 0.9987 | x12 | 0.8970 | 0.9825 |
| x6 | 0.8523 | 0.8316 | x13 | 0.9558 | 0.9986 |
| x7 | 0.9217 | 0.8976 |
Relationship of cost - time, quality - time, and safety – time.
| Unit of work | Cost - time relationship | Quality - time relationship | Safety - time relationship |
|---|---|---|---|
| x1 | c1 = 108400 + 2710(12 - ti)+1500ti | q1 = 0.87 + 0.026(ti - 7) | s1 = 0.85 + 0.03(ti - 7) |
| x2 | c2 = 177760 + 3080(18 - ti)+1500ti | q2 = 0.92 + 0.02(ti - 14) | s2 = 0.88 + 0.03(ti - 7) |
| x3 | c3 = 406260 + 3330(36 - ti)+1500ti | q3 = 0.83 + 0.0283(ti - 30) | s3 = 0.95 + 0.0083(ti - 30) |
| x4 | c4 = 70870 + 2238(16 - ti)+1500ti | q4 = 0.87 + 0.0325(ti - 12) | s4 = 0.90 + 0.0025(ti - 12) |
| x5 | c5 = 155020 + 2913(21 - ti)+1500ti | q5 = 0.95 + 0.0083(ti - 15) | s5 = 0.95 + 0.0083(ti - 15) |
| x6 | c6 = 103012 + 2264(22 - ti)+1500ti | q6 = 0.85 + 0.0214(ti - 15) | s6 = 0.85 + 0.0214(ti - 15) |
| x7 | c7 = 3440 + 143(10 - ti)+1500ti | q7 = 0.92 + 0.0267(ti - 7) | s7 = 0.91 + 0.03(ti - 7) |
| x8 | c8 = 42560 + 1010(24 - ti)+1500ti | q8 = 0.82 + 0.06(ti - 21) | s8 = 0.92 + 0.0267(ti - 21) |
| x9 | c9 = 191730 + 3391(35 - ti)+1500ti | q9 = 0.89 + 0.0157(ti - 28) | s9 = 0.89 + 0.0157(ti - 28) |
| x10 | c10 = 317520 + 277(16 - ti)+1500ti | q10 = 0.92 + 0.0114(ti - 9) | s10 = 0.92 + 0.0114(ti - 9) |
| x11 | c11 = 39984 + 384(140 - ti)+1500ti | q11 = 0.97 + 0.002(ti - 127) | s11 = 0.85 + 0.0012(ti - 127) |
| x12 | c12 = 52900 + 2116(16 - ti)+1500ti | q12 = 0.90 + 0.0333(ti - 13) | s12 = 0.88 + 0.04(ti - 13) |
| x13 | c13 = 4500 + 1500ti | q13 = 1 | s13 = 1 |
4.4. Multi-Objective Collaborative Optimization Model Under Construction Reliability Constraints
The objective function:
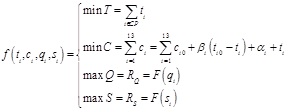 |
(11) |
where: CP– key line of the network. αi – unified taken 2100yuan / day.
 |
(12) |
The improved Firefly algorithm was used to optimize the model. And the parameters are: the size of population N = 500, maximum evolution algebra MaxT = 1000, crossover probability pc = 0.55, mutation probability pm = 0.03. MATLAB Programming was used to get the optimal solution after 200 cycles. Each optimal solution represents a decision combination of time, cost, quality and safety of the 13 units of work. Optimal results obtained are shown in Table 5.
Samples of optimal results.
| Time | 379 | Quality reliability | 0.91 |
|---|---|---|---|
| Cost | 3906597 | Safety reliability | 0.92 |
| Time reliability | 0.89 | Construction reliability | 0.88 |
| Cost reliability | 0.84 |
From the above data, we can know that the reliability of each subsystem is in a "qualified" status, the construction period and costs are below expectations. Thus, construction feasibility of the project is verified.
CONCLUSION
In order to solve the problems of multi-objective control, objective quantification difficulties and computational complexity existing in the construction management. The process of construction project was divided into several units of work based on system decomposition theory, and the reliability of each unit of work was calculated. Then, the characteristics of chaos and dynamic population were employed to improve the initial solution and the scope of search, and employed the improved firefly algorithm to obtain construction system reliability. Engineering practice shows that the improved algorithm has higher convergence speed and accuracy of optimization. Thus, we can draw the following conclusions:
- (1) The reliability relationship between each unit of work in project construction system are analyzed, specifically, the construction project network diagram is build and the construction system reliability analysis of network graph model is established. It completed the multi-objective collaborative optimization.
- (2) Firefly algorithm is introduced and improved for its weakness. What’s more, engineering practice shows that the improved firefly algorithm has higher convergence speed and accuracy of optimization.
- (3) The study provides a new way for effective construction management, and it has an important theory and practical significance to improve construction management, at the same time, it also expand the application area of firefly algorithm.
CONFLICT OF INTEREST
The authors confirm that this article content has no conflict of interest.
ACKNOWLEDGEMENTs
The work was supported by the Natural Science Foundation of Hebei Province, China (NO. E2012402030) and the Program of Selection and Cultivating of Disciplinary Talents of Colleges and Universities in Hebei Province (BR2-206)


