All published articles of this journal are available on ScienceDirect.

Evaluation of Soil Liquefaction in Harbor District in Tianjin City
Abstract
The liquefaction of soils in the harbor district in Tianjin City near Tangshan, where a great earthquake occurred is a very important issue related to the soil’s compaction, grain composition and content of clay particle. This problem has not been fully considered due to the complexity and uncertainty of the soil properties data, since none of the previous investigations has been concerned about the liquefaction characteristics of this new harbor district. The evaluation of soil liquefaction has been made based on related data of the standard penetration test (SPT) from 26 investigation bore holes and 105 sieving tests. The results show that the liquefaction index of silt sand gradually decreases with the increase of the buried depth; soils less than 10.6 m in depth are of bad gradation identically. Soil less than 10.6 m in depth can be defined as liquefied soil which is further verified by sieving tests. Both the buried depth and particle grading have primarily significant influences on silt sands’ liquefaction. The results from sieve tests based on liquefied soils were found to fit well with the Tsuchida curves. It is believed that even without the in-suit SPT tests, Tsuchida boundary curves can be directly utilized to judge the liquefaction of soils in the harbor district.
INTRODUCTION
Soil liquefaction is one of the most common issues that cause foundation failure for loose or moderately dense sand or granular soils. When liquefaction occurs, the soil strata will change from solids to liquefied state. It will soon soften the soil and result in soils’ strength loss and large deformation such as ground settlement or cracks. Marcuson [1] defined that theliquefaction is the transformation of granular materials from solids to liquefied state due to the increased pore-water pressure and reduced effective stress. Many researchers have studied the soil liquefaction and found that it is primarily due to the cyclic shear deformations caused by vibration for instance, earthquakes. Particles in loose or moderately dense sands tend to compact when the soil vibrates. However, the pore-water pressure will inevitably increase due to the difficulty of draining away water. Thus, the existence of excess pore water pressure will result in a proportional reduction of the effective stress which principally determines the soil strength and stability. The foundation or slope will fail once the excess pore water pressure is high enough. And loose soil particles will be compacted and reconsolidated during liquefaction, resulting in ground settlement. Typically, the soil softening will be accompanied with shear strength loss that may lead to shear deformation resulting in flow failure beneath foundations or slope [2]. It is believed that liquefaction will result in ground oscillation or lateral spread due to flow deformation or cyclic mobility beneath sloping or flat ground [3]. All the previous researches have shown that earthquake causing strong vibration is one of the main reasons leading to cyclic shear deformations and liquefaction of loose or moderately dense soils. Much attention should to be paid to the soil liquefaction especially in seismic region since it will cause enormous disaster and great loss
In 1976, the great earthquake in Tangshan occurred due to which a large number of foundation failed, causing serious damage to constructions in just a few minutes. The related research on this disaster found that it was the liquefied soil caused by the strong vibration of the earthquake that resulted in the failure of foundation. Many researches and practices have shown that for sandy soil foundation, sand liquefaction was the key reason causing foundation failure. Possibility and perniciousness of liquefaction must be evaluated before foundation treatment. In Tianjin city, near Tangshan, where a great earthquake occurred, the problem of sand liquefaction should be paid more attention since it will lead to a great deal of construction failure once an earthquake takes place. The research on the liquefaction of soils in the harbor district in Tianjin, where many constructions are going on, is helpful to figure out the regional soil liquefaction issues. With a better understanding of the liquefaction rules, effective and economic methods can be proposed to settle the troubles of liquefaction, improve the soil strength, and reduce the structural destruction of foundations caused by earthquake.
However, from a literature survey, none of the previous investigations has been concerned about the regional liquefaction characteristic of soils in this harbor district of Tianjin. Since many momentous engineering projects will be constructed here, it is indispensable and urgent to figure out the typical regional liquefaction law of this harbor district, and contribute to the design of the foundation treatment.
In this paper, a comparison of evaluation methods for sand liquefaction has been made based on related data of the standard penetration test (SPT) form 26 investigation bore holes, and 105 sieving tests. The first part of the paper is a brief introduction of the liquefaction judgment method in Chinese national specification GB50011-2010 [4]. The second part discusses the relationship between the buried depth of the soil and the liquefaction index. The third part further studies the feasibility of the Tsuchida boundary curves in the evaluation of the silt sand liquefaction. The fourth part concludes the results of the research.
The Stratigraphic Information and The Method of SPT for Liquefaction Judgment
The harbor district located 60 km away from the central urban area of Tianjin City in the southeast direction. The strata include regional thick sedimentary strata of tertiary and quaternary. According to the early strata files and the on-site drilling exploration, it is revealed that the main strata include: quaternary modern artificial filling(Q4ml), quaternary holocenemarine sedimentary formation (Q4m), quaternary holocene continental and marine sedimentary formation (Q4mc), quaternary pleistocene series marine sediments (Q3m), within the scope of top-down. Typically, the artificial filling Q4ml includes gravel and fine sand containing a little clay particle with an averaged5.8 m depth. The Q4mstratum mainly consists of silt and silty clay with an averaged 4.2 m depth. The Q4mcstratum has an averaged 12.3 m depth of clay soils with high clay content containing a 2.1 m thick interlayer of fine sand with a little clay particle.
The standard penetration test (SPT) has been widely used and verified as an effective wayand persuasive way to determine the consolidation of soils. The consolidation of the soil has a main influence on soil’s liquefaction. Thus, it is now utilized to determine soils’ liquefaction in this paper. In fact, there are many empirical formulas established based on quantity of SPT data to judge liquefaction.
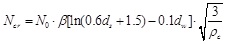
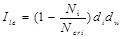
According to standard penetration test (SPT) from Chinese national specification Codes for Seismic Design of Building (GB50011-2010),this testing method is a dynamic penetration. A hammer of 63.5 kg weight falls from 76 cm high to compact the tested soil in the exploration hole. The SPT starts when the hammer is penetrated into the soil for 15 cm. The hammer’s hitting number Nc is recorded once the hammer is penetrated into the soil for another 30 cm. The recorded Nc is used to determine the consolidation of tested soils. According to the specification, the earthquake intensity, earthquake acceleration, discriminated liquefaction depth and SPT benchmark value N0 for discrimination are respectively 7 degrees, 0.15 g, 15 m and 10 in Tianjin. The critical value Ncr can be calculated based on Equation 1. When the SPT result of Nc is smaller than Ncr, the tested soil is classified as liquefacient. Liquefaction index Ile demonstrated in Equation 2 can be applied to judge the liquefaction degree of the tested soils. A smaller value of Ile means the tested soil is more difficult to be liquefied.
 |
(1) |
 |
(2) |
EVALUATION OF THE SAND LIQUEFACTION
Correlation Between the Averaged Liquefaction Index Ile and the Silt Depth
Based on the technical requirements, the standard penetration test must be conducted every 1.5- 2.0 m. There are 11 SPT in a depth of 0.6-15 m for each 26 exploration holes of the wharf revetment zone. For each 11 liquefaction index indifferent depths, the calculated results through Equation 2 were averaged based on 26 test results under the same depth from exploration holes to get more precise results. Correlation between the averaged liquefaction index with the upper bound and lower bound and the silt depth is described as a curve in Fig. (1).
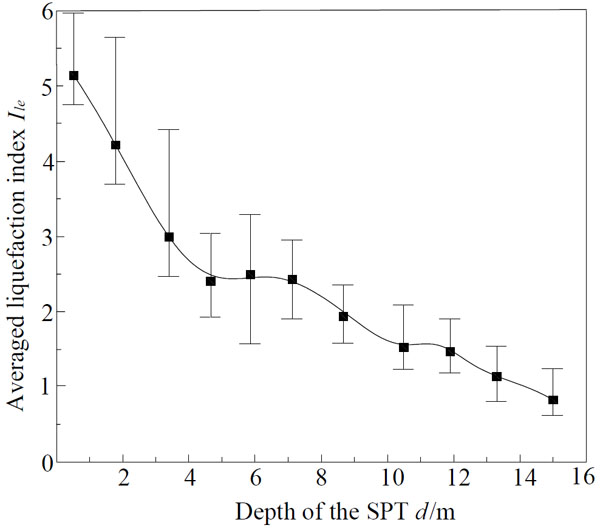
Silt liquefaction index changing curve.
To a certain extent, with the buried depth increasing, liquefaction indexes of the silt present a decreasing trend. Although slight fluctuation, the curve is still descend overall, showing that along with the silt buried depth increasing, silt liquefaction index gradually diminishes, which means the silt does not prone to be liquefied. Normally, the same hole of the single layer liquefaction index Ile, keeps on diminishing as the buried depth increases. Considering the fluctuation appearing in Fig. (1), the degree of the correlation relationship between the buried depth ds and the liquefaction index Ile cannot be judged.
Therefore, the software named SPSS is used. SPSS is the abbreviation of statistical product and service solutions. It is internationally used software for data processing and analysis. The statistical processing and analysis function includes descriptive statistics, mean comparison, general linear model, correlation analysis, regression analysis, log linear model, etc. In this paper, the correlation analysis is primarily used. Conclusions of the correlation between liquefaction index Ile and buried depth ds based on SPSS are exported as follows in Table 1.
Correlation analysis result of SPSS.
| Buried depth of silt d/m |
Liquefaction index Ile |
||
|---|---|---|---|
| Buried depth of silt d/m |
Pearson correlation | -.933 | |
| obviousness (bilateral) | .001 | ||
| N | 10 | 10 | |
| Liquefaction index Ile |
Pearson correlation | -.933 | |
| obviousness (bilateral) | .001 | ||
| N | 9 | 9 | |
According to SPSS, the value of correlation is -0.933. The distance is very close between its absolute value and the value of 1, which proves that the correlation degree of the two variables is significant. The value of obviousness index is 0.001, meaning the possibility of the wrong type of conclusion is 0.1%, further verifying the conclusion that the liquefaction index of silt diminished as the buried depth increases.
Tsuchida Boundary Curves
Based on a large number of non-liquefied and liquefied soil sieving test results known at the time of the earthquake past, Tsuchida put forward the easy - to - liquid grading boundary curves [5] (Tsuchida boundary curves). Four curves are final grading curves boundary of soil shown in Fig. (2). All the sand of grading curves in the section between the 2nd and 3rd curves can be affirmatively defined as liquefied. Soil of grading curves located in the section between the 1st and 2nd curves or the 3rd and 4th curves are defined as possibly liquefied. Soil of curves located in the left zone of the 1st curve or the right of the 4th curve is non-liquefied.
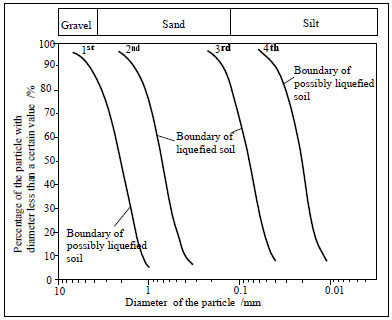
Tsuchida boundary curves.
Feasibility of the Application of the Boundary Curves in Liquefaction Evaluation
The SPT test, conducted every 1.5-2.0 m, can be used to judge whether soils can be liquefied or not. The employed testing data are chosen from 15 exploration holes of the wharf revetment zone. The recorded testing data under the same depth are averaged based on each 15 different values, while the calculated results are through Equation 1, both of which are shown in Table 2.
Comparison of the recorded SPT data and the results from Equation 1.
| Testing depth/m | Recorded data |
Calculated results from Equation 1 |
Judgment for liquefaction |
|---|---|---|---|
| 0.6 | 2.7 | 3.8 | Yes |
| 1.7 | 9.5 | 12.2 | Yes |
| 3.2 | 14.9 | 17.2 | Yes |
| 4.6 | 18.4 | 20.1 | Yes |
| 6.0 | 19.7 | 22.2 | Yes |
| 7.4 | 21.9 | 23.9 | Yes |
| 8.9 | 24.6 | 25.4 | Yes |
| 10.6 | 28.5 | 26.8 | No |
| 12.0 | 31.6 | 27.8 | No |
| 13.4 | 31.8 | 28.7 | No |
| 15.0 | 32.4 | 29.6 | No |
From Table 2, it can be observed that, as the testing depth increases, both the corresponding recorded data and the calculated results from Equation 1increase, which means that the soil tends to be denser, and more difficult to be liquefied. The buried depths have primary influence on the liquefaction judgment. From the results, it can be concluded that 10.6 m is the critical depth for liquefaction judgment. When the buried depth of the soil is less than 10.6 m, it can be judged as liquefied, and as non-liquefied when the depth is more than 10.6 m.
According to the conclusion, soils of less than 10.6 m depth have been defined as liquefied soils. For a further verification of the liquefaction judgment, the sieve test data from samples of buried depth less than 10.6 m was chosen, including samples with 7 different buried depths of 0.6, 1.7, 3.2, 4.6, 6.0, 7.4 and 8.9 m in 15 investigation holes, meaning that the total number of used samples is 105. For 15 samples under the same depth, the content of grain size in the same grade is averaged. There are 7 grain size distribution curves regarding the 7 different buried depths as shown in Fig. (3). Tsuchida boundary curves introduced in Fig. (2) have been applied for a further liquefaction validation.
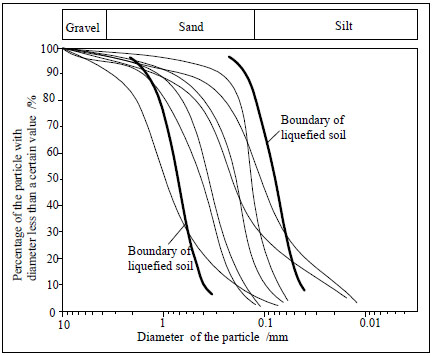
The liquefied sand grading curves and Tsuchida grading boundary curves.
To determine whether Tsuchida boundary curves can be utilized to judge the liquefaction of soils in this harbor district in Tianjin City, the seven grading curves of liquefied soils based on Table 3 are drawn, and the comparison is shown in Fig. (3).
Averaged grading distribution from the sieve tests of the liquefied soils under less than 10.6 m depth.
| Diameter of the sieve/mm |
Percentage of the particle content/% | ||||||
|---|---|---|---|---|---|---|---|
| 5 | 94.6 | 96.1 | 97.3 | 95.6 | 98.5 | 99.0 | 97.1 |
| 2 | 82.6 | 93.2 | 92.9 | 93.2 | 94.6 | 98.0 | 92.9 |
| 1 | 52.6 | 89.0 | 81.9 | 89.2 | 91.9 | 96.8 | 89.2 |
| 0.5 | 26.4 | 81.2 | 57.7 | 80.7 | 89.2 | 94.4 | 81.2 |
| 0.25 | 14.4 | 61.4 | 22.2 | 61.1 | 81.4 | 90.2 | 61.9 |
| 0.075 | 2.4 | 24.0 | 6.5 | 5.4 | 35.9 | 12.2 | 23.7 |
| 0.05 | - | 18.1 | - | - | 24.7 | - | 18.3 |
| 0.02 | - | 7.8 | - | - | 11.2 | - | 8.1 |
It can be observed that most of the curves were exactly located in the zone of the sand.That is to say, most of the soil with a depth less than 10.6 m can be defined as sand. Only for the first grading curve, most of it was located in the zone of gravel. It is because there was artificial fill layer in very shallow depth with many rubbles and gravels.
Despite the slight inconformity of the first gravel grading curve, most of the sand grading curves are completely coincident, and located between the Tsuchida boundary curve showing that liquefaction condition of regional soil in harbor district in Tianjin can be determined through the Tsuchida grading boundary curves.
According to the grading curves, the mean grain size d50=0.343 mm, controlling grain size d60=0.416 mm, effective grain size d10=0.107 mm, d30= 0.227 mm. The non-uniformity coefficient CU equals to 3.87 and less than 5, curvature coefficient Cr equals to 1.15 and less than 3, showing that regional sand is of poor grading. It is generally accepted that the particle grading of the soil has a profound impact on the dynamic stability. Soil with greater non-uniformity coefficient has a better dynamic stability, and more difficult to be liquefied. Generally, when Cu is more than 10, it is difficult to liquefy the sand [6].
Clay content of the silty clay.
| Recorded SPT results N63.5 |
Critical value Ncr from Equation 1 |
Clay content Mc(%) |
Liquefaction judgment |
|---|---|---|---|
| 7 | 8.2 | 17.6 | Yes |
| 7 | 8.6 | 17.6 | Yes |
| 4 | 8.1 | 17.6 | Yes |
| 5 | 8.3 | 17.6 | Yes |
| 5 | 8.6 | 17.6 | Yes |
| 4 | 9.0 | 17.6 | Yes |
| 4 | 9.5 | 17 | Yes |
| 3 | 8.9 | 17.6 | Yes |
| 7 | 7.3 | 17.6 | Yes |
| 5 | 7.8 | 17.6 | Yes |
| 5 | 10.0 | 17.6 | Yes |
| 8 | 9.8 | 17 | Yes |
| 9 | 10.1 | 17 | Yes |
| 4 | 9.1 | 17.6 | Yes |
| 4 | 9.5 | 17.6 | Yes |
| 5 | 9.0 | 17.6 | Yes |
| 5 | 9.2 | 17.6 | Yes |
| 5 | 9.7 | 17.6 | Yes |
| 3 | 8.8 | 17.6 | Yes |
| 4 | 9.2 | 17.6 | Yes |
| 7 | 9.6 | 17.6 | Yes |
| 6 | 8.9 | 17.6 | Yes |
| 14 | 10.5 | 15.4 | No |
| 50 | 10.6 | 16.2 | No |
| 19 | 10.3 | 15.4 | No |
| 24 | 10.6 | 15.4 | No |
| 14 | 10.9 | 15.4 | No |
| 11 | 10.0 | 15.4 | No |
| 23 | 10.3 | 15.4 | No |
| 13 | 10.6 | 15.4 | No |
| 15 | 10.9 | 15.4 | No |
| 13 | 10.9 | 15.4 | No |
| 15 | 9.1 | 17 | No |
| 11 | 10.1 | 15.4 | No |
| 15 | 10.9 | 15.4 | No |
| 29 | 10.3 | 16.2 | No |
| 16 | 10.9 | 15.4 | No |
| 10 | 9.5 | 17 | No |
Impact of Clay Content of Silt on Liquefaction
According to Chinese national specification Code for seismic design of buildings GB 50011-2010, for the initial determination of sandy soil liquefaction, in non-loess areas of 7 degrees site, when the value of clay content of silt is not less than 10%, silt will not be liquefied. However, after checking the statistical data of clay content of 38 silt samples, it is found that 22 samples liquefied in different degree, some even much serious, while all of the clay content is between 15% and 17.6%, as shown in Table 4.
Therefore, it can be concluded that the silt sand with clay content more than 10% in the harbor district in Tianjin does not meet the condition for the regional initial judgment of liquefaction. Furthermore, even if clay content of each silt layer is relatively uniform, the liquefaction index varies greatly. It can be inferred that it is the buried depth and particle grading that play more significant roles in the liquefaction of the silt sand rather than the clay.
CONCLUSION
This paper provides a description of regional liquefaction characteristic of sand and silt in harbor district in Tianjin City. Based on data from the SPT on 15 exploration holes, and 105 sieve tests in an engineering investigation, the liquefaction indexes of silt sand of each depth have been calculated. Utilizing the software SPSS, the relationship between liquefaction index and buried depth has been explored. By comparing the grading curves with Tsuchida boundary curves, the feasibility of utilizing Tsuchida boundary curves to judge soils’ liquefaction in this harbor area has been discussed. It is well believed that these conclusions are considerable for the future construction in the harbor district in Tianjin. Summarizing above discussions, it can be concluded that:
- Liquefaction index of silt sand gradually decreases as the buried depth increases. The corresponding analysis based on the software SPSS indicates that the degree of correlation between the liquefaction index Ile and buried depth ds is obvious and significant. The depth of 10.6 m is a critical depth upon which the soil can be defined as liquefied.
- Sieve tests showed that soils of less than 10.6 m depth are of bad gradation identically. Comparing the grading curves based on liquefied soils’ sieve tests with the Tsuchida boundary curves, most of the sand grading curves located between the Tsuchida boundary curves showed a complete coincidece, which further verified that the 10.6 m depth is the critical depth
- In this harbor district, once soils’ grading curves are depicted based on sieving tests, the Tsuchida boundary curves can be directly utilized to judge liquefaction even without the in-site SPT tests.
- In the harbor district, it is the buried depth and particle grading significantly influences the liquefaction of the silt sand rather than the clay content. The silt sand in 7 degrees zone with more than 10% clay is still judged as liquefied, which is not consistent with the stipulation in Chinese specification GB50011-2010.
ABBREVIATIONS
CONFLICT OF INTEREST
The authors confirm that this article content has no conflict of interest.
ACKNOWLEDGEMENTs
Declared none.

