All published articles of this journal are available on ScienceDirect.

Experimental Study on Structural Degradation of CFRP Strengthened RC Beams Subjected to Weak Interfaces
Abstract
The performance of corroded reinforced concrete (RC) beams strengthened with externally bonded carbon fiber reinforced polymer (CFRP) materials may be affected by a weak interface caused either by defective bonding between the new and old concrete in the case of cover replacement or by expansive cracks in the case of direct application. To investigate this effect, thirteen strengthened beam specimens with preinstalled horizontal weak interfaces were designed and tested in monotonic bending. Through analysis of the experimental results, in terms of load deflection curves and the derived bond stress distribution, it was found that intermediate delamination was induced by the weak interfaces, which greatly impaired the integrity of the strengthening system and eventually led to CFRP integral debonding without lateral confinement. Degradation of the shear transfer ability through the interface can be expected due to interfacial weakening, increasing of the CFRP reinforcement ratio and reduction of cover thickness. Crack-induced weak interfaces caused less serious damage at the early stage but induced more dramatic degradation as cracks expanded. U-strip confinement was found to be effective in improving the structural performance of the strengthened beam and preventing CFRP integral debonding. Nevertheless, intermediate delamination cannot be prevented, increasing the risk of CFRP premature rupture and end anchorage failure.
1. INTRODUCTION
Corroded reinforced concrete (RC) beams can be effectively strengthened with externally bonded carbon fiber reinforced polymer (CFRP) materials [1-5]. This technique can significantly enhance the load carrying capacity of the beams, and additionally, their residual service life can also be extended due to the barrier provided by the epoxy and FRP coating [6-8].
The structural performance of corroded RC beams strengthened with FRP, however, might be significantly different from that of conventional strengthened beams. When FRP sheets or plates are used to strengthen a corroded beam, the degraded concrete cover must normally be removed and recast. In this case, a weak interface may be engendered along the new-to-old concrete interface due to faulty construction, poor concrete quality, etc. If FRP is directly applied without cover replacement, a procedure occasionally adopted as a temporary strengthening measure, a similar weak interface may be formed, due possibly to expansive cracks along the corroded tensile reinforcing bars. Instead of the conventional FRP debonding developing in the vicinity of the epoxy layer [9-11], these weak interfaces might increase the risk of cover delamination and impair the effectiveness of traditional lateral confinement.
In this study, RC beam specimens were prepared with weak interfaces formed by secondary cover construction or preinstalled cracks. They were strengthened with externally bonded CFRP sheets and then loaded in flexure monotonically to explore the influence of the weak interface on the structural behavior of the strengthened beams.
2. EXPERIMENTAL PROGRAM
2.1. Test Specimens
Thirteen strengthened RC beams were designed in this test program, including a reference specimen called “Refer”. The details of the specimens are summarized in Table 1. Each beam specimen had a rectangular cross section of 150 mm by 200 mm and a length of 2200 mm, as shown in Fig. (1). Because the aim of this study is to explore the effects of a weak interface to the strengthening system, none of the reinforcing steel bars was actually corroded, and weak interfaces were artificially established for Group A and Group B through two different methods. Additionally, weak interface was established only at half of a beam specimen, which was defined as the debonding end as seen in Fig. (1). The other half beam is referred to as the anchorage end, in which no weak interface was set and extra measures were taken to avoid any debonding failure of the flexural CFRP sheet. In this way, experimental observation and measurements could focus uniquely on the debonding end.
Configuration of test specimens (dimensions in mm).
Details of beam specimens.
| No. | Cover depth | Width of flexural | Strength of | Width of preset | Extra | |
|---|---|---|---|---|---|---|
| c (mm) | sheets (mm) | interface | cracks (mm) | U-strips | ||
| Refer | 25 | 140 | - | - | No | |
| Group A | L-25-140 | 25 | 140 | Low | - | No |
| M-25-140 | 25 | 140 | Medium | - | No | |
| H-25-140 | 25 | 140 | High | - | No | |
| M-25-100 | 25 | 100 | Medium | - | No | |
| M-25-100×2 | 25 | 100×2 | Medium | - | No | |
| M-15-140 | 15 | 140 | Medium | - | No | |
| M-35-140 | 35 | 140 | Medium | - | No | |
| L-25-140-U | 25 | 140 | Low | - | Yes | |
| M-25-140-U | 25 | 140 | Medium | - | Yes | |
| Group B | B50-25-140 | 25 | 140 | - | 25×2 | No |
| B80-25-140 | 25 | 140 | - | 40×2 | No | |
| B80-25-140-U | 25 | 140 | - | 40×2 | Yes |
(1) Group A consisted of nine specimens; weak interfaces were created by defective bonding between new and old concrete. As shown in Figs. (1 and 2), half of the concrete cover was reserved for secondary construction. After 28 days of curing, the old surface of the reserved part was processed, and the cover was complemented with fine aggregate concrete. Finally, CFRP sheets were applied to the soffit after another curing period.
Beam specimens in Group A before cover recasting.
As listed in Table 1, the numbering rule of specimens in Group A is as follows: L, M and H stand for low strength level (severely weakened interface), medium strength level (moderately weakened interface) and high strength level (lightly weakened interface), respectively; 100, 140 and 100×2 stand for 100 mm, 140 mm and double-layer 100 mm wide flexural CFRP sheets, respectively; 15, 25 and 35 stand for a cover thickness of 15 mm, 25 mm and 35 mm, respectively; U stands for extra U-strips provided as confinement at the debonding end.
(2) Group B consisted of three specimens; weak interfaces were created by preinstalled cracks generated by symmetrically pre-burying two oilcloth strips, as shown in Figs. (3 and 4). The numbering rule of specimens in this group is as follows: B50 and B80 stand for 50 mm and 80 mm total width of the preset cracks, respectively.
Embedded oilcloth strips in molds of Group B.
A typical specimen in Group B (B50-25-140).
2.2. Treatment of The New-to-old Concrete Interface
The three levels of new-to-old concrete interfaces, denoted as L, M, and H, were obtained through different surface treatment methods. A low-strength interface was established by simply cleaning the old concrete surface with a wire brush, a medium-strength interface was established by chiseling the old concrete surface, and a high-strength interface was established by chiseling the old concrete surface and subsequently coating it with a thin layer of cement paste which had the same mix proportion as the new complementary concrete. All the chiseled surfaces had the same roughness, which was controlled by the sand-filling method, and the average penetration depth was approximately 2.6 mm.
Three cube specimens and three Z-shaped specimens were prepared for each strength level to determine the splitting tensile strength and shear strength, respectively. Sketches of the specimens are illustrated in Fig. (5), and the unspecified thickness is 150 mm. Halves of those specimens were constructed with the same concrete as the mean body of the beam specimens. After the first curing period, the bonding surfaces were treated with one of the three procedures explained above, and the other halves were constructed with the complementary concrete. After another curing period of 28 days, the specimens were tested, as shown in Fig. (6) [12].
Sketch of splitting and shear test specimens.
Splitting and shear strength tests.
2.3. CFRP Strengthening Scheme and Test Setup
CFRP sheets were applied after the complementary concrete had cured for 28 days. The process of applying CFRP to concrete includes four steps: (1) surface preparation, (2) resin under-coating, (3) CFRP applying, and (4) resin over-coating. The concrete surfaces were prepared by grinding machine followed by cleaning. The corner over which CFRP was applied was ground to a radius of 6 mm. After this first step epoxy resin was applied to the prepared concrete surfaces. CFRP sheets were pressed on the surfaces after the epoxy resin began to be dry. Finally, a resin over-coating was applied over the CFRP sheets. Complete curing took one week at room temperature.
As shown in Fig. (7), flexural CFRP was bonded to the soffit of the beam specimen extending 50 mm away from the supports. For all specimens, three U-strips with a width of 100 mm were set unexceptionally at the anchorage end to ensure that debonding failure would take place at the debonding end. The same U-strips were applied symmetrically at the debonding end only for three specimens, including L-25-140-U, M-25-140-U and B80-25-140-U, to investigate the effectiveness of U-strip confinement.
CFRP strengthening scheme (dimensions in mm).
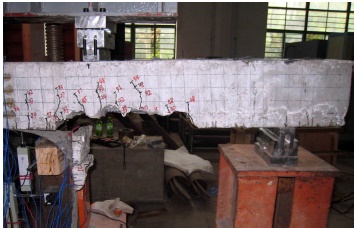
The beams were simply supported and tested under four-point bending, as seen in Fig. (8), which depicts the test site. Mid-span deflection was measured by linear variable displacement transducer (LVDT), and foil gauges were densely glued onto the flexural CFRP sheet, as seen in Fig. (7). A vertical load was applied at steps of 3 kN until yielding of the embedded tensile reinforcement, succeeded by continuous loading until ultimate failure occurred. All of the data were collected synchronously by computer.
Site of flexural test setup.
3. TEST RESULTS
3.1. Material Properties
The concrete used for the beam specimens was composed of ordinary Portland cement at 400 kg/m3, tap water at 180 kg/m3, sand at 570 kg/m3 and coarse aggregate at 1250 kg/m3. The average cubic strength was 32.8 MPa, determined from three 150mm×150mm×150mm cubes. The complementary concrete used for the cover patches was composed of ordinary Portland cement at 430 kg/m3, tap water at 190 kg/m3, sand at 600 kg/m3, coarse aggregate (maximum diameter of 10 mm) at 1120 kg/m3 and additional superplasticizer at 3% by weight of cement. The average cubic strength of the complementary concrete was determined to be 42.8 MPa in the same way. The average values of yield strength, ultimate strength and elastic modulus of the tensile reinforcing bars were 425 MPa, 610 MPa and 210 GPa, respectively. The thickness of the CFRP sheets was 0.167 mm, and their tensile strength, elastic modulus and ultimate elongation were provided by the manufacturer to be 4208 MPa, 245 GPa and 0.0171, respectively. The splitting tensile strength of the weakened interfaces of the L, M and H levels were 0.96 MPa, 1.06 MPa and 1.16 MPa, respectively, and their shear strengths were 3.8 MPa, 3.8 MPa and 4.2 MPa, respectively. To make a direct comparison, the correlative strengths of the sound concretes were determined through previous research results. The splitting tensile strengths of the beam concrete and the complementary concrete were 2.95 MPa and 3.52 MPa, respectively [13], while the shear strengths were 2.93 MPa and 4.19 MPa, respectively [14].
3.2. Flexural Test Results
Flexural test results of the specimens are summarized in Table 2. Herein, Py and Pu stand for the yield load and ultimate load in kN, respectively, fc stands for the uniaxial cylinder compressive strength of concrete in N/mm2 (fc = 26.5 MPa), which is determined from the cubic strength (Rc=32.8 MPa) [13], and b and h 0 stand for the width and effective height of the beam cross section in millimeters, which were designed to be 150 mm and 175 mm, respectively. The real cross-sectional size and effective height of the specimens had minor deviations from the design; thus, the actual measured values are listed in Table 2 together with nondimensional calculation results. Ultimate strain of CFRP in Table 2 refers to the mid-span tensile strain of the CFRP sheet at its ultimate state.
Results of flexural tests.
| Specimen | Cross section (mm2) |
Effective height h 0(mm) |
Yield Load Py/fcbh0 |
Ultimate load Pu/fcbh0 |
Ultimate strain of CFRP |
Intermediate cover delamination |
Failure mode |
|---|---|---|---|---|---|---|---|
| Refer | 159×203 | 167 | 0.081 | 0.103 | 0.00704 | - | DB |
| L-25-140 | 155×204 | 167 | 0.084 | 0.111 | 0.00732 | Heavy | DB |
| M-25-140 | 159×205 | 171 | 0.080 | 0.113 | 0.00895 | Medium | DB |
| H-25-140 | 153×210 | 189 | 0.079 | 0.117 | 0.00902 | Light | DB |
| M-25-100 | 163×204 | 184 | 0.065 | 0.080 | 0.00749 | Light | DB |
| M-25-100×2 | 160×213 | 192 | 0.082 | 0.100 | 0.00551 | Medium | DB |
| M-15-140 | 160×208 | 187 | 0.074 | 0.115 | 0.00909 | Heavy | DB |
| M-35-140 | 154×205 | 159 | 0.089 | 0.119 | 0.00787 | Heavy | DB |
| L-25-140-U | 155×205 | 183 | 0.078 | 0.122 | 0.01106 | Light | UD,FR |
| M-25-140-U | 163×207 | 170 | 0.082 | 0.131 | 0.01130 | Medium | UD,FR |
| B50-25-140 | 153×203 | 166 | 0.082 | 0.109 | 0.00971 | Integral | CD |
| B80-25-140 | 155×206 | 170 | 0.078 | 0.105 | 0.00693 | Integral | CD |
| B80-25-140-U | 160×208 | 175 | 0.079 | 0.131 | 0.01279 | Medium | FR |
A typical integral CFRP debonding failure (denoted as DB in Table 2) occurred in the reference specimen along the epoxy-concrete interface. Similar integral debonding took place for specimens in Group A without lateral confinement at the debonding end. Intermediate cover delamination along the weak interface was observed prior to yield of tensile reinforcement, and blocks of separated concrete cover peeled off with the flexural sheet under ultimate failure, as shown in Fig. (9). This intermediate cover separation observed in individual specimens is roughly classified into three grades according to its scale, and results for cover separation are also listed in Table 2.
Large-scale peeling off of concrete cover (M-25-140).
For specimens in Group B, which had weak interfaces induced by preinstalled cracks, the failure took place in a more brittle way than the specimens of the Group A. The whole cover abruptly separated from the mean beam (denoted as CD) at the ultimate state, and only ambiguous relative slippage could be observed along the weak interface previously, as shown in Fig. (10).
Typical failure mode of specimens with preinstalled cracks (B80-25-140).
Under U-strip confinement at the debonding end, integral debonding of flexural CFRP could be effectively inhibited. Specimen L-25-140-U, M-25-140-U and B80-25-140-U all failed by rupture of the flexural CFRP sheets (denoted as FR), sometimes preceded by U-strip detachment (denoted as UD), as shown in Fig. (11). In addition, signs of cover separation were observed prior to ultimate failure. In this case, the ultimate strains of CFRP rupture failure listed in Table 2 are far below to the material property which may be explained by the following reasons. Firstly, the ultimate elongation of CFRP material property is determined from ideal tensile test, while in real situation premature rupture of flexural CFRP are quite normal due to uneven tension of strips, locally defective binding, crack of substrate concrete, etc. Additionally, complex stress condition caused by U-strip confinement is another factor which may induce flexural CFRP rupture at low strain. It can be clearly illustrated in Fig. (11) that the rupture occurred right along edge of a U-strip. Since it is impossible to predict the rupture point, herein mid-span strains were listed to make a rough comparison.
Typical failure mode under U-strip confinement (M-25-140-U).
As described above, the beam specimens were mainly failed by CFRP debonding or cover delamination. Such brittle failure processes were apparently very similar, and they took place so quick and abrupt that they can hardly be observed and recorded clearly. To make clear the failure modes and influences of different strengthening schedules and interfaces, the development of bond stress distribution curve were plotted out in the next section and critical states were screened out, which formed the basis for further analysis.
4. DISCUSSION
4.1. Derivation of Characteristic Debonding Parameters
To comparatively evaluate the shear transfer abilities along the weak interfaces and anti-debonding performances of the specimens, the change in bond stress distributions between the flexural sheet and the substrate concrete in the loading process was determined, and some characteristic parameters were proposed.
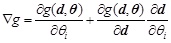
Debonding of flexural CFRP sheets can be primarily ascribed to the overly high bond stress between the sheet and the substrate concrete; thus, the variation of the bond stress distribution along the flexural CFRP sheet is the key factor in exploring the failure process and mechanism. In this work, foil gauges were intensively glued onto the flexural sheets, as seen in Fig. (7). These foil gauges are labeled with integer values (1, 2, …, n), and strains in the CFRP at the individual measuring points were recorded and bond stress was calculated using the following equation:
 |
(1) |
where τk is the bond stress between the CFRP and the concrete at the middle point between two foil gauges numbered k and k+1 (k=1,2,…,n-1); εk and εk+1 are the strains measured by the two gauges, Ecf and tcf are the elastic modulus and thickness of the CFRP sheet; lk is the distance between the two foil gauges numbered k and k+1. Eq.(1) is simply deducted from mechanics balance, that is, the variation of tensile force along CFRP sheet is equal to the accumulation of bond stress. It should be pointed out that debonding of CFRP material takes place normally on the interface between epoxy layer and concrete. The thickness of epoxy layer is not considered in Eq.(1) for simplification, since the layer is very thin and comparative analysis is of the most concern rather than absolute values.
A typical segment of a bond stress distribution curve.
Once the bond stresses at discrete points have been determined using Eq. (1), the distribution curve of the bond stress can be plotted along the CFRP sheet using spline interpolation. Fig. (12) shows part of a typical distribution curve in which the definitions of characteristic parameters of CFRP debonding are illustrated. Bond stress between the CFRP sheet and the concrete is created by two effects: the internal moment variation in the longitudinal direction and retraction of the cracking concrete. Herein, these effects are, respectively referred to as shear bond stress and cracking bond stress. Theoretically, shear bond stress has the same direction in either half span of a bending beam, while crack bond stress distributes symmetrically over a crack in opposite directions. Superposition of the two stresses engenders the actual bond stress distribution. As shown in Fig. (12), a stress peak is formed on one side of a crack near to the support, while a stress valley is formed on the other side. If no new cracks occur, the curve will maintain approximately the same shape as its value increases, until the peak reaches the ultimate bond strength. At this critical state, local debonding takes place, and a new stress peak may be formed near the support after bond stress redistribution, or, in some cases, the local debonding might expand unstably and rapidly develop into an integral debonding.
The ability to resist debonding can be represented largely by the bond stress peak at the critical state, and this peak has great significance in establishing a model of anchorage strengthening at the critical state. Herein, three characteristic parameters are proposed to describe the bond stress peak, including ultimate bond stress τu, bond transfer length lT and enveloping area AT. As shown in Fig. (12), lT is the breadth of the peak, or the double breadth of one half peak in the case of a long tail. AT is the enveloping area of the peak in the range of lT, as illustrated by the shaded area in Fig. (12).
Because the crack bond stress is inversely distributed over the two sides of a crack, the mathematical area determined by the integral of a bond curve represents the contribution of the shear bond stress. Herein, this area is denoted as Ash, and the average shear bond stress τav can be calculated by dividing Ash by the distribution length. The absolute area Awh enveloped by a bond curve and the X-axis represents the total existing bond. In addition, a shear bond coefficient η is proposed to characterize the fraction of the shear bond contribution to the total bond.
 |
(2) |
A cluster of bond stress distribution curves was plotted for each beam specimen. The bond distribution curves at critical states, which are the curves observed right before curvilinear shape mutation, as mentioned above, were selected, and their average shear bond stresses were calculated together with their shear bond coefficients. Among the several critical curves of a specimen, the maximum shear bond stress was taken as the representative value and listed in Table 3, along with the corresponding shear bond coefficient. Among the critical curves, the largest peak was selected as the representative to determine the bond strength, shear transfer length and peak enveloping area, which are all summarized in Table 3. It should be noted that strain gauges could not be densely set due to the presence of U-strips at the debonding end for specimens L-25-140-U, M-25-140-U and B80-25-140-U; the characterization of a single peak was less meaningful in these cases, which explains the blanks in Table 3.
Characteristic parameters of CFRP debonding.
| Specimen | Bond strength τu (N/mm2) |
Shear transfer length lT(mm) |
Peak enveloping area AT (N/mm) |
Average shear bond stress τav (N/mm2) |
Shear bond coefficient η(%) |
|---|---|---|---|---|---|
| Refer | 3.41 | 75.1 | 264.2 | 0.51 | 84.6 |
| L-25-140 | 3.49 | 38.8 | 144.1 | 0.28 | 58.6 |
| M-25-140 | 3.47 | 56.4 | 179.4 | 0.38 | 61.9 |
| H-25-140 | 3.16 | 71.5 | 244.0 | 0.54 | 95.4 |
| M-25-100 | 4.81 | 49.9 | 298.0 | 0.82 | 81.3 |
| M-25-100×2 | 3.62 | 38.6 | 153.8 | 0.58 | 64.4 |
| M-15-140 | 2.59 | 46.5 | 124.7 | 0.46 | 70.6 |
| M-35-140 | 3.04 | 64.3 | 204 | 0.48 | 83.6 |
| L-25-140-U | 2.80 | – | – | 0.54 | 81.8 |
| M-25-140-U | 3.89 | – | – | 0.64 | 68.9 |
| B50-25-140 | 2.87 | 82.0 | 116.2 | 0.50 | 75.7 |
| B80-25-140 | 2.36 | 40.5 | 58.4 | 0.19 | 57.3 |
| B80-25-140-U | 3.97 | – | – | 1.24 | 84.6 |
Because a layer of cover concrete exists between the flexural sheet and the weak interface, the bond stress distribution on the weak interface theoretically differs from that derived by the method described above. However, if shear failure takes place along the interface, all of the causal shear bond stress must be transferred through the interface. Therefore, the shear bond stress on the interface are equal in the total amount to that on CFRP-concrete interface, though the interfacial bond stress distribution may somehow be smoothed and the fluctuations reduced due to the effect of the concrete cover. Because the interfacial bond stress cannot be obtained directly, it is reasonably to adopt this approximation.
4.2. Effects of Interfacial Weakening
Specimens L-25-140, M-35-140, H-25-140 and Refer form a group that allows exploration of the interfacial effects under different degrees of weakening, and their load versus mid-span deflection curves are shown in Fig. (13). No major difference can be identified in these curves, excluding the influence of different effective heights of the specimens, as seen in Table 2 the nondimensional results. All three specimens experienced intermediate cover delamination and failed in CFRP integral debonding after yield of tensile reinforcement. The scale of cover separation increased with the interfacial weakening, providing evidence of degradation.
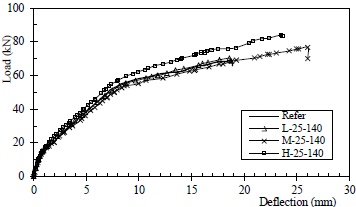
Load versus mid-span deflection curves for specimens with varied interfaces.
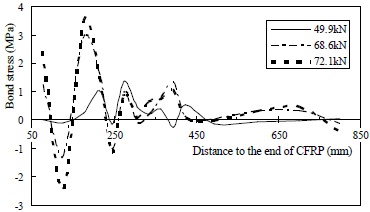
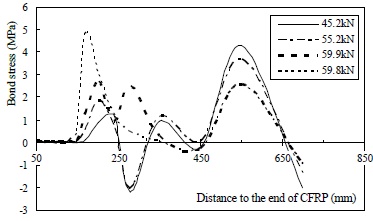
The effect of the weak interface on CFRP debonding is further revealed by the critical bond stress distribution curves of the specimens, which are shown in Figs. (14-17). Local debonding was first observed on the reference specimen at 66.7 kN, which is quite close to the ultimate load of 68.1 kN, suggesting that flexural CFRP performed fairly well in the previous stage. Local debonding tended to occur at much lower load levels for the other three specimens under the influence of weak interfaces. Actually, local debonding is more appropriately called intermediate cover delamination for these specimens, considering that the shear failure developed along the weak interface. The load at which the first local debonding appeared was approximately 98% of the ultimate load for the reference specimen, and they were approximately 78%, 69% and 61%, respectively, for specimens L-25-140, M-25-140 and H-25-140. This means that the local failure caused by the weak interface took place prior to the yield of tensile reinforcement.
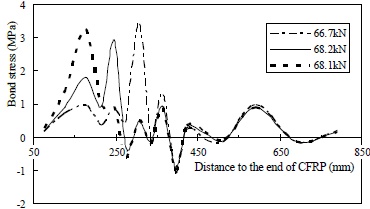
Critical bond stress distribution curves of the reference specimen.
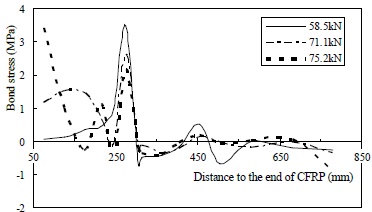
Critical bond stress distribution curves of specimen L-25-140.
Critical bond stress distribution curves of specimen M-25-140.
Critical bond stress distribution curves of specimen H-25-140.
The results suggest that the ultimate bond strength, which ranged from 3.1 MPa to 3.5 MPa, as measured from the critical curves, was not likely affected by interfacial weakening. However, the weakening effects are quite obvious in the other parameters. As listed in Table 3, the bond transfer length, peak area and average shear bond stress of specimen H-25-140 are similar to those of the reference beam, while they are roughly half those of the reference beam for specimen L-25-140, which had a severely weakened interface. The decreasing trend observed in both the average shear bond stress and the shear bond coefficient suggests that the integral shear bond transfer capacity, as well as the residual shear bond transfer capability, was markedly reduced after local delamination.
Additionally, the movement of the critical stress peak toward the support can be clearly seen by comparing the critical curves of the slightly weakened specimen H-25-140 (Fig. 17), which is similar to the reference specimen. This bond stress redistribution process, however, cannot be observed in the specimens with moderately and heavily weakened interfaces. Thus, it is reasonable to conclude that weakening of the interface will reduce the safety margin and result in more brittle debonding.
4.3. Effects of the Flexural CFRP Reinforcement Ratio
The effects of the flexural CFRP reinforcement ratio were investigated comparatively using a group of specimens including M-25-100, M-25-140 and M-25-100×2; the load deflection curves for these three specimens are plotted in Fig. (18). The nondimensional results in Table 2 show that the yield load of the beams increased with the increasing of reinforcement ratio. However, this increase engenders much higher shear stress, under rapidly increasing deformation after the beam yields, which might explain the quick failure of specimen M-25-100×2. Under such circumstances, the ultimate CFRP strain was as low as 0.00551 at mid-span.
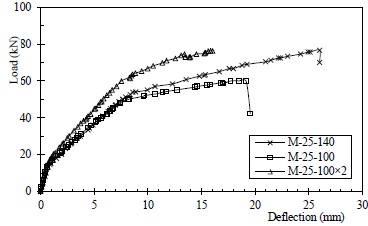
Load versus mid-span deflection curves for specimens with varied CFRP reinforcement ratio.
Critical bond stress distribution curves of specimen M-25-100×2.
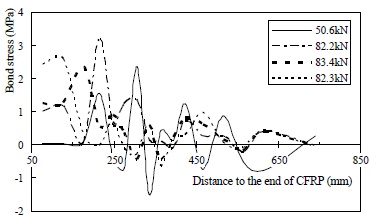
Increasing the CFRP reinforcement seems to be detrimental to the anti-debonding performance. Based on experimental observations, the intermediate delamination along the weak interface was more severe for M-25-100×2 than for M-25-100. Doubling of the flexural sheet decreased the peak enveloping area to nearly half; other key parameters were markedly reduced as well as listed in Table 3. In addition, the “critical peak movement” among the critical curves for M-25-100×2 in Fig. (19) and the relatively lower bond strength implies full development of local delamination, which cannot be observed for M-25-100 in Fig. (20).
The results for specimen M-25-140 seem to contradict the above conclusion, especially with regards to the ultimate bond strength and average shear bond stress, which are 4% and 34% lower than those of M-25-100×2, respectively. However, this discrepancy could be explained by the restraint effect [15]. The soffit width of the specimens was 150 mm, and the width of the bonded CFRP sheets of specimens M-25-100 and M-25-100×2 was 100 mm. Concrete from the external area would certainly contribute to the resistance to debonding or delamination. The width of the CFRP sheet was 140 mm for M-25-140; therefore, it would benefit only slightly from this effect.
Critical bond stress distribution curves of specimen M-25-100.
4.4. Effects of Cover Thickness
The distance between the weak interface and the flexural CFRP depends on the thickness of the replaced concrete cover, which is likely to be an important factor affecting CFRP debonding behavior. The influence of cover thickness was inspected comparatively using a group of specimens including M-15-140, M-25-140 and M-35-140. Load deflection curves for this group are plotted in Fig. (21), and no significant difference between the curves can be seen, taking into consideration of the influence of effective height, as shown by the nondimensional results listed in Table 2.
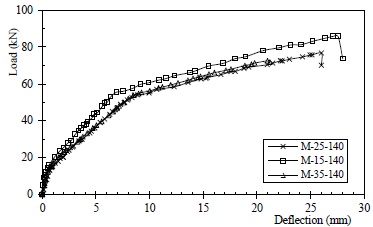
Load versus mid-span deflection curves for specimens with different cover thickness.
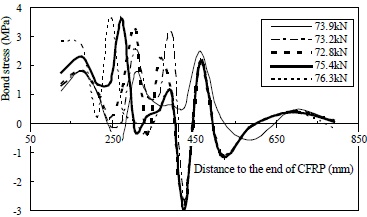
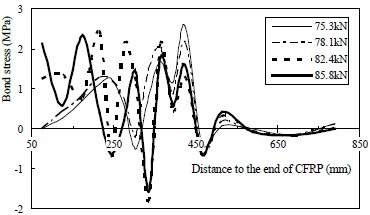
Based on the results from specimen M-15-140, a small cover thickness seems unfavorable to the shear transfer and anti-debonding performance. As listed in Table 3, the key parameters for M-15-140 are low compared to those of the other specimens. The critical bond stress curves for M-15-140 in Fig. (22) fluctuate around the X-axis in the post-delamination area, which indicates that its shear bond transfer ability has been mostly destroyed and the bond stress in this case is mainly due to cracking retraction-induced mechanical friction. Compared with M-15-140, the bond stress curves of M-35-140 tend to remain basically above the X-axis in Fig. (23), which indicates that the shear bond transfer remained intact to some extent after intermediate delamination. It is clear from the results that bond transfer length, bond peak area and shear bond coefficient all increase with the increasing of cover thickness. Although cover separation can still be observed after ultimate failure, as shown in Fig. (24), it can be concluded that debonding is less likely to be affected by the weak interface as the distance between it and the bonded CFRP sheet increases.
Critical bond stress distribution curves of specimen M-15-140.
Critical bond stress distribution curves of specimen M-35-140.
Cover separation of specimen M-35-140 after ultimate failure.
4.5. Effects of Weak Interface Induced by Cracks
The weak interfaces of specimens in Group B were formed by preinstalled cracks. The total width of the two cracks occupied 33% and 53% of the cross-sectional width of specimen B50-25-140 and B80-25-140, respectively. The two specimens experienced a similar failure process. No distinct destruction was observed along the weak interface before ultimate failure, and the beams seemed to perform well. At the ultimate state, the concrete cover was torn up abruptly near the support and peeled off completely with the flexural CFRP sheets, as shown in Fig. (10), and the separated cover remained basically intact. Load versus mid-span deflection curves of B50-25-140 and B80-25-140 are plotted in Fig. (25), together with that of the reference beam. These curves are quite similar; nevertheless, the influence of the weak interface is apparent. Compared with the reference beam, the flexural stiffness decreased gradually during the loading process for both of the two specimens, especially B80-25-140, suggesting that the co-working ability of the strengthening system was weakened with loading.
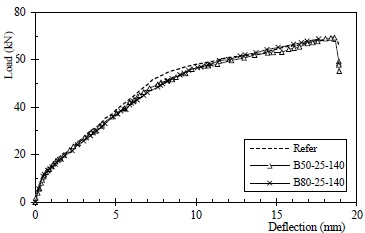
Load versus mid-span deflection curves for specimens from Group B.
Critical bond stress distribution curves of specimen B50-25-140.
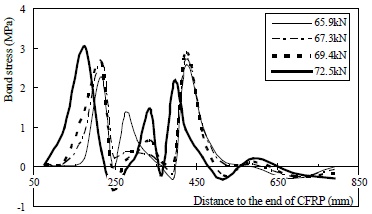
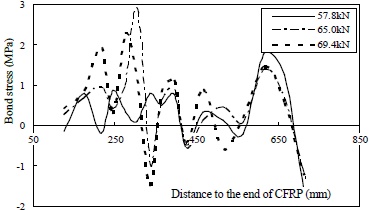
Intensive transfer of shear force through the narrowed sound area is the right reason for interfacial weakening in Group B, which might explain the rather large differences observed in interfacial weakening effects between the two groups. Critical bond stress curves of specimens B50-25-140 and B80-25-140 are plotted in Figs. (26 and 27), respectively, and their debonding parameters can be found in Table 3. Compared with the reference beam, the bond strength and peak enveloping area of specimen B50-25-140 were moderately decreased, while all of the debonding parameters of B80-25-140 dropped sharply. Thus, it is reasonable to conclude that minor damage can be expected under a low level of interfacial weakening induced by cracking, and the situation worsens radically when cracks expand.
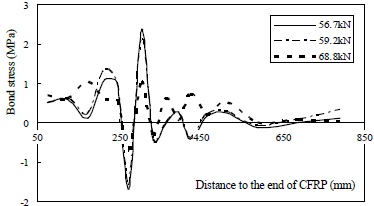
Critical bond stress distribution curves of specimen B80-25-140.
4.6. Effectiveness of U-strip Confinement
In general, the traditional measure of U-strip confinement is still basically effective under the influence of a weak interface, whether the weakened interface results from defective bonding (Group A) or expansive cracking (Group B). U-strip confinement can generally prevent integral debonding and ensure the structural performance of the strengthening system, as highlighted also in other recent studies [16].
In contrast to the two unconfined specimens L-25-140 and M-25-140 in Group A, three U-strips were individually applied at the preset debonding ends of specimens L-25-140-U and M-25-140-U, which changed the failure modes of the two specimens from CFRP integral debonding to strip-by-strip CFRP rupture accompanied by U-strip debonding, as shown in Fig. (11). In this more ductile failure process, the loads of both L-25-140-U and M-25-140-U dropped step by step, as shown in Fig. (28). As a consequence, their load carrying capacity and deformation ability were also increased considerably. The ultimate load of L-25-140-U reached as high as 86 kN, 23% greater than the 70 kN ultimate load of specimen L-25-140. The ultimate load of M-25-140-U was approximately 90 kN, 17% greater than that of M-25-140.
U-strip confinement seems to have been more effective for B80-25-140-U, considering that it increased its ultimate load by 33% compared with specimen B80-25-140. Nevertheless, specimen B80-25-140-U failed in a more brittle CFRP rupture, as shown in Fig. (29), with no stepwise drop of load during the failure process as observed for L-25-140-U and M-25-140-U in Group A.
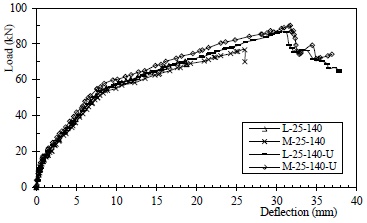
Load versus deflection curves for U-strip confined specimens in Group A.
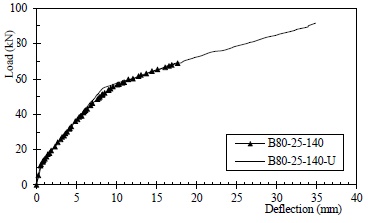
Load versus mid-span deflection curves for U-strip confined specimen in Group B.
The effectiveness of U-strip confinement is further demonstrated by the bond stress distribution results. As mentioned previously, the debonding parameters concerning local stress peaks are less meaningful for specimens L-25-140-U, M-25-140-U and B80-25-140-U due to the large intervals between the strain gauges. This effect causes comparatively milder fluctuations in the distribution curves for these specimens, as shown in Fig. (30). In spite of this, the effectiveness of U-strip confinement can be seen by comparing the average shear bond stress of the three pairs of specimens. The average shear bond stress is increased by nearly 100% for specimen L-25-140-U and by 68% for M-25-140-U compared with their contrast specimens, as shown in Table 3. This increase was over five times for B80-25-140-U compared with B80-25-140, which shows that U-strip confinement was remarkably effective in the case of crack-induced interfacial weakening. Under U-strip confinement, the ultimate strains of the flexural CFRP sheets at mid-span all exceeded 11000με for the three specimens, indicating that effective performance of the flexural CFRP can be ensured.
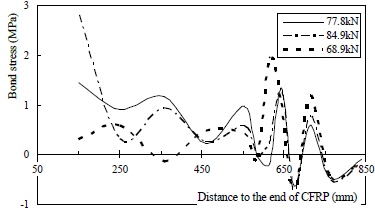
Typical critical curves for specimens with U-strip confinement at the debonding end (L-25-140-U).
Despite of the effectiveness of traditional U-strip confinement, impairments due to the weak interface could not be eliminated completely. All of the failure phenomena observed occurred at the debonding end, including cover separation, U-strip debonding and CFRP rupture, while the strengthening system remained intact at the other end. Considering the symmetrical strengthening and loading, this result implies that the preinstalled weak interface at the debonding end caused the large discrepancy in performance. U-strip confinement successfully protected the strengthened beams from integral debonding of the flexural sheet; however, Fig. (31) shows that the tensile strain of the flexural CFRP reached as high as 6000με at the position right inside the last U-strip. Such a large value suggests an extremely high risk of anchorage failure of the flexural sheets.
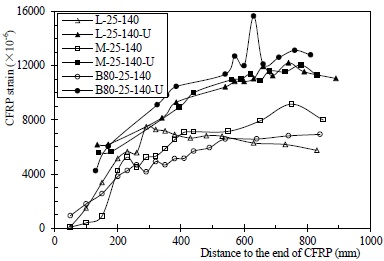
Tensile strain of flexural CFRP sheets at ultimate states.
Additionally, the flexural CFRP ruptured at a tensile strain lower than 12000με, which is far below the ultimate elongation of the material (17100με). As described above, blocks of concrete cover separated by flexural/shear cracks, and the weak interface could not deform collaboratively with the beam, which placed the flexural CFRP under a complex combination of tension, separated cover squeezing and U-strip confining and consequently resulted into the premature rupture.
CONCLUSION
Based on the experimental results in the current work, the following conclusions can be drawn:
- A weak interface resulting from defective bonding between new and old concrete is harmful to the CFRP strengthened beam; it can easily lead to premature intermediate debonding, which eventually develops into integral debonding of the flexural sheet under no lateral confinement.
- The shear transfer ability through the weak interface declines with interfacial weakening, which may facilitate local delamination. Even when the interface between new and old concrete has been carefully treated, intermediate delamination can still take place prior to yield of tensile reinforcement, which may impair the safety and serviceability of the strengthening system.
- Decline of the anti-debonding performance and more brittle failure can be expected when increasing amount of flexural CFRP is applied. Additionally, the width ratio of the bonded sheet to the concrete beam is shown to have a considerable weakening effect on debonding/delamination behavior due to the restraint contribution from the exterior concrete.
- Small cover depth leads to increased local damage due to combined delamination and debonding, and this additive weakening effect diminishes as the weak interface moving away from the bonded sheets.
- A cracking-induced weak interface causes minor damage when the crack penetration depth is small, but the situation becomes drastically worse as cracks expand.
- U-strip confinement effectively reduces the influence of a weak interface, whether it is caused by defective bonding or expansive cracking because it can prevent integral debonding of the flexural CFRP, guarantees the performance of the flexural sheets and maintains the structural performance of the strengthening system. However, local intermediate cover delamination cannot be avoided completely by U-strip confinement. This effect can readily lead to premature rupture of the flexural sheets and debonding of the U-strips. Therefore, it is recommended that the allowable flexural CFRP strain should be reduced and stricter confinement measures taken under such circumstances.
CONFLICT OF INTEREST
The authors confirm that this article content has no conflict of interest.
ACKNOWLEDGEMENTS
This work was financially supported by the National Science Foundation of China (51108400) and Natural Science Foundation of Shandong Province (No. ZR2013EEQ018).

