All published articles of this journal are available on ScienceDirect.

Deflection Behavior of Prestressed Concrete Beam using Fiber Reinforced Polymer (FRP) Tendon
Abstract
The application of prestressing steel is restricted in highly corrosive environment area. The behavior of structure changes due to corrosion of prestressing steel, which leads to reduction in strength and it may cause sudden failure. There are many research recommendations to resist corrosion of steel, however the durability of structure shall not be ensured during service life of structure. Fiber Reinforced Polymer (FRP) Tendon is considered as an alternate material due to its corrosive resistance property and high strength. An experimental and numerical analysis carried out to study the deflection behavior of FRP tendon prestressed beam and recommended design guidelines. There are four beam specimens casted and tested in laboratory and 51 experimental results collected from research article to carry out numerical study. The ACI, 2011 [1] recommended generalized deflection calculation for beam by softening the effective moment of inertia curve and also introduced the effect of shift of neutral axis once the member exceeds cracking stress of concrete. Based on experimental and numerical analysis study it is concluded that, the deflection behavior of FRP tendon beam depends on deformability of material, degree of prestressing and bond strength. Design chart proposed for calculation of effective moment of inertia and effective neutral axis distance with respect to deformability index. The error percentage of deflec-tion values as per ACI 2011, is about 10 to 20% has reduced to less than 5% in the proposed method.
1. INTRODUCTION
The research on FRP as an alternate material for steel was started during 1950. Initially the usage of FRP was restricted due to its lack of ductile behavior, production of non-consistent property and risk of health and environment contamination. Due to the further continuous research during the past decade, different types of chemicals treated FRP bars with acceptable market standard and international code requirements have developed. Currently, FRP bars are widely used in corrosive environment areas due to their non-corrosive, high strength to weight proportion and fatigue properties. Carbon fiber reinforced polymer bars (CFRP), Glass fiber reinforced polymer bars (GFRP) and Aramid bars are widely used in Underground Structure, Marine Structure and Bridges. American Concrete Institute-ACI 440 recommended material manufacturing and testing methods and design guidelines for the FRP bars.
Most of the long span structure need to control the deflection and member sizes. Prestressing of a member will facilitate to control the deflection and size of member. Generally, the deflection of member depends on stiffness of member and material properties. Prestressing force helps to balance the applied moment or alternatively increases the stiffness of member. The stiffness of member weakens due to cracks developed on the member, which leads to increase in deflection in a faster rate than un-cracked section. Hence, the detailed studies of deflection behavior of prestressing member were included below.
2. DEFLECTION
Many researchers carried out study on deflection behavior of structural member using prestressed bars. Branson, 1968 [2] derived a deflection equation by considering the moment curvature behavior of a beam. The effect of moment curvature is linear until concrete sustains tensile stresses (fst). The moment of resistance of member upto the first crack is termed as cracking moment (Mcr). The linear nature of moment curvature shall extend Fig. (1), when the member is subjected to prestressing force. Alternatively concrete will start receiving tensile stress only after applied moment balances prestressing forces (P) on the member. When the applied moment Ma is more than Mcr (Pe+fstz-Mselfwt) then concrete attains permissible stresses and start cracking on the flexural tension side of member, hence the moment curvature behaves non-linearly. Further increase of applied moment will lead to move the curve linearly up to failure.
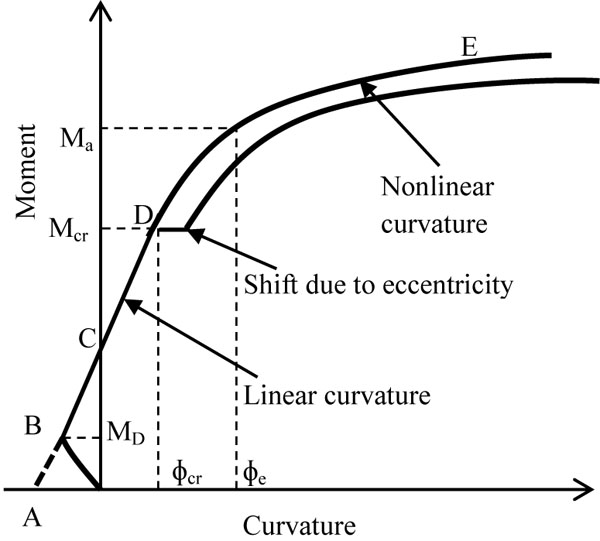
Moment vs curvature of prestressed concrete member.
Point A as shown in Fig. (1) is an imaginary point which extends from the linear curvature. At point B, the effect of prestressing forces balances the moment due to self-weight of member (Mselfwt).
The moment curvature ɸ of member behaves linearly up to point D.
 |
(1) |
The effect of curvature is related to the EcIg uncracked stiffness of member. The curvature is linear up to (Ma-Pe)<=Mcr=fstZ. where fst - Tensile strength of concrete, Z - Section modulus of member, P - Effective prestressing force, e - Eccentricity of prestressing with respect to neutral axis of member, Ec - Young’s modulus of concrete and Ig- Gross moment of inertia of member.
At point E, the member attains ultimate stage and moment curvature becomes linearly varying.
 |
(2) |
The effect of curvature is related to the EcIcr cracked stiffness of member at ultimate load. Where Icr is Cracked moment of inertia of member.
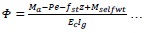
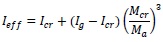
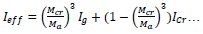
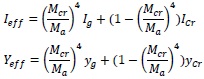
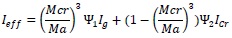
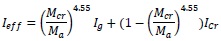
At stage D to E, the moment curvature is non- linear, and the pattern of moment of inertia as shown in Fig. (2) changes from Ig to Icr with respect to (Mcr/Ma) ratio. Branson, 1968 assumed these variations as non -linear cubic power curve, and derived an equation for finding effective moment of inertia (Ieff).
Effective moment of inertia curve.
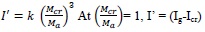 |
Hence constant k= (Ig-Icr)
 |
 |
(3) |
Branson & Trost, 1982 and Tadros, Ghali & Meyer, 1985 [3, 4] predicted that prestressing eccentricity is increasing due to shift of neutral axis during its cracking stage as shown in Fig. (3). The effect of neutral axis shift is non-linear due to the tension stiffening effect of concrete and prestressing. This leads to an increase in prestressing moment which reduces the deflection rate of increases.
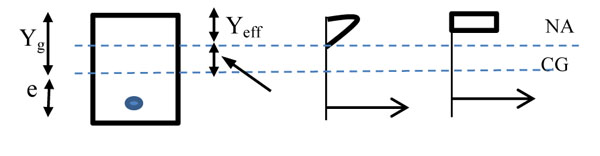
Eccentricity shift.
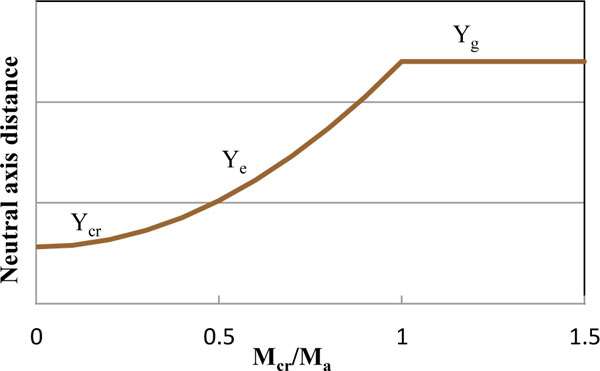
Neutral axis distance curve.
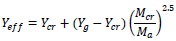
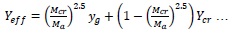
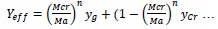
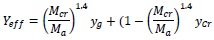
The pattern of neutral axis distance changes from Yg to Ycr with respect to (Mcr/Ma) ratio as shown in Fig. (4). Where Yg is a neutral axis distance from extreme compression fiber of beam until first crack occurs and Ycr is neutral axis distance at ultimate stage. Branson, 1968 assumed the non-linear patten of curve as 2.5 power curves, and derived an equation for effective neutral axis distance (Yeff) in cracking stage for the prestressing beam using steel tendon.
 |
At  = 1, Constant k = (Yg - Ycr)
i.e., Ycr = Neutral axis depth
 |
 |
(4) |
3. DEFLECTION MODEL FOR THE FRP PRESTRESSING MEMBER
Y. Tan, W. Xue, 2012 and Constantinos B. Demakos, Constantinos C. Repapis and Dimitrios Driva, 2008 [5, 6] stated that, the following parameters influence the deflection behavior of prestressed beam using FRP Tendon.
- Deformability behavior of prestressing bar.
- Degree of prestressing.
- Effect of shift of neutral axis during cracking stage.
- Bond strength shall be of fully bonded, partially bonded and un-bonded.
- Modulus of rupture of concrete.
- Modulus of elasticity of concrete.
- Modulus of elasticity of FRP bar.
- Influence of creep and shrinkage.
The effect of influence of above parameters leads to more shift of linear curve of deflection (shift of point D refer Fig. 1), shift of occurrence of cracked moment of inertia of member at ultimate stage (Shift of Point E refer Fig. 1) and the change of nonlinear curve of deflection between the un-cracked stage to cracked stage. Branson proposed simplified model which includes an influence of all the above parameters. The deflection errors by Branson, 1968 deflection model are converging to experimental results by adopting the transformation of value of effective moment of inertia as cubic power parabolic curve with respect to Mcr/Ma.
A. Abdelrahman, G. Tadros, 1995 and S.H Rizkalla, 1999 [7-9] studied the deflection behavior of prestressed concrete beam using CFRP Tendon. They predicted that, shift of Neutral axis distance (Yeff) with respect to Mcr/Ma are slower than steel tendon. It means the eccentricity (e) is increasing at a slower rate with respect to Mcr/Ma than steel tendon. So they considered the shift of neutral axis distance curve as square power curve with respect to Mcr/Ma ratio. The deflection values calculated using these concepts are 70% to 85% accuracy to the experimental results.
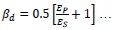
ACI 440-4R -04, 2011 recommended to soften the moment of inertia values by introducing the additional factor βd considering the non-ductile behavior of FRP bar, because the application of Branson, 1968 equation is valid for calculation of effective moment of inertia of steel tendon.
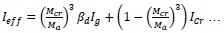 |
(5) |
 |
(6) |
If EP = ES, then βd. = (0.5*(1+1) = 1 which is similar to steel tendon Ieff equation.
ACI recommended proportionate factor βd for FRP tendon with respect to steel tendon property by introducing the ratio of Young’s modulus of FRP (Ep) to Young’s modulus of steel (Es) (refer equation 6). The deflection values are calculated using these concepts is 80% to 95% accuracy to the experimental results. The errors in deflection by ACI method are due to deformability behavior of particular type of FRP tendon to ductile behavior of steel tendon is not constant. Even the deformability behavior of particular type of FRP bar is varying with respect to the degree of prestressing and modulus of rupture of concrete. Hence this rational approach of introducing softening factor in moment of inertia does not carry any technical justification for calculating the deflection, because the failure pattern of FRP tendon is by deformability and rupture of bar, but not by the steel being ductile. This approach is completely irrelevant when partial prestressing with non prestressing steel or FRP bar is used.
Branson, 1968 Ieff & Yeff curve approach for calculating effective moment of inertia and shift of eccentricity is reasonable, because whatever factor impacts irrespective of tension stiffening effects on the member, the pattern of curve between un-cracked to cracked stage maintains a similar path. Hence Tadros, Ghali and Meyer, 1985 proposed a new deflection model for beam using FRP tendon by softening the curve to four power curves and generalized the equation.
 |
Toutanji and saafi, 1999 [10] proposed a new model for the GFRP reinforced member.
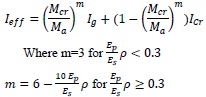 |
Where ρ is a reinforcement ratio.
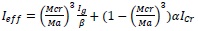
Raed Al-Sunna1, Kypros Pilakoutas, Peter Waldron and Tareq Al-Hadee, 2006 [11] proposed a modified equation for the effective moment of inertia by considering the reinforcement ratio and bond strength. They introduced two additional rational parameters α & β to soften the moment of inertia.
 |
S. Khalfalla, 2009 [12] also proposed two additional rational parameters Ψ1 & Ψ2 to soften the moment of inertia.
 |
4. DEFORMABILITY
P. Zou, 2003 and G.J. Mitolidis, T.N. Salonikios and A.J. Kappos, 2008 [13, 14] stated that, FRP tendon is a non-ductile material and the deflection behavior during its cracking stage has relying on deformability behavior of FRP material. The deflection of prestressed FRP beam follows the bilinear path. It consists of a linear curve upto prestressing strain and then bilinear curve for the balance strain available after prestressing strain, hence this bilinear effect influences the deflection curve pattern of the beam during cracking stage.
A. Abdelrahman, 1995 compared the deflection of beams for the same percentage of CFRP tendon area by varying degree of prestressing. Test results as shown in Fig. (5) reveal that, the pattern of deflection curve between uncracked to cracked stage is changing with respect to degree of prestressing. Further, it shows that 50% degree of prestressed beams performs better deformation than 70% degree of prestressed beams. The initial moment of resistance of beam up to uncracked stage is higher for 70% prestresssed beam but further converging in a faster rate leads to an ultimate moment of resistance more or less same as 50% degree of prestressed beam.
N. Grace, E. Jensen, V. Matsagar, and P. Penjendra, 2013 [15] observed that, the FRP tendon beam is better deformability behavior for the low degree of prestressed beams than high degree of prestressed beam.
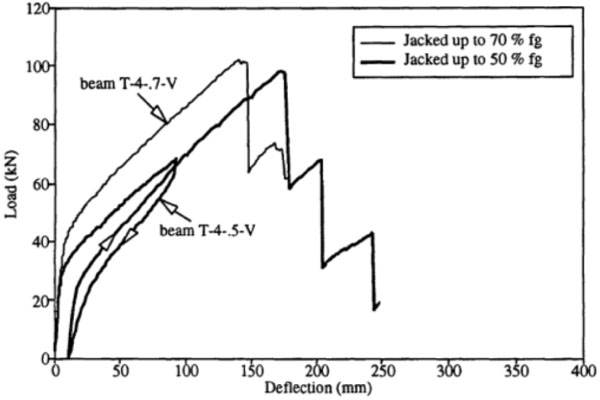
Abdelrahman study of deflection of 50% & 70% degree of prestressing.
Abdelrahman, 1995 stated that FRP beam deformability shall be calculated by the ratio of deflection of beam considering as un-cracked stiffness at a load equal to ultimate load and to the deflection due to ultimate load considering the cracked stiffness.
Dolan and Burke, 1996, and Chad, 2001 [16, 17] proposed a simplified method for calculating deformability by strain approach. ACI 440-4R, 2011 amended their strain approach. The deformability of FRP prestressed beam shall be measured in terms of deformability index. It shall be defined as ratio of ultimate stain (εpu) to the stain at service stage (εps) with the slight modification due to difference in neutral axis of elastic and inelastic behavior.
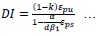 |
(7) |
Where 
Where k is ratio of neutral axis depth to effective depth, β1 is stress block factor for concrete, ρ is reinforcement ratio, d is effective depth to the FRP tendon, fpu is ultimate tensile strength of FRP tendon and f'c is compressive strength of concrete.
5. MATHEMATICAL MODEL
The literature study as narrated above by various researchers explicit that, FRP beam deflection model needs modification to match with experimental results. The following conclusion shall be made for the proposed new mathematical deflection model by considering their research recommendation for the deflection calculations.
- Pattern of curve of Ieff & Yeff are not an irregular variations with respect to Mcr/Ma and it resembles the same pattern of curve even by considering the influence of many parameters. The pattern of curve resembling parabolic curve with power of m & n.
- The deflection values are influenced by deformability behavior of FRP tendon and Bond strength between concrete and FRP tendon.
So in order to simplify this approach, a new mathematical deflection model is proposed by Numerical methods and it is validated with experimental results.
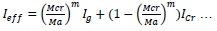 |
(8) |
 |
(9) |
Power of curves m & n values are related to the deformability and bond strength of FRP tendon. The deformability of FRP bars is related to the degree of prestressing and strain ratio at ultimate and service state of beam member.
6. NUMERICAL ANALYSIS
There are 51 numbers of experimental data as shown in Table 1, which contain an influence of various possible parameters considered for the numerical analysis. The deflection pattern of experimental results compared with assumed trial pattern as per proposed deflection model and then least square errors calculated. The optimum value of parameter m & n arrived by Lagrange Dual function convex optimization method. Design chart and equation are proposed to calculate the deflection of simply supported beam using FRP Tendon.
Experimental works are carried out at research laboratories to validate the numerical analysis output. Four numbers of simply supported beam using Carbon fiber reinforced polymer (CFRP) Tendon casted and tested at Annamalai University Structural Engineering Research laboratory, India.
6.1. Selection of Experimental Results for Numerical Study
The influence of various possible parameters as stated in clause 3 considered for the selection of experimental results. The proposed numerical analysis models considered for prestressed tendon bar with no additional non prestressed reinforcements. The fully bonded prestressed FRP beam experimental results are only considered for the numerical analysis.
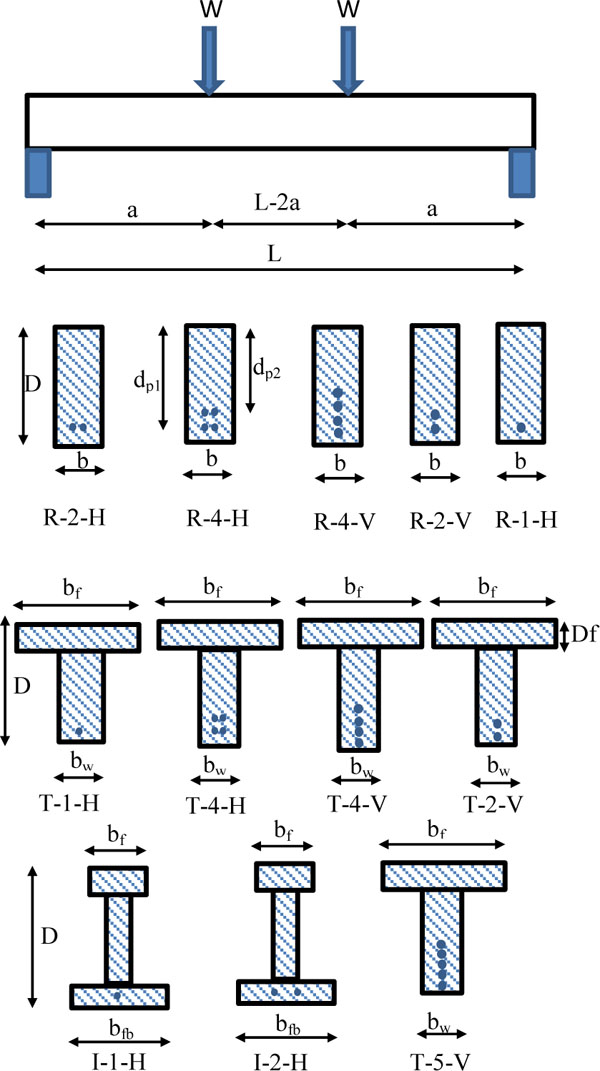
6.1.1. Beam Configuration
The beam span considered for the samples are varying from 2m to 10m and the beam shape includes rectangular, flanged T and I sections. Size of rectangular beams varies from 102mm to 200mm x 250mm to 550mm and the T & I beam flange width varies from 200 to 1220mm. Simply supported beam with two point or single point load test results are only considered for the sample selection.
6.1.2. Configuration of FRP Tendon Arrangement
Ttwelve types of beam configurations are considered based on the position & number of prestressing bars and shape of beam member as shown in Fig. (6). The Term R-2-H as stated in the Fig. (6) defines the shape of beam either Rectangular(R) or T beam (T) or I beam (I) and second term defines the number of prestressed bars and the third term defines the position of bar either Vertical (V) or Horizontal (H).
6.1.3. Material
The material properties considered for the samples include concrete compressive strength of 40MPa to 70 MPa, Young’s modulus of 28 GPa to 41 GPa, tensile strength of 2.75 MPa to 6.3 MPa and FRP bar properties include of Young’s modulus in the range of 50 GPa (GFRP Tendon) to 147 GPa (CFRP Tendon) and tensile strength of bar from 1200 MPa to 2700 MPa.
6.1.4. Prestressing Tendon
Degree of prestressing values of 23% to 70% are considered for selection of experimental results. The reinforcement ratio of section with balanced reinforcement is considered in the range of 0.09 to 1 and Tendon reinforcement percentage considered in the range of 0.04% to 0.52%. Straight tendon and harped tendon effects are also considered for numerical study.
6.2. Lagrange Dual Function Convex Optimization
There are 51 samples shown in Table 1 which are considered for arriving optimal values of m & n based on Lagrange dual function convex optimization method by varying the deformability index value. Deflection is calculated for every load increment of each sample by varying the m & n with all possible combinations. The lowest least square error corresponds to m & n is considered as proposed value for calculating deflections.
Experimental results from various researchers.
| SL No | Author [Reference number] | No of Samples | Year | Remarks |
|---|---|---|---|---|
| 1 | Abdelraman | 6 | 1995 | |
| 2 | Adorjan borosnyoi [18-20] | 5 | 2002 | |
| 3 | Bjorgvin Smari Jonsson [21] | 3 | 2011 | |
| 4 | Burke, Charles W. Dolan and H.R. Hamilton III [22] | 5 | 2001 | |
| 5 | Derek Swanson, Charles W. Dolan and H.R. Hamilton III [23, 24] | 3 | 2002 | |
| 6 | Hugues M. Vogel [25, 26] | 6 | 2011 | |
| 7 | Mohammad Reza Saiedi [27] | 5 | 2009 | |
| 8 | Sindri Hlifar Guomundsson [28] | 4 | 2012 | |
| 9 | H. C. Mertol1, S. Rizkalla, P. Scott, J. M. Lees, R. El-Hacha [29] | 8 | 2006 | |
| 10 | M. Arockiasamy [30] | 4 | 1995 | |
| 11 | Y J Kim [31] | 2 | 2010 | |
| Total | 51 |
Beam configuration.
Minimization problem considered is:
Minimization Z ((Max (Δe-Δp )2 + (Min (Δe-Δp )2)
Where the constraints are:
f(x) = Ieff (Ig, Icr, εpu,εps, Yeff, fc, Ec & fst) for m= 2.5 to 6
g(x)= Yeff (Yg, Ycr, Yeff, εpu,εps, fc, Ec & fst) for n= 1 to 3.
Where Δe is Deflection from experimental results and Δp is deflection of proposed method for the various possible m & n values.
Mid span deflection for the two point loading & straight tendon are
Δ = Deflection under loading (Δ1)-Deflection due to self -weight and prestressing forces Δ2
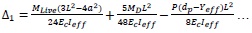 |
(10) |
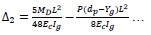 |
(11) |
Where, MLive is applied moment due to live load, MD is Moment due to self-weight, L is effective span of beam and dp is Effective depth of prestressing bar.
6.2.1. Deflection for Sample 1 (T-4-V)
The sample from Abdelrahman, 1995 experimental results of T-4-0.7-V selected to demonstrate for calculation of optimum m & n value by numerical method. The power value of m & n varied at an interval of 0.1 and the deflections calculated for each possible combination of m & n values. There are 231 trials of deflection model calculated for each load increment of particular sample and the errors of each trial with respect to experimental results were tabulated. The deflection values calculated by numerical method are either higher or lesser than the experimental results for each increment of load, hence the errors are measured by least square error and calculated for each trial by squaring maximum and minimum errors.
In order to study the convergence of lowest least square error solution, a graph is plotted for all the calculated least square error values with the possible combination of m & n value. Fig. (7) shows the graph for sample 1. The values of least square error are converging between the m values of 4 to 5 for all the possible n values and then start increasing. There are many local optimal solutions with respect to n values. The convex convergence of curve for the value of n is in between 1.4 to 1.8 which provides optimal solutions.
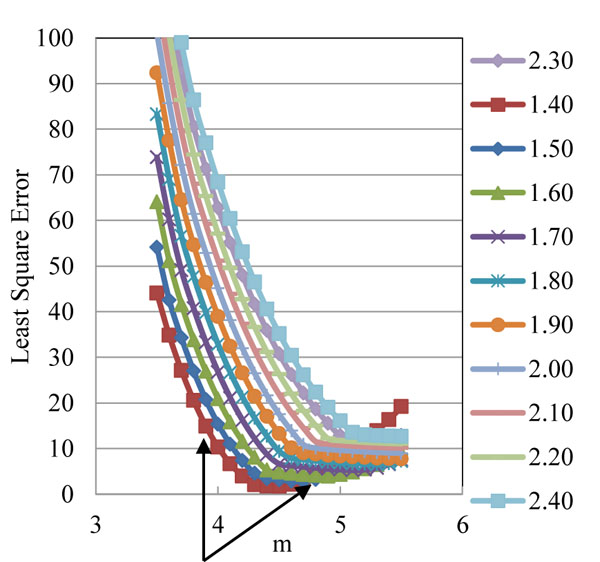
Least square error convergence for sample 1.
6.2.2. Lower Bound Solutions
Prediction of optimal solutions for m & n values will benefit to generalize the deflection equation considering all possible influence parameters. Hence, the lowest boundary of least square solutions profile as shown in Fig. (7) is separated from the source trails and lower bound convergence curve is plotted for m+n vs corresponding least square error values. The Curve shown in Fig. (8) shows the convergence pattern of least square errors with respect to m + n value. Average least square error values are calculated in the convergence region as shown in Fig. (8) and interpolate the m & n value corresponds to the average least square error value.
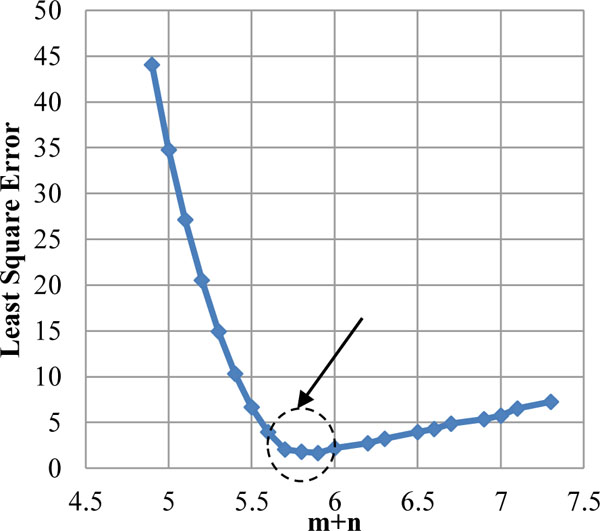
Lower bound value – Sample 1 (T-4-V).
The prestressed CFRP beam deflections of proposed method compared with experimental results and ACI method are shown in Fig. (9). It reveals that, the deflection of beam by ACI method is underestimating the actual experimental deflection value. Maximum Least square error by ACI method is 167 against proposed method error value of 2. Hence, the generalized ACI approach is not applicable for all conditions of FRP prestressed beams. Abdelrahman, 1995 study as shown in Fig. (5) demonstrates that, the deflection pattern is changing for the same percentage of reinforcement by varying degree of prestressing, hence the consideration of m=3 and n=2 as per ACI 2011 method will lead to erroneous deflection as compared to experimental results.
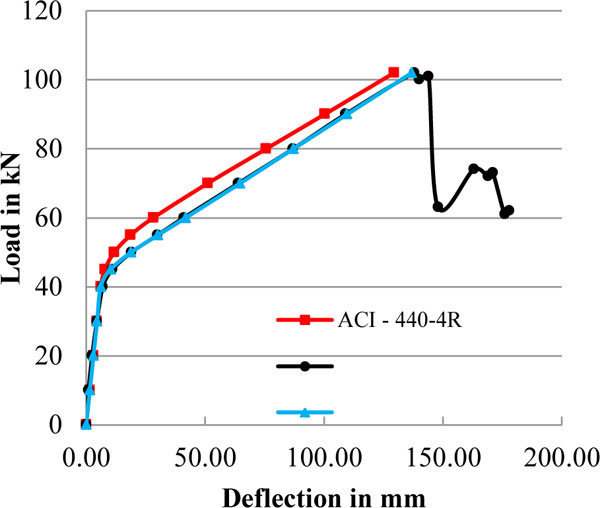
Load Deflection curve for sample 1 (T-4-V).
6.2.3. Effective Moment of Inertia (Ieff)
Effective Moment of Inertia of sample 1 as per proposed method is smoother curve than ACI method as shown in Fig. (10), because the shift of deflection is faster in low deformability index value as most of the strain is utilized for prestressing and the balance available strain only used to deform. The curve as per proposed method for the deformability index value of 1.54 is 4.55 power curve in place of 3 power curve is proposed in ACI 2011 method. There is no rational parameter like softening of equation (βd) considered for calculation of moment of inertia.
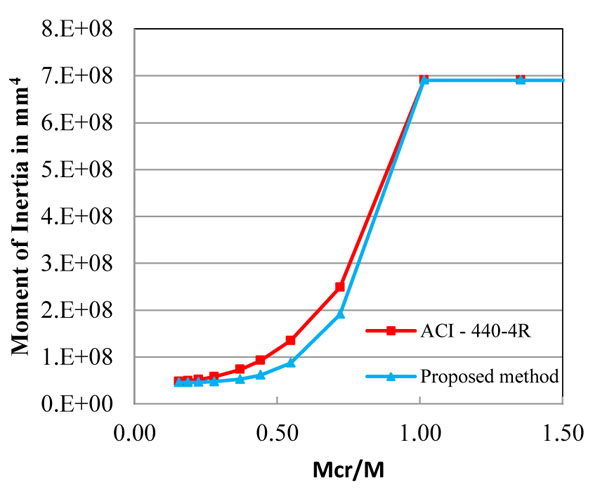
Effective moment of inertia for sample 1 (T-4-V) for the DI = 1.54 & proposed m = 4.55.
 |
6.2.4. Shift of Neutral Axis Distance (Yeff)
Shifts of neutral axis is slower phase as compared to ACI, 2011 method as shown in Fig. (11). The rate of shift of neutral axis is slower due to the high degree of prestressing leading to high tension stiffening of member at the tension zone. This effect is reverse when low degree of prestressing member is adopted.
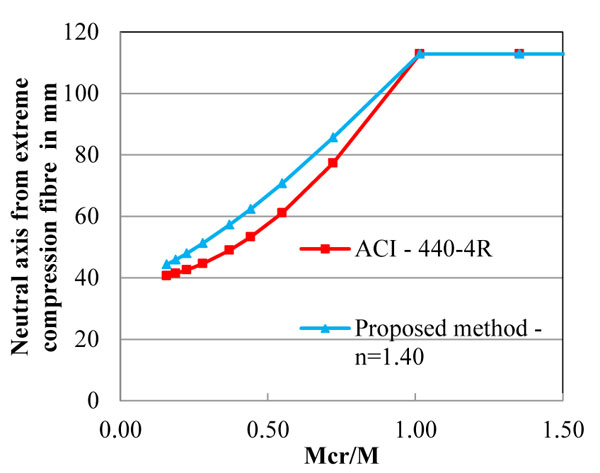
Shift of Moment of inertia for sample 1- (T-4-V) for the DI = 1.54 & Proposed n = 1.40.
The selected sample 1 has less deformability behavior due to 70 % degree of prestressing, hence the shift of neutral axis fully relies on prestressed force and not on deformable behavior of FRP bars. The cracks of high prestressed beam penetrate faster than low degree of prestressed beam. The shift of neutral axis distance for the deformability index value of 1.54 and n = 1.4 power curve is given as:
 |
6.3. Proposed m & n Values
The Lagrange dual function convex optimization as discussed in the previous clause is adopted for all 51 samples and predicted the optimum m & n for the various deformability index values. A graph plotted for all the optimal values of m & n is shown in Fig. (12) and indicated as dotted points with respect to deformability index values. The best fit m & n curve is plotted with respect to most coincidence dot points values to generalize the pattern.
Proposed design chart as shown in Fig. (12) shall be used for selection of m & n for fully bonded with FRP tendon prestressed concrete beam with respect to deformability index value of member. The least square error for the proposed deflection model is less than the ACI, 2011 Deflection model.
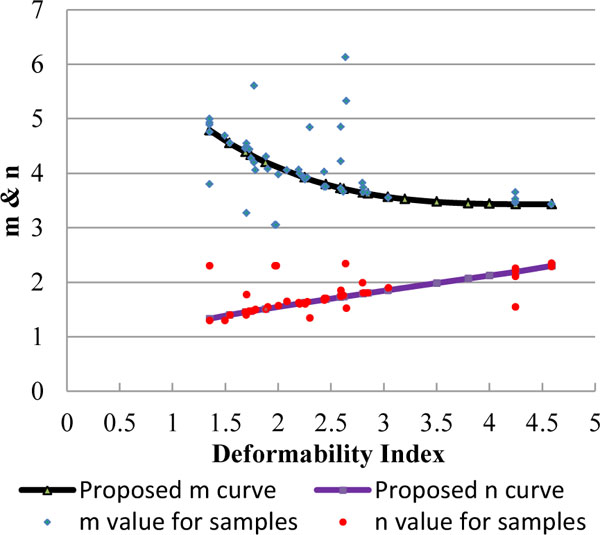
Design chart for optimized m & n value.
The best fit curve for ‘m’ is 3.15 power curve, so the value of m shall also be calculated by equation 12 for the value of deformability index within the range of 1.35 to 4.59. The value of m is higher at lower deformability index, because high degree of prestressing leads to less value of balance strain (εm = εpu-εps) to deform. Due to the less balance strain the effective moment of inertia shift is faster which leads to increase in deflection faster and reaches the total deflection earlier than beams of high deformability index value. The value of m is varying from 3.43 to 4.79 with respect to the deformability index value of 1.35 to 4.59.
| m = 3.43+0.0335 (4.59-DI)3.15 | (12) |
The best fit curve for ‘n’ is 0.92 power curve, so the value of n shall also be calculated by equation 13 for the deformability index value within the range of 1.35 to 4.59. The value of n is high at high deformability index value which leads to shift of neutral axis in a faster rate due to lack of stiffening effect & low prestressing values.
| n= 1.33+0.323(DI-1.35)0.92 | (13) |
The deflection errors for the proposed method are within 5 % as compared to 20 % by ACI method. The errors by ACI methods are more when the deformability index is low, further the convergence of errors are less than 10% for the high deformability index values. The proposed deflection calculation method is based on the deformability index and it is calculated based on the ratio of strain at ultimate stage (εpu) to the strain at prestressing stage (εps). The effect of balance strain (εm = εpu-εps) decides the deformability nature of beam. Hence, the deflection calculation by the proposed method is realistic strain approach, wherein ACI method suggested rational approach. Proposed numerical methods for finding the deflection are near to true solutions for any loading stage as compared to ACI method, 2011.
7. EXPERIMENTAL METHOD
Experimental test carried out to validate the proposed design charts and equation for the deflection of FRP prestressed beams. Four beams were casted and tested by varying the deformability index values.
7.1. Test Specimen and Setup
The rectangular beam specimen of size 150mm x 250mm and length of 3100mm casted with PVC void former and then, after initial setting of concrete the PVC tube removed. The Carbon fiber reinforced polymer (CFRP) tendon used as a post tension FRP rod. Fig. (13) shows the various beam specimens configuration adopted for experimental works. The term CFB1-2-H-0.5 means “CFRP Tendon specimen number - Number of Tendon - tendon positioned Horizontally (H) or Vertically (V) and the last term is Degree of prestressing in fraction. There are four specimens casted in which two specimens are with one number of 9.5mm dia CFRP tendon and balance two with two numbers of 9.5mm dia CFRP tendon positioned horizontally and vertically. The degree of prestressing varied from 35% to 70%.
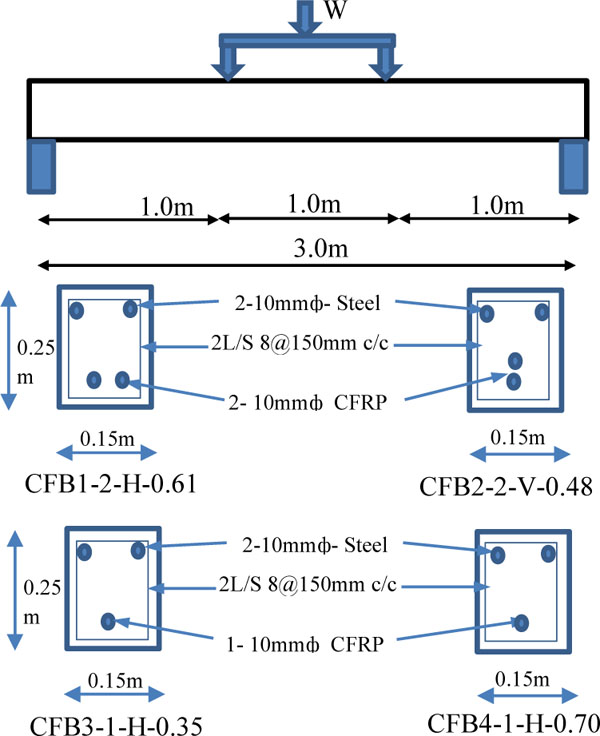
Beam configurations - experimental works.
The beam member was designed as tension controlled member. The top reinforcement provided as hanger bar to support shear links. Shear links were designed in such a way that shear failure should not occur during test. Simply supported beam with two points loading of an equal distance of one meter is applied on the beam member.
7.2. Material Property
High strength concrete of grade C40/50 is considered for mix design and the compressive & tensile strength of the same is confirmed by trial mix test results. Further, additional cube/cylinder is prepared during casting of beam specimen and tested during the experimental test of beam members. The average test results of concrete are shown in Table 2.
Concrete test results.
| Age in Days | Average Cube Compressive Strength MPa | Average Tensile Strength MPa | Youngs Modulus Mpa | Remarks |
|---|---|---|---|---|
| 7 | 50.8 | 3.4 | 3.77 x10⁴ | |
| 28 | 61.3 | 4.56 | 3.86 x 10⁴ |
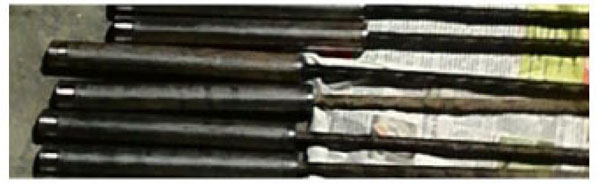
Steel of grage Fe 500 MPa is used for shear links. CFRP bar shown in Fig. (14) used as post tensioning tendon supplied by Dextra PVT Ltd Honghong, China. The properties of the materials are tabulated in Table 3.
Property of CFRP tendon & steel reinforcement.
| SL No | Tensile Strength in MPa | Youngs Modulus in Mpa | Stain | Poisons Ratio | Remarks |
|---|---|---|---|---|---|
| 1 | 1 896 | 1.24 x10⁵ | 0.0153 | 0.27 | CFRP |
| 2 | 500 | 2.00x 10⁵ | 0.0025 | 0.30 | StSteel |
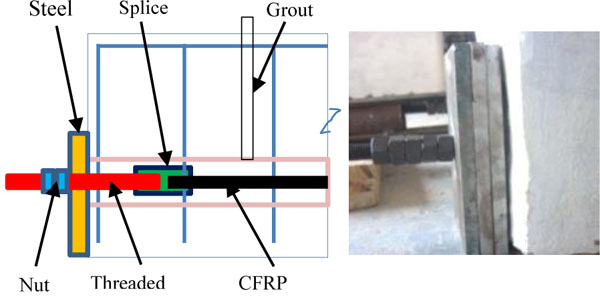
CFRP Tendon with splice coupler.
7.3. Prestressing of CFRP Tendon
Hydraulic jack of 10T capacity is used for stressing the 9.5mm dia CFRP tendon. Special measures are considered for both ends of beam specimen for the effective anchorage of tendon. Steel plates of size 100mm x 150mm and 24mm thickness are used at both ends of the beam. The CFRP Tendon connected with threaded studs on both sides is used to lock the stress by nuts as shown in Fig. (15).
Beam anchorage end details.
The effective prestressing force of tendon is achieved by controlling the elongation of tendon during stressing. Elongation δ =PL/(APEp) = δ1+ δ2+ δ3 where δ1 & δ3 is elongation of high strength stud and δ2 is elongation of CFRP Tendon. Cement grout is injected through grout tube immediately after the stressing of tendon. The specimen is allowed for 3 days of curing for the grout. Elongation due to prestressing loss measured before start of testing. Net elongation calculated after deducting the losses. Table 4 shows the effective prestressing force and corresponding elongation achieved during prestressing.
Prestressing force.
| Beam Type | Elongation- mm | Effective Stressing Force KN | Deformability Index (DI) | Remarks | |
|---|---|---|---|---|---|
| δ2 | Due to Loss of Stressing | ||||
| CFB1-2 -H-0.61 | 30 | 3 | 164.8 | 1.83 | |
| CFB2-2 -V-0.48 | 24 | 2.75 | 129.7 | 2.36 | |
| CFB3-1 -H-0.35 | 18 | 2.4 | 47.5 | 2.88 | |
| CFB4-1 -H-0.70 | 34 | 3 | 94.5 | 1.58 | |
7.4. Beam Specimen Testing
A test frame capacity of 50T was used to test the beam. Load cell used to measure the applied load on beam. Three dial gauges installed bottom of beam at mid span and 500mm from left and right side as shown in Fig. (16) to measure the deflections during testing. A Demec gauge was used to measure the strain at surface of beam 50mm from top and bottom in the mid span zone of 1m. The beams were loaded at an increment of 5kN upto first crack and then reduced to 2.5kN during cracking stage. Deflections were recorded at each load increment. Crack meter were used to measure the crack width for each increment of load.
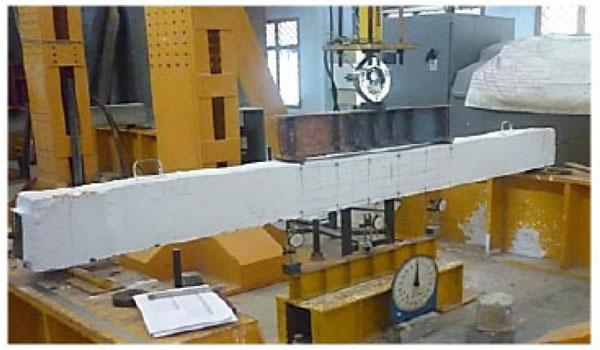
Experimental test setup.
7.5. Experimental Test Results and Discussion
The flexural behavior of tested specimen is compared with ACI method as shown in Table 5. The Moment of resistance at first cracked stage is slightly higher than the theoretical calculations by ACI method. Hence, it shows that the effectiveness of prestressing of tendon & concrete strength of beam are achieved as per design. The moment of resistance at ultimate stage of beams by experimental values is slightly lower than the calculated value. However, these deviation shall be accounted by multiplying moment reduction factor of 0.85 in theoretical calculation as stated in ACI, 2011. This approach will aid to achieve the effective design of beam using prestressed CFRP tendon.
Moment of resistence.
| BeBeam Type | Mcr kN-m | Mr kN-m | Remarks | ||
|---|---|---|---|---|---|
| ACI Method | Experimental | ACI Method | Experimental | ||
| CFB1-2 -H-0.61 | 21.8 | 22.5 | 45.8 | 44.45 | |
| CFB2-2 -V-0.48 | 18.2 | 17.5 | 44.1 | 43.5 | |
| CFB3-1 -H-0.35 | 10.6 | 11.25 | 25.8 | 25.1 | |
| CFB4-1 -H-0.70 | 16.0 | 16.5 | 25.2 | 25.2 | |
The deflection test results of a beam in relation with deformability index were assessed. The CFRP tendon has lesser value of ultimate deflection for the high degree of prestressed beam than low degree of prestressed beam (refer Fig. 18). The crack patterns of tested CFRP specimen are illustrated in Fig. (17). Cracks are mostly developed in the pure bending zone due to the application of two point loadings. The definite crack pattern, width and spacing at bottom of beam show that these beams were failed by rupture of CFRP tendon. The mode of failure of beams leads to tension failure. The crack spacing approximately of 250mm shows that tension stiffening of beams is effective due to proper aggregate interlocking and effectiveness of prestressing of tendon. The first crack developed near to middle of support and then extended towards neutral axis. There was no sign of shear cracks on beam near support, because the beam is designed to resist shear failure.
Fig. (19) & Table 6 show that the deflection pattern of 70% degree of prestressed member fails in lesser deflection value than the 35% degree of prestressed member. The beam CFB4-1H-0.70 deflection pattern reveals that, 70% of CFRP bar strength is utilized for prestressing and the remaining 30% is only utilized for deflection of beam during its cracking stage, so it leads to less deflection than the 35% degree of prestressed beam. High degree of prestressed beams provide better uncracked moment of resistence than low degree of prestressed beam, however the ultimate moment of resistance is almost the same for both cases. Similarly Fig. (20) and Table 6 show that 61% degree of prestressed member fails in lesser deflection than 48% degree of prestressed member. Hence, we can conclude that, the changes of deflection pattern are with respect to degree of prestressing and deformability index value.
Deflection.
| Beam Type | Deformability Index | Deflection at Ultimate Load in mm | Remarks | ||
|---|---|---|---|---|---|
| Experimental | ACI Method | Proposed Method | |||
| CFB1-2 -H-0.61 | 1.83 | 39 | 31.9 | 37.1 | |
| CFB2-2 -V-0.48 | 2.36 | 44 | 40.2 | 43.9 | |
| CFB3-1 -H-0.35 | 2.88 | 34.80 | 30.95 | 36.5 | |
| CFB4-1 -H-0.70 | 1.58 | 22.0 | 11.8 | 21.2 | |
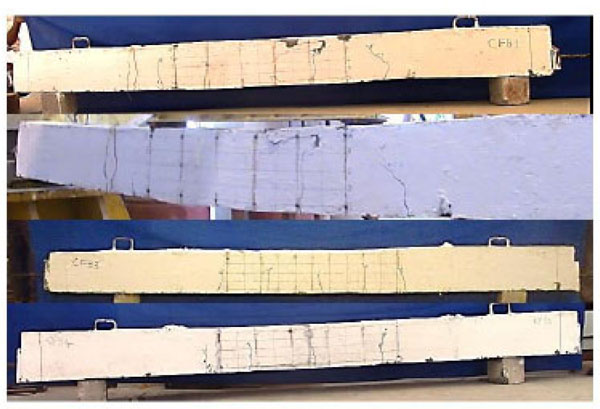
Crack pattern of beam: (a) CFB1-2-H-0.61, (b) CFB2-2-V-0.48, (c) CFB3-1-H-0.35, (d) CFB4-1-H-0.70.
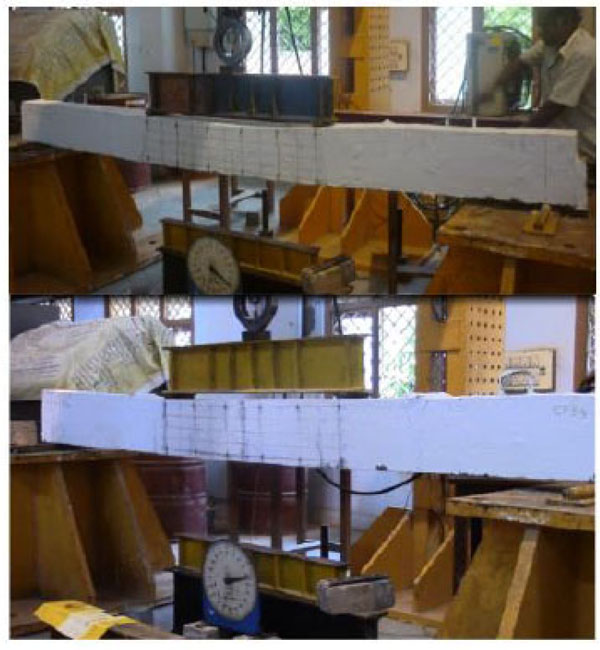
Deflection at ultimate stage: (a) CFB3-1-H-035, (b) CFB4-1-H-0.70.
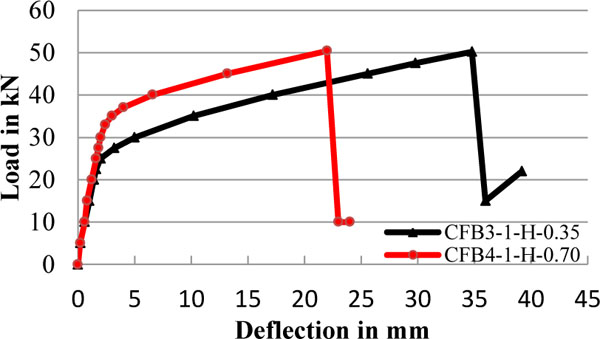
Load vs. Deflection curve for 35% & 70% of degree of prestressing.
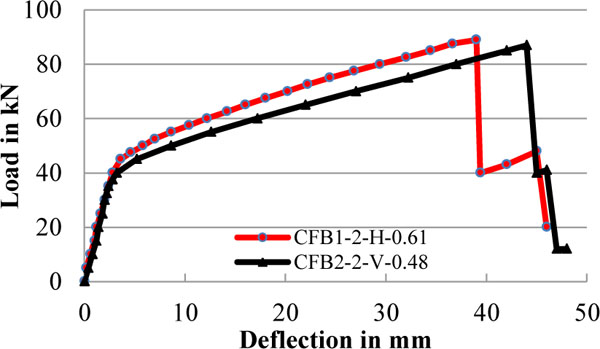
Load vs deflection curve for 48% & 61% of degree of prestressing.
8. COMPARISON
Experimental results of four beams were compared with the proposed Numerical model and ACI-Abdelrahman deflection model. Fig. (22) & Table 6 show that the deflection values of member by ACI method, 2011 is close to the experimental results for the high deformability index value due to the more quantum of strength of CFRP bar available to deform and it behaves more or less same as steel tendon in proportion with Young’s modulus of materials. Fig. (21) & Table 6 show that, ACI method is deviating away from experimental results when low deformability index value of member due to less quantum of strength of CFRP bar is available to deform. ACI predicts 11.8mm deflection for the beam CFB1-1-H-0.70, but the actual deflection by experimental is more than the anticipated value which leads to under estimating of actual deflection value of member.
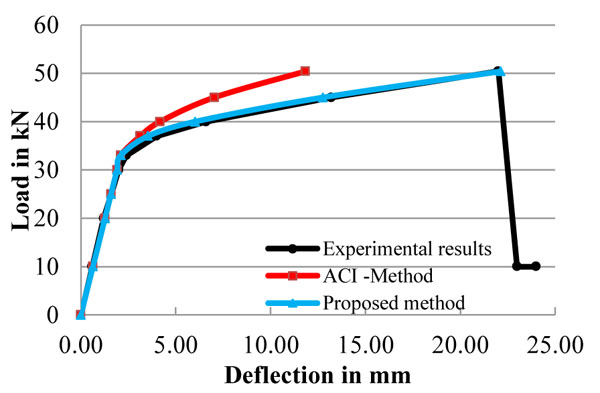
Comparison of Load vs Deflection curve for the Deform-ability Index value of 1.35.
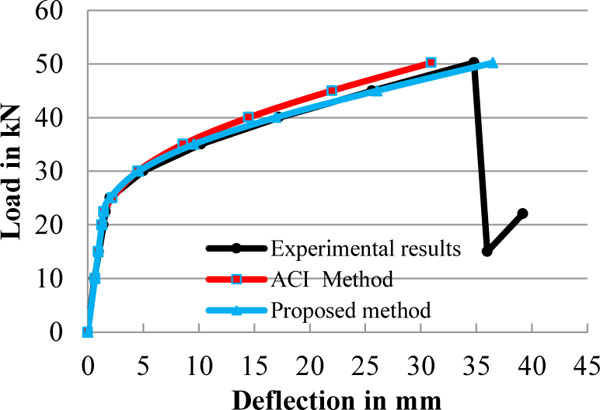
Comparison of Load vs Deflection curve for the Deform-ability Index value of 2.88.
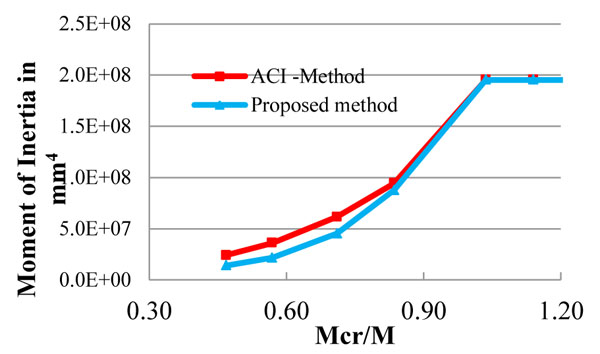
Comparison of effective moment of inertia for the De-formability Index value of 1.35.
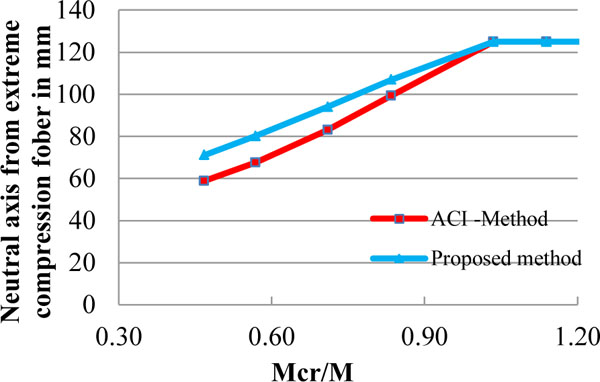
Comparison of effective neutral axis distance for the Deformability Index value of 1.35.
Proposed numerical model coincides with experimental results due to its deriving deflection curve with respect to strain ratio of member at ultimate stage to first crack stage. The ACI method follows the similar approach irrespective to the degree of prestressing & strain of member at ultimate and first crack stage. The moment of resistance of member using CFRP tendon at ultimate stage is approximately same irrespective to the degree of prestressing of member which leads to change of deflection curve with respect to degree of prestressing. Hence the change of deflection curve is with respect to deformability nature of CFRP tendon. In this proposed method, the pattern of deflection curve changes during its cracking stage with respect to the degree of prestressing accounted.
Effective moment of inertia curve with respect to Mcr/Ma for the beam member CFB4-1-H-0.70 as shown in Fig. (23) is lowering steeper than the ACI method due to the pattern of crack penetrates faster than low degree of prestressed member and leads to lowering the moment of inertia of member. ACI, 2011 also assumes the same however the rate of reduction of effective moment of inertia is faster for the low deformability index value of member.
The shift of eccentricity is a slower phase than the ACI method, 2011 [1] as shown in Fig. (24), because the degree of prestressing force increases leads to more tension stiffening effect than the less degree of prestressing force at tension face of member. The rate of shift of neutral axis is slower than steel due to the effect of non-ductile behavior. The steel is ductile nature hence the tension stiffening effect of bar will loosen in a faster rate than FRP rod.
CONCLUSION AND RECOMMENDATIONS
Numerical and Experimental study reveals that, ACI - Abdelrahman method underestimate the deflection value leads to unsafe design of member. In this paper, it is on attempt to study the behavior of deflection of member using CFRP tendon. There are 51 numerical samples considered for the numerical analysis and four experimental specimens casted and tested for validation of proposed design charts and equations.
The deflection of member is related to deformability property of FRP tendon and it shall be measured in terms of strain behavior of FRP bar up to rupture stage. The proposed deflection calculation method is based on the deformability index and it is calculated based on the ratio of strain at ultimate stage(εpu) to the strain at prestressing stage(εps). The effect of balance strain (εm = εpu-εps) decides the deformability nature of beam. Hence the deflection calculation by the proposed method is realistic strain approach. Wherein ACI method suggested rational approach of introducing softening factor which is calculated based on the comparison of FRP Young’s modulus with respect to steel young’s modulus property. Proposed numerical methods for finding the deflection are near to true solutions for any loading stage as compared to ACI method. The maximum error due to proposed method is less than 5% as compared with experimental results, where in the error by using ACI, 2011 method is up to 20%.
Abdelrahman, 1995 proposed two power curves for the shift of neutral axis for the member using FRP prestressing, but the shift of curve is also changing with respect to deformability index. The moment of resistance of FRP bars are approximately same irrespective of degree of prestressing, hence the deflection curve ultimate changes with respect to degree of prestressing which is not accounted in ACI method, 2011 [1]. Proposed method predicted that the shift of neutral axis is with respect to strain at ultimate stage to the strain at first crack stage. Hence the value of n power curve is less than 2 for the low deformability index and more than two for the high deformability index value. The concept of Branson and abdelrahman is valid for the high deformability index where in it is deviating away from experimental results for the low deformability index.
Design charts as shown in figure 12 and equation 12 & 13 for m & n power coefficient have been proposed with respect to deformability index value. The value of Deformability index shall be calculated with respect to Dolan & burkes [20, 21] strain approach.
This proposed method is applicable for fully bond strength beam member. Hence, a detailed study is required for the deflection behavior of member considering the un-bonded and partially bonded FRP tendon. The deflection behavior of member shall be reviewed considering the beam as partial prestressing with non prestressing steel. The effect of partial prestressing with non prestressing steel will be differing with respect to reinforcement bar properties.
CONFLICT OF INTEREST
The authors confirm that this article content has no conflict of interest.
ACKNOWLEDGEMENTs
The authors are grateful to the following:
Mr. R. Bala Subramanian, Mr. Pierre Hofmann and the management of Dextra Building Products (Guang Dong)
Co., Ltd, Guangzhou China for the sponsor of CFRP material to carryout experimental works.
All the researchers for their test results used for the numerical study.
Dr. M. Suchetha for her support to carryout research works.
Mr. Mark Richard Barnett, Manager EGIS Rail, England, for the review of English of this paper.

