All published articles of this journal are available on ScienceDirect.

Strengthening of a Reinforced Concrete Bridge with Polyurethane-cement Composite (PUC)
Abstract
This paper describes a new material, polyurethane-cement composite (PUC), used to strengthen a 29-year-old reinforced T-beam bridge in Harbin, China. Polyurethane-cement composite (PUC) is mixed with polyurethane raw material and cement. This technique is completed by pouring Polyurethane-cement composite (PUC) into the template. Ultimate bearing capacity of the bridge after reinforcement was discussed based on the concrete structure theory. The flexural strength of reinforced concrete T-beam bridges strengthened with Polyurethane-cement composite (PUC) was controlled by the design flexural strength of Polyurethane-cement composite (PUC). The main construction process was introduced which included concrete surface treatment, installing template and pouring. To investigate the feasibility of the strengthening method, load tests were conducted before and after strengthening. The results of concrete strain and deflection show that the capacity of the repaired bridge, including the bending strength and stiffness, is enhanced. The crack width measurement also indicates that this technique could increase the durability of the bridge. Thus, this strengthened technique with polyurethane-cement composite (PUC) is feasible, the bridge load posting possibly is removed through this technique.
1. INTRODUCTION
Recently, many structural members supporting transport infrastructures have undergone serious strengthening or repair because of load, steel-bar corrosion and concrete aging [1]. The latest surveys showed that reinforcement and maintenance costs for bridges, especially those exposed to unfavourable environment, had gradually increased in the past few decades [2].
To improve the working ability of concrete bridges, many techniques have been used in strengthening. The most common methods for strengthening beams have been the use of Carbon Fibre Reinforced Polymer (CFRP), steel plate bonding, external pre-stressing reinforcement and others, these methods are widely used at present [3]. CFRP materials have good structural performance, high strength and light weight. CFRP can be easily installed, as they can be attached to a curved profile. However, these materials have their own shortcomings. The major drawback of CFRP is the high cost [4]. Bonding steel plates have the disadvantages of weakened bonding caused by steel corrosion, increased dead load weight and difficulties in adapting to the concrete surface profile [5]. Stress concentration can be caused at the end zone of the beam for the external pre-stressing reinforcement method, which unfavourably influences the beam [6].
The introduction of new construction materials such as polyurethane-cement composite (PUC) to civil engineering can provide a potential solution. PUC is a kind of composite material composed of polyurethane raw materials mixed with cement [7]. Polyurethane (PU) is a high performance polymer elastic material mainly based on the chemical compounds of polyisocyanate and polyester polyol. The hardness range of PU is from 10 to 100 (IRHD), with good abrasion resistance performance, corrosion resistance, toughness and cohesiveness. PUC has the advantages of light quality, significant strength in compressive and blending [7, 8]. PUC has excellent bonding and adhesive properties with concrete materials, and it does not need additional adhesiveness for beam reinforcing [8].
PUC has been successfully used in strengthening T-beam girders, as proven through comprehensive laboratory tests. Haleem reported 10 beams strengthened with PUC under different load conditions, and the results showed that the bearing capacity of beams was greatly improved [9]. Nguyen reported six short columns strengthened with Polyurethane Fly Ash (PUFA) of different thicknesses, and the results showed that PUFA could significantly improve the bearing capacity and ductility of the columns [10]. Nevertheless, these research projects were performed with laboratory-scale tests and corresponding analyses. Applying and obtaining the application results in engineering are essential.
This study describes PUC as a material used to strengthen a 29-year-old reinforced T-beam bridge, including design, field application, field test and analysis.
2. ANALYSIS AND DESIGN
2.1. Bridge Description
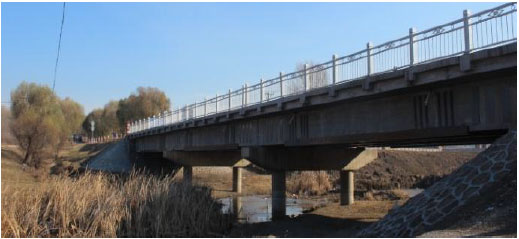
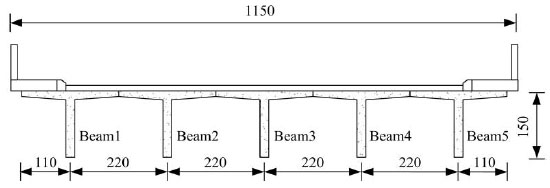
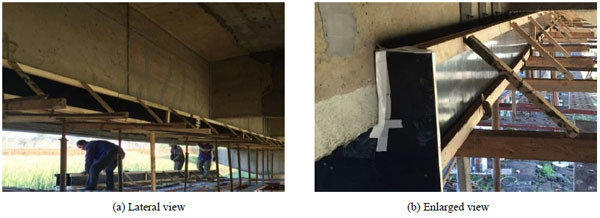
Fig. (1) shows a lateral view of Yun Liang Bridge in Harbin, China. The bridge was built in 1989. It carries an average daily traffic of 800 vehicles. The superstructure consists of three simply supported 20.0m long spans. Central supports consist of reinforced concrete bents, each supported by two circular columns. The total width is 11.5m, and the width of the driveway is 9.0m. The bridge has two lanes and carries one lane of traffic in each direction. The superstructure cross-section consists of five precast RC beams, supporting a 2.2m wide deck, as shown in Fig. (2).
The bridge has different degrees of damage caused by aging, overload, surging traffic and environment.
During routine inspection, salt infiltration was observed in the bridge superstructure. Many beams had been covered largely with efflorescent concrete. Many vertical cracks had appeared on the bottom of the beams across the middle area. Crack spacing ranged from 15cm to 20cm. Serious cracks occurred in the edge-beam, as water from the pavement cracks affected the durability of the girder. Reinforcing the structure was selected because the owner did not agree to replace the bridge or limiting traffic. PUC strengthening method was chosen based on its application of being the least intrusive with traffic and being the most practical.
2.2. Material Characteristics
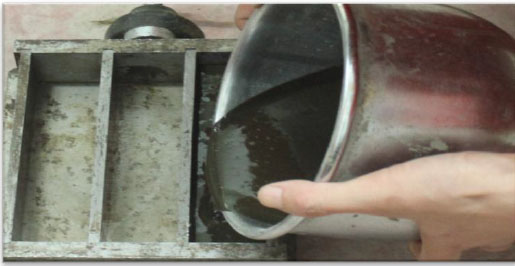
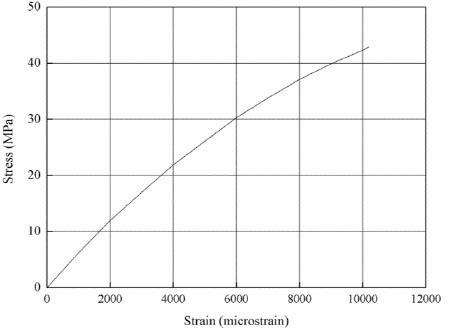
In achieving excellent mechanical properties, PUC with a density no than less 1,400kg/m3, was used to strengthen the beam. In the flexural loading process, the same density of PUC showed the same elastic stress-strain curve until the material was damaged. PUC after mixing is shown in Fig. (3). The density of PUC mixed in the construction site was 1,458 kg/m3. The blending stress-strain cure of the PUC in the construction site is shown in Fig. (4). Ultimate flexural strength (fpu) was about 42.3MPa. Design flexural strength (fpu) was designed to be 3/4 of the ultimate flexural strength, and the corresponding strain was 0.006 under the design flexural strength. The minimum modulus of elasticity (Epd) was 5MPa. Table 1 shows the properties of PUC.
Basic properties such as the concrete compression strength and steel yield strength were assumed because the owner of the bridge did not allow coring to obtain the on-site strengths of the materials from the bridge girder. These basic properties fcfs were assumed as described by JTJ023-85 [11] for bridges of that age because no sample could be obtained onsite. Concrete compression strength, concrete elastic modulus, yield strength of steel rebar and elastic modulus of steel rebar are listed in Table 1.
| Material | Property | Value |
|---|---|---|
| PUC | fpu (MPa) | 42.3 |
| fpd (MPa) | 31.7 | |
| Epd (GPa) | 5.0 | |
| Concrete | fc (MPa) | 30 |
| Ec (GPa) | 30 | |
| Steel | fs (MPa) | 335 |
| Es (GPa) | 200 |
2.3. Strengthen Analysis
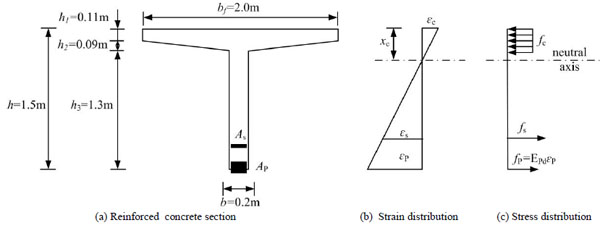
The results of the survey and inspection showed that the bridge’s service ability was insufficient in terms of cracks, erosion and vibration. Moreover, the owner of the bridge asked to complete the strengthening work with minimum interference to traffic. Therefore, the strengthening of an RC T-beam bridge with PUC was designed. The beam blending bearing capacity was analysed through the assumption that the plane section remained to be planar until failure. Blending bearing capacity was evaluated based on force equilibrium and strain compatibility until failure, as shown in Fig. (5).
The failure of the RC T-beam strengthened with PUC was beam bending failure because of the strong bonding performance between PUC material and concrete. The flexural capacity of the PUC -reinforced member depended on the concrete crushing or the design flexural strength of PUC material. Two kinds of failure modes exist for PUC -strengthened RC beams according to Fig. (5) and plane assumption.
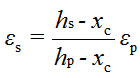
According to strain compatibility, the strain of steel bar εs can be expressed as follows.
 |
(1) |
where hs represents the depth from the centroid of steel bars to the top of the T-cross section, hp represents the depth from the centroid of the PUC section to the top of the T-cross section, xc represents the depth of the neutral axis and εp represents the strain of the centroid of the PUC section. When concrete crushing failed, the ultimate compressive strain for the concrete was assumed to be 0.003, and the steel bar was in a yielding situation.
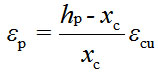
According to strain compatibility, the strain of the centroid of the PUC section can be expressed as follows.
 |
(2) |
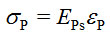
The PUC material was treated as a nearly linear material, and the stress of the PUC material can be calculated by the following:
 |
(3) |
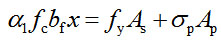
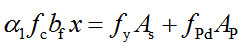
The standard equilibrium equation is listed in Eq. 4.
 |
(4) |
Where x = 0.8xc, α1, As represents the area of the steel bars, fy represents the yield strain of the steel bars and εs represents the strain of the steel bars. εs can be calculated from a combination of Eqs. 1-4, and εs goes beyond the allowance strain of steel rebars, which is 0.01 according to Design Code of Concrete Structures [12]. Therefore, beam failure is not controlled by concrete crushing failure.
The strain of PUC is about 0.006 when the flexural strength of the PUC material meets the design flexural strength. The steel bar strain is larger than the yield strain and smaller than 0.01 according to strain compatibility.
 |
(5) |
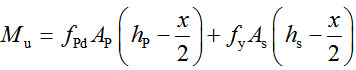 |
(6) |
where AP represents the cross-sectional area of the PUC material, and fpd represents the design strength of the PUC material. The flexural strength of the beams after strengthening can be calculated through a combination of Eqs. 5- 6.
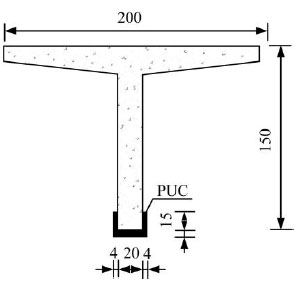
The above mentioned analysis shows that the bearing capacity of the strengthened beam is controlled by the design flexural strength of PUC material. The flexural strength increased to 1036.8through the pouring of PUC material. The section of the T-beam strengthened by PUC is shown in Fig. (6).
3. STRENGTHENING PROCEDURE
PUC strengthening is similar to the enlarging section method [13, 14], but the curing time of the PUC strengthening method is significantly less than the enlarging section method. First, degenerated materials are removed from the concrete surface, and the visible cracks in the surface of the girders are closed through a chemical method. Second, the concrete surface is chiselled to ensure that its roughness meets the China Construction Code of Concrete Structure [15]. Loose materials, which affect the bonding performance of the PUC material, are removed through high-pressure water washing.
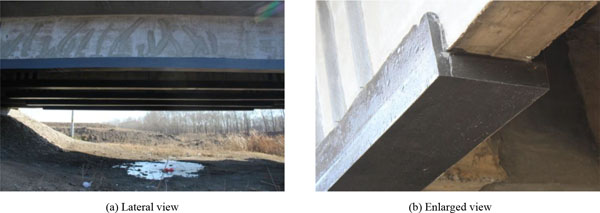
In achieving a better bonding effect, sufficient time must be ensured to dry the concrete surface naturally. The construction templates were made depending on the design of the dimensions of the PUC material. The template was installed in the specified location, as shown in Fig. (7). The mixing ratio of the PUC components (polyol: polyisocyanate: cement) was 1:1:2.5 by weight. The mixed PUC material was poured into the templates. The templates were removed after two hours, as shown in Fig. (8).
4. LOAD TEST
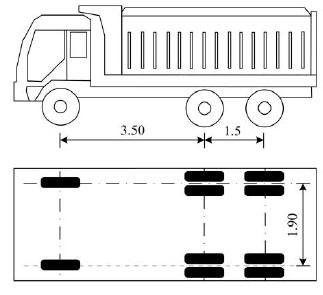
Before strengthening and two months after strengthening, load tests were performed to obtain the service ability of the bridge. These tests are repeated once a year and they will continue over a period of three years. Three-axle trucks are used as live load. The details of the trucks are shown in Fig. (9). The gross rail loads before and after strengthening are listed in Table 2. The bridge test was performed under two conditions. The two trucks were used at different locations for each condition and were assigned with unique letters A and B.
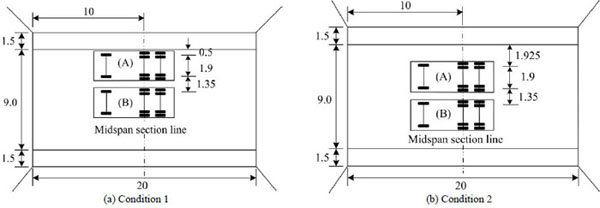
The testing of each condition was sequenced as follows: Truck A, Truck A + B, Truck A. The two conditions are shown in Fig. (10). For condition1, the two trucks deviated from the centre line of the bridge, and the distance from the outside wheels to the pavement edge was 0.5m. For condition2, the two trucks were symmetrical with the centre of the bridge, and the distance from the outside wheels to the pavement edge was 1.925m.
| Load-test trucks | Force axlet1(kN) | Back axlet2(kN) | Back axlet1(kN) | |
|---|---|---|---|---|
| Before | (A) | 58.5 | 135.4 | 135.4 |
| (B) | 59.4 | 136.9 | 136.9 | |
| After | (A) | 59.7 | 135.5 | 135.5 |
| (B) | 58.7 | 134.6 | 134.6 | |
5. STRAIN MEASUREMENT
Strain gages were placed on the concrete surface in the cross, with the detailed locations shown in Fig. (11a). The letter n represents the beam number, and the letter C represents the concrete strain gages. Resistance strain gauges (Cn1) were installed on the bottom of the beam before strengthening, as the bottom of the beams was covered with PUC after strengthening. The strain gages of the PUC surface are shown in Fig. (11b). The letter P represents the PUC strain gages. The gage Pn2 and the gage Cn1 were installed at the same horizontal position. The strains were collected at a rate of two readings per second.
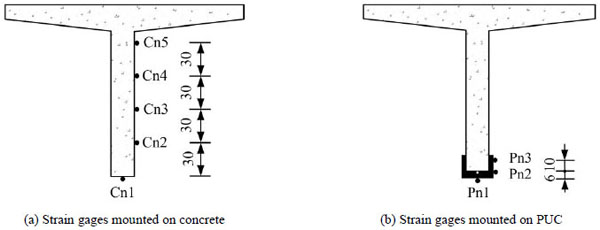
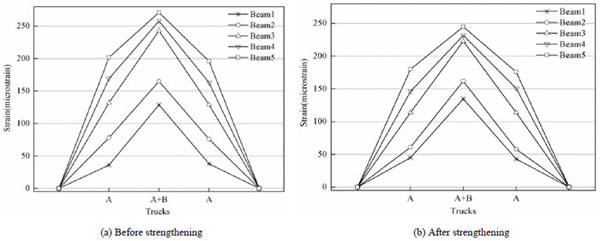
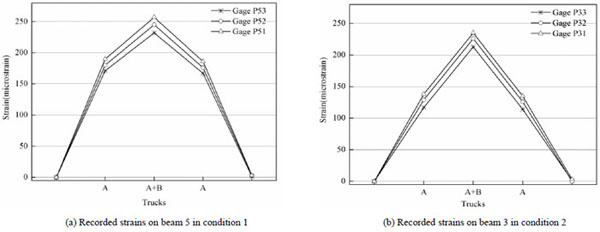
Fig. (12) shows the concrete strain on the bottom concrete surface under live load in condition 1 before and after strengthening. The strain was the largest in the edge beam. The maximum strain of beam 5 was 271 microstrains for the two trucks (Trucks A + B) before strengthening because of the damage and the weak interaction between the beams. After strengthening, the maximum strain of beam 5 was 245 microstrains for the two trucks (Trucks A + B). The maximum strains of beam 4 were 258 microstrains and 232 microstrains before and after strengthening, respectively. The strain was reduced to about 26 microstrains. The maximum strains of beam 3 were 243 microstrains and 223 microstrains before and after strengthening, respectively. Therefore, the concrete strain can be reduced after the PUC material is poured.
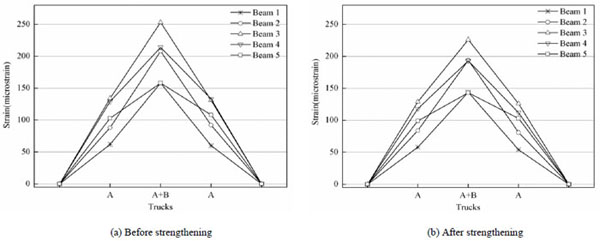
For condition 2, the concrete strains on the bottom concrete surface under live load before and after strengthening are shown in Fig. (13). The strain of beam 3 was the largest for the two trucks (Trucks A + B) because the two trucks were symmetrical to the centre of the bridge. The maximum strain of beam 3 was 253 microstrains before strengthening, and the strain became 226 microstrains after strengthening. Before strengthening, the strains of beam 4 and beam 5 were 214 and 158 microstrains, respectively, and after strengthening, the strainswere 193 and 143 microstrains, respectively. In comparing the strains before and after strengthening, the concrete strain is reduced to some degree.
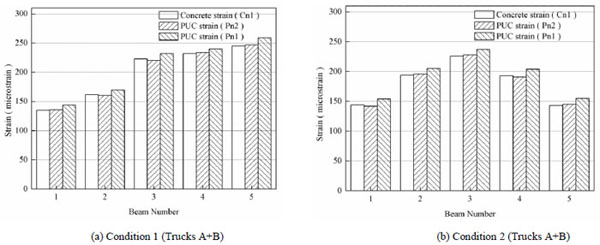
The recorded strain values of gages Cn1, Pn2 and Pn1 for the five beams in condition 1 and condition 2 are shown in Fig. (14). In comparing the recorded concrete strains (gage Cn1) and PUC strains (gage Pn2), the concrete strain values are close to the PUC strain values on the same horizontal height. Therefore, PUC strain compatibility is well at the live load. In comparing the PUC strains (gage Pn1) with those recorded on the concrete (gage Cn1), the PUC strains are higher than the concrete strains. Strain compatibility leads to the higher PUC strain than the concrete strain because the bottom PUC is physically located below the bottom concrete in the beam section.
Measured PUC strains for different conditions and the various truck positions further confirmed consistency of the data and the effectiveness of the strengthening method in carrying load, as shown in Fig. (15). From this figure, for the given truck position, reading from gages P51, P52 and P53 of beam 5 in condition 1 clearly showed that strains were proportional to applied bending. Gages P31, P32 and P33 recorded flexural strains that were proportional to different truck positions in beam3 in condition 2.
Measured concrete strains of beam 3 and beam 5 below the deck slab are listed in Table 3. Two trucks (Trucks A + B) were parked on the bridge in condition 1 and condition 2. From this table, in comparing the strains for the given gages before and after pouring PUC, the compressive strains in the concrete were higher after the PUC was poured. In investigating this matter further, the axes were determined as shown in Table 4. Two trucks (Trucks A + B) were parked on the bridge in condition 1. From this table, as expected, the neutral axes of beam 3 and beam 5 migrated downwards by about 27mm and 27mm, respectively, after the PUC was poured in condition 1.
| Condition | Gage C35 strain(µε) | Gage C55 strain(µε) | ||
|---|---|---|---|---|
| Before | After | Before | After | |
| 1 | -28 | -31 | -25 | -28 |
| 2 | -29 | -32 | -20 | -22 |
|
Beam number |
Before strengthening(µε) | After strengthening (µε) | ||||
|---|---|---|---|---|---|---|
| Gage Cn5 strain(µε) | Gage Cn2 strain(µε) |
Neutral axis location (mm) |
Gage Cn5 strain(µε) |
Gage Cn2 strain(µε) |
Neutral axis location (mm) |
|
| 3 | -28 | 175 | 423 | -31 | 152 | 450 |
| 5 | -25 | 197 | 401 | -28 | 167 | 428 |
6. DEFLECTION MEASUREMENT
Dial indicators were installed on the bottom of the beams to measure the midspan deflection in the different conditions. The midspan deflection of all the beams before strengthening in condition1 is shown in Fig. (16a). The deflection of beam5 was the maximum under the partial truck load. The maximum deflection was 9.1mm for two trucks (Trucks A + B). Fig. (16b) shows the midspan deflection of all the beams after strengthening in condition 1. The deflection of beam5 was 7.8mm after strengthening. The maximum deflections of beam 4 and beam 3 were 8.4mm and 7.6mm before strengthening, respectively. After strengthening, the deflections were 7.3mm and 6.7mm for the two trucks (Trucks A + B). As expected, a certain decrease in deflection after the application of PUC reinforcement could be observed.
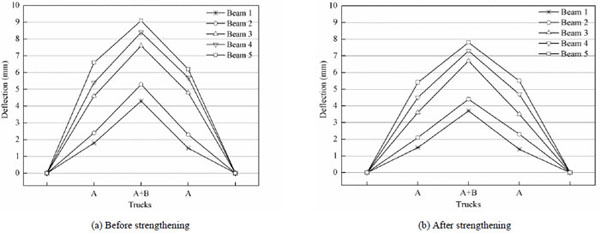
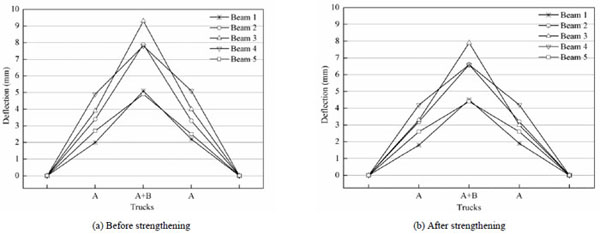
Fig. (17a and b) show the midspan deflection of all the beams before and after strengthening in condition 2, respectively. The deflections of beam 3 were 9.3 mm and 7.9 mm for the two trucks (Trucks A + B) before and after strengthening, respectively. The deflection decreased by about 1.4 mm after strengthening. Before strengthening, the deflections of beam 4 and beam 5 were 7.8 mm and 4.9 mm, respectively. After strengthening, the deflections of beam 4 and beam 5 were 6.6 mm and 4.4 mm, respectively.
These findings represent an initially good performance, although the long-term performance will be monitored throughout the next year.
7. CRACKS
In the load test before retrofitting, the width of the cracks increased with the test load, but no new cracks appeared. These cracks had affected the durability of the bridge and would have further reduced the performance of the bridge if no action were taken. In observing the development of the cracks after reinforcement, a crack in the middle of beam 5 was selected to be the observation crack of the load test. The width of the crack on the bottom concrete is 0.25 mm before strengthening. The observation location of the crack is beyond the bottom concrete surface, as the concrete surface was covered with PUC after strengthening. The depth from the observation location to the bottom concrete surface was 17 cm. The width of the crack at the observation location is 0.1 mm. Its width was unchanged for one truck (Truck A), 0.02 mm for two trucks (Trucks A + B) in condition 2 and closed when the trucks were moved from the deck. Furthermore, periodical inspections were conducted to observe the development of the crack. The crack was found to be stable.
8. LIVE-LOAD DISTRIBUTION FACTORS
Many techniques are available in determining transverse live-load distribution or girder distribution factors (DFs). Khaloo [16] analysed the DFs by using the finite element method considering four different parameters. Field testing could also provide information on live-load DFs for a given bridge type and geometry [17, 18]. As the geometric size of all the T-beams is almost the same, the stiffness of every beam can be considered as having an equal value. The DFs can be determined from field measurements using the following.
 |
(7) |
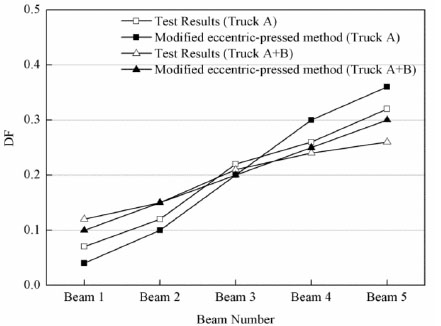
Where δi is the maximum static deflection in the ith girder, and i = 1~5. The deflection measurements shown in Fig. (18) for Yun Liang Bridge in condition 1 were used to determine the live-load DFs according to Eq. 7. From the modified eccentric-pressed method [19], live-load DFs that can be compared with the measured DFs were provided as shown in Fig. (16). The exterior girder (beam 5) deflected by 6.6 mm for one truck (Truck A) in condition1. The total deflection of all of the girders was 20.4mm for a live-load DF of about 6.6/20.4 or 0.32.The live-load DF is 0.36 using the modified eccentric-pressed method. The live-load DFs depend on girder spacing, span, girder bending stiffness and girder torsional stiffness. The exterior girder (beam 5) deflected by 9.1 mm for the two trucks (Truck A + B) in condition 1. The total deflection of all of the girders was 34.7 mm for a live-load DF of about 9.1/34.7 or 0.26. The live-load DF is 0.30 using the modified eccentric-pressed method. Thus, the modified eccentric-pressed method is applicable for calculating the live-load DFs of T-beam bridges.
CONCLUSION
The innovative strengthening with PUC material of a 29-year-old bridge was proven to be a reliable and easy-to-operate technique. The main construction process was described. Load tests were conducted before and after strengthening to evaluate the performance of this bridge and the effectiveness of the reinforcement method. Based on load test and analysis, the main results obtained in this study are listed below:
The blending strength of the T-beam bridge strengthened with PUC can be determined by force equilibrium, strain compatibility and controlled failure modes. The T-beam bridge strengthened with PUC is governed by the PUC design flexural strength.
The blending bearing capacity of the main girders was improved after pouring PUC materials, and the main girder deflection and the width of the cracks were reduced in different degrees. Repeated load tests will be conducted to observe long-term performance.
The PUC strain deformation complies with strain coordination under the static load. The neutral axis of T-beams migrated downwards after the PUC was poured.
The transverse connection between beams was proven by the cross beam and the bridge deck. The live-load DFs of the strengthened bridge calculated by experimental results were in good agreement with the modified eccentric-pressed method.
CONFLICT OF INTEREST
The authors confirm that this article content has no conflict of interest.
ACKNOWLEDGEMENTS
Declared none.

