All published articles of this journal are available on ScienceDirect.

Run-out Effects of Debris Flows Based on Numerical Simulation
Authors Info & Affiliations
Abstract
Debris flows are a common natural disaster in mountainous areas and often cause severe casualties and property loss. Debris-flow run-out effects analysis can provide an idea of the spatial risks posed to the downstream area of a debris flow, which is extremely important for local populations’ lives, disaster mitigation and planning the layout of economic construction. The objective of this study is to develop a new method to quantify debris flow run-out effects by combining debris flow simulation results and data for different types of land use within the inundated area. After a three-dimensional numerical simulation platform was established, the numerical simulation method was applied as a modeling tool to simulate the inundated areas and final buried depths under rainfalls with different return periods. The simulated result for flow depth under a 100-year return period rainfall event was validated based on field measurements. Finally, the debris-flow run-out effects under different return periods were analyzed by combining the simulation results and land use data. The proposed method can enhance the accuracy of debris-flow spatial risk assessment and has great value for application.
1. INTRODUCTION
Debris flows are a common natural phenomenon in mountainous areas and cause casualties and severe property loss each year, which seriously affect the sustainable development of the local economy and society [1]. In areas struck by the Wenchuan earthquake, a large number of landslides and collapses were triggered that were widely distributed over slopes and along channels, which created a high-risk environment ripe for debris flows. In the years following the earthquake, intense rainfall events have triggered massive debris flows on several occasions (such as the debris flows in the Taoguan, Wenjia and Hongchun Gullies), which have caused casualties and loss of property [2-4]. For disaster prevention and mitigation, reasonable and effective debris-flow run-out effects analysis has become an important and active area of research. From a comprehensive analysis of current research into the debris flow run-out effects, two major research methods, statistical analysis and numerical simulation, are commonly applied.
In general, several background factors for debris flows are selected for statistical analysis, such as slope, aspect, curvature and channel length, to indirectly evaluate the effects of debris flows on people, constructions, the environment, and other elements, which is known as debris-flow hazard assessment. In the early stages of the analysis of debris-flow hazards and effects, the application of statistical analysis was particularly significant. In 1977, Japanese scholars conducted the first debris-flow hazard assessment research based on three factors: geomorphology, debris-flow morphology and rainfall [5]. In 1981, Hollingsworth and Kovacs divided three evaluation factors (slope, lithology and valley cutting density) into five levels (0, 1, 2, 3 and 4) to determine the degrees of debris-flow hazard based on the superposition method [6]. Olivier divided debris-flow hazard regions into three types (hazardous, potentially hazardous and non-hazardous regions), represented by red, yellow signal and green signals, respectively [7]. Chinese research on this issue began in the 1980s; in 1982, Wang first conducted debris-flow hazard analysis based on experience in the Soviet Union [8]. Liu proposed a quantitative method to compute degrees of debris-flow hazards in 1988 [9]. Zhu and Tang used eight evaluation indices, including topographic, lithological and geological structure indices, to perform debris-flow hazard analysis in Yunnan Province [10]. With the development of computer and geographic information system (GIS) technology in the 1990s, debris-flow hazard and effect analysis research progressed substantially. Jinsoo et al. (2013) used 13 factors, such as slope, aspect, curvature and soil thickness, to analyze disaster hazards in Korea based on GIS [11]. Xiong et al. (2015) carried out a hazard analysis of debris flows in the area struck by the Wenchuan earthquake based on watershed units [12]. After several decades of development, the methods for debris-flow hazard and effect analyses have advanced from qualitative to quantitative and from individual to integrated. At present, numerous methods have been proposed, such as regression analysis [13], fuzzy mathematics [14] and artificial neural networks [15, 16], in which several factors select for three debris-flow formation conditions, i.e., topographic, loose-material source and hydrodynamic conditions, to conduct debris flow hazard or effect analyses indirectly.
The numerical simulation method was presented by researchers in 1990s with the development of debris-flow physical models and numerical computation methods. Because of the complexity of debris-flow compositions and mechanisms, the theory and methods of fluid mechanics are often used to simplify debris-flow physical processes. In 1970, Johnson et al. first established a debris-flow motion equation based on a Bingham viscous fluid model and determined the maximum velocity of a debris flow [17]. Romenshi used volume of fluid interface tracking technology to numerically simulate debris flows in 2004 [18]. Tang used the Manning resistance model and the Takahashi resistance model to simulate a dynamic equation of unsteady two-dimensional debris flow and evaluate debris-flow hazard zoning [19]. Wei et al. (2003) used a mathematical model of debris-flow accumulation to simulate a Bingham-model debris flow and established a momentum model of debris-flow hazard zoning [20]. Hu et al. (2003) proposed a kinetic energy model for debris-flow hazard zoning based on the distribution of debris-flow velocity and depth values [21]. Wu et al. used a bilinear viscous-plastic rheological model to simulate the Liangjiashan Gully debris flow using the ANSYS Workbench platform [22]. Numerical simulation can not only reproduce debris-flow movement, but can also provide key parameters for hazard and vulnerability assessment, such as velocity and flow depth; therefore, the numerical simulation method has developed rapidly in recent years with the advancement of computer technology, which is now widely used in disaster assessment, land-use planning and disaster mapping. The degree of a debris-flow hazard depends on the flow velocity, flow material and topography. The kinetic energy of the flow determines the amount of damage or hazard degree. But it has been established that the debris-flow run-out effect is related not only to flow velocity, depth and kinetic energy, but also to land use. For instance, under the same flow velocity and depth, less damage is caused to constructions such as houses than to non-construction land, such as agricultural fields. Currently, the related research has not taken this observation into consideration.
Densely populated and high construction areas in the downstream part of a debris-flow run-out area or debris-flow alluvial fan tend to be the areas worst-hit by a debris flow. Therefore, debris-flow run-out effects analysis is extremely important for preserving lives, mitigating disasters, and determining layouts for economic construction. To analyze debris-flow run-out effects in the downstream margins of debris flows more accurately and precisely, the authors have developed a new method to quantify debris-flow run-out effects by combining simulated results with land-use type data for the inundated areas. With the Bayi Gully in Longchi Township, Dujiangyan City, Sichuan Province, China as the study area, the numerically simulated results for debris flow-inundated areas and final buried depths in the downstream parts of debris flows with different return periods are obtained using this numerical computer model. The debris-flow run-out effects for different return periods were analyzed by combining the simulated results and the land-use data. This study provides a new methodology for run-out-effect analysis can enhance the accuracy of debris-flow spatial risk assessment and has great value for application.
2. MATERIALS AND METHODOLOGY
2.1. Study Area
2.1.1. Geological Environmental Conditions
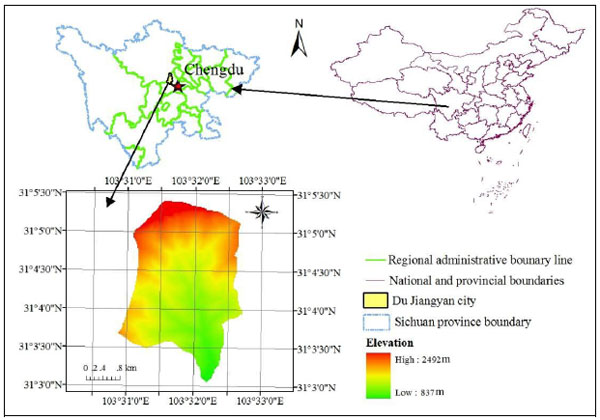
The Bayi Gully in Longchi Township, Dujiangyan City, Sichuan Province, China, a tributary of the Longxi River located in the meizoseismal area of the Wenchuan earthquake, was selected as the study area (Fig. 1). This area extends from 31°03′01″ N to 31°05′22″ N and 103°30′57″ E to 103°32′41″ E, and covers an area of 8.63 km2. The elevation of the Bayi Gully ranges between 837 m and 2492 m, and its main channel is approximately 4450 m in length with a gradient of 376.7%.
Geologically, the Quaternary strata of the Bayi Gully consist of alluvium (Q4pl), debris deposits (Q4del), and colluvial deposits (Q4e+dl), which are mainly composed of stone fragments and are distributed in accumulation and circulation areas. The bedrock of the region of debris-flow formation consists mainly of Proterozoic granite (γo2) and Ediacaran volcanic deposits (Za) of andesite, tuff and andesitic basalt. The strata of the circulation region belong to the Upper Triassic Xujiahe Formation (T3x), which is composed mainly of sandstone and mudstone [23]. The Hongkou–Yingxiu fault and the Guanxian fault cross the Bayi Gully and form a number of surface ruptures of a certain size. The seismic intensity of the study area was classified as XI, which was the maximum seismic intensity of the Wenchuan earthquake.
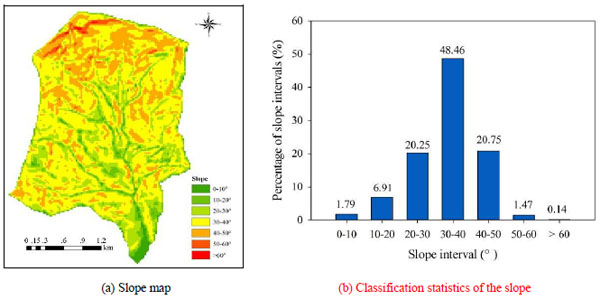
Geomorphologically, the study area has strong tectonic movement and high erosion; the main channel is U- to V-shaped, and the slope of the valley ranges between 0° and 64°. The typical slope gradient interval of the gully is 30–40°, which accounts for 48.69% of the study area. A map and the classification statistics of the slope are shown in Fig. (2).
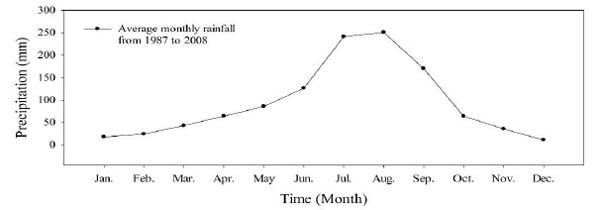
This area has a subtropical and humid climate, with an average annual temperature of 15.2°C and an average annual rainfall of 1200 mm. Rainfall in this area is seasonal; approximately 70% of the total rainfall occurs during the monsoon season (June–September). Fig. (3) shows the average monthly rainfall in Dujiangyan City from 1987 to 2008, with 69.48% of the total rainfall distributed from June to September.
2.1.2. Environment Vulnerable to Debris-Flow Disasters
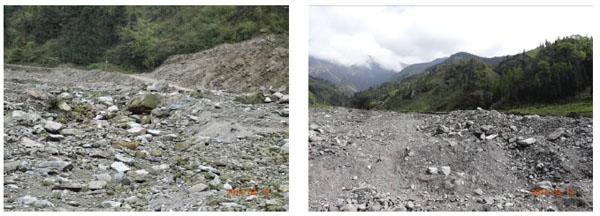
The Wenchuan earthquake triggered a large number of landslides and collapses in the Bayi Gully that significantly increased the amount of the loose solid materials. Intensive field investigations revealed that the volume of these materials was greater than 757.61 × 10⁴ m3, which provides an abundance of source material for debris flows [23]. The three check dams in the gully enhanced the aggregation of debris-flow materials and indirectly increased the discharge and density of debris flows. Loose solid materials accumulated in the channel, which caused sharp changes in the channel’s micro-topography. Blockage of the main channel was found to be severe, and this blockage can create a cascade followed by damming, dam breakage and debris flow. Loose solid materials in the Bayi Gully are pictured in Fig. (4).
The abundant loose solid materials, severe channel blockage, and scouring and silting in the channel have resulted in an increase in the scale of debris flows and a significant reduction in the debris-flow critical threshold. The Bayi Gully experienced an immense debris flow on August 13th, 2013, which caused two deaths one injury, and destroyed 36 houses, more than 100 makeshift homes, and 11 check dams. This debris-flow event rushed out approximately 116 × 104 m3 of loose solid materials, and more than 600 × 104 m3 of these materials remained widely distributed on the slope and along the channel, and could therefore form future large-scale debris flows triggered under the effects of heavy rainfall. Therefore, this debris-flow gully requires high vigilance and corresponding mitigation measures, such as reasonable debris-flow run-out-effect analysis, to guide decision-making for the local population, disaster mitigation and planning for economic construction.
2.2. Methods
2.2.1. Data Preparation
The data used in this study consist of topographic data, rainfall data, debris-flow attribute data and other relevant information. The topographic data are mainly represented by topographic map of various scales, including paper and digital topographic maps, as well as remote sensing images, which were mainly used to establish the three-dimensional numerical platform for debris-flow simulation. The rainfall data consist mainly of historical records and field monitoring data, which were used to analyze the temporal-spatial distribution characteristics of local rainfall and antecedent and critical rainfall amounts for important past events. Debris flow attribute data used include outdoor and indoor experimental data for the basic physical and mechanical properties of soil and rock masses, which were used to identify fluid characteristics for numerical simulation, such as the debris-flow density and rheological characteristics. Other relevant data used include field investigation data for important rainfall events, land use data and hazard-affected bodies, which were mainly used to identify the debris-flow run-out effects and verify debris-flow simulation results. After these data were prepared, a GIS database for each data category was established with the GIS platform.
2.2.2. 3D Numerical Platform for Debris-Flow Simulation
There are two ways to obtain 3D digital terrains; one is to directly use surveying and mapping instruments such as a GPS device, total station, or terrestrial 3D laser scanner, and the other is by means of aerial photography, to indirectly extract 3D digital terrain data from high-resolution aerial images.
The second method was used to obtain the 3D digital terrain for this study. The spatial distributions of hazard-affected bodies and movable beds were recorded through field surveys, and the 3D numerical simulation platform was established by coupling 3D digital terrain, hazard-affected bodies and movable bed data.
2.2.3. Numerical Simulation of Debris Flows
Debris-flow run-out effect analysis can provide an indication of the spatial risk of the downstream portion of a debris flow. Therefore, debris-flow run-out effect analysis for different return periods is necessary and of great importance for disaster mitigation, economic planning, and preventing loss of life. To enable detailed analysis, the inundated area, final buried flow depth and land use types within the inundated area, which are key parameters for debris-flow run-out effect analysis, must be determined.
The numerical computer model Massflow was used to delimit these debris flow parameters in this study. This model is suitable for this type of application as it is able to model landslides, debris flows, dam breakage and other dynamic processes of mountain hazards, with a computational fluid dynamics code based on a collocated finite-difference approach and self-programming technology. With this platform, modeling the debris-flow movement process and data post-processing can be implemented through secondary development and programming and other platform.
The numerical computer model used in this study requires a 3D numerical simulation platform, and data for the debris-flow attributes data, volume or discharge and the distribution of debris-flow sources. The 3D numerical platform for debris-flow numerical simulation can be established using the above method as described in section 2.2.2. The debris-flow physical and mechanical parameters were obtained through indoor and outdoor experiments. The rheological properties of the debris flow were measured through laboratory experiments with field samples using a mud rheometer. The debris-flow volume and distribution of debris-flow sources were obtained through field investigation with aerial photographs and satellite image.
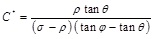
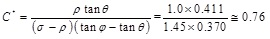
In 1980, Takahashi proposed a method for calculating debris-flow equilibrium concentration, which is expressed as follows [25]:
 |
(1) |
where C* is the debris-flow equilibrium concentration, ρ is the liquid density of the debris flow, θ is the average slope of the channel, σ is the density of solid particles which is typically 2.65 g/cm3, and φ is the angle of friction of solid particles.
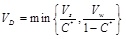
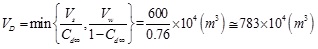
Generally, the debris flow volume is divided into the volume of mobilized loose solid materials and the volume of the liquid phase. The amount of mobilized loose solid materials in the field is controlled by the amount of precipitation and the available volume of loose solid materials. Here, if the available volume of loose solid materials is Vs and the amount of precipitation is Vw, the total volume of the debris flow VD is calculated as follows [24]:
 |
(2) |
After the total volume of the debris flow and the distribution of debris-flow sources from field surveys are obtained, the debris flow numerical simulation can be carried out. A typical simulation result is shown in Fig. (5).
The debris-flow run-out effect depends on the types of land use and flow depth within the debris flow-inundated areas. Therefore, to analyze the debris-flow run-out effect more accurately and precisely, the types of land use within the inundated area must be taken into account after numerical simulation.
3. RESULTS
3.1. 3D Numerical Platform of Debris Flow Simulation
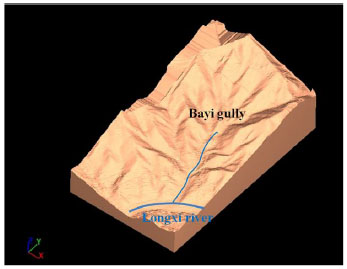
The established 3D platform of debris flow numerical simulation in the study area is shown in Fig. (6).
3.2. Delimitation of the Debris Flow-inundated Area
After several debris-flow events following the earthquake, the remaining amount of loose solid materials generated by the earthquake has already been greatly reduced. Field investigation and satellite imaging performed after the 2013 debris-flow event have indicated that the volume of debris-flow source was roughly 600 × 104 m3.
The equilibrium concentration of a debris flow in Bayi Gully can be calculated using Eq. 1. The values of relevant parameters in Eq. 1 are as follows: ρ is 1.0 g/cm3, φ is 38°, σ is 2.65 g/cm3, and θ is 22.34°. Therefore, equilibrium concentration is:
 |
(3) |
If the amount of precipitation is low, only a portion of the materials in the field riverbed or hillslope can be mobilized to form a debris flow. If the amount of precipitation is high, all available materials may be mobilized. If the amount of precipitation is much higher than the amount needed to form a debris flow, the mixing of water and debris may result in flooding with suspended sediments or a debris flow followed by abundant tail water [24]. The debris flow volumes triggered by the corresponding rainfall intensities under different return periods can be calculated using Eq. 2. The total volumes and rainfall intensities calculated under different return periods are given in Table 1. The maximum volume for a debris flow can be calculated as:
| Return period /year | 20 | 50 | 100 | 200 | 400 |
| 10-min rainfall intensity / mm | 20.76 | 24.24 | 26.76 | 29.16 | 32.4 |
| 1-h rainfall intensity / mm | 82.68 | 101.4 | 111.8 | 121.68 | 134.16 |
| 6-h rainfall intensity / mm | 197 | 238 | 269 | 300 | 342 |
| 24-h rainfall intensity / mm | 318.08 | 401.86 | 467.18 | 531.08 | 617.7 |
| Volume /m3 | 42 × 104 | 79 × 104 | 116 × 104 | 350 × 104 | 783 × 104 |
 |
(4) |
The rainfall event that occurred on August 13th, 2013 had a return period of approximately 100 years. Based on the results of previous research, this rainfall triggered a large-scale debris flow and rushed out approximately 116 × 104 m3 of loose solid materials [24]. Therefore, the debris-flow volume of the Bayi Gully under a 100-year return period is 116 × 104 m3. The debris flow volumes for other return periods were estimated based on the precipitation amounts for these return periods. As shown in Table 1, the maximum volume is exceeded for rainfall with a return period 400 years. It is well established that a debris-flow event can rush out an immense amount of loose solid materials. Therefore, the volume of the available debris source is always reduced by debris flow events. The volumes listed in Table 1 are maximum volumes based on the available debris source volume generated by the Wenchuan earthquake. For the purpose of debris-flow run-out effect analysis, we must consider the maximum loss under given conditions. Therefore, these volumes in Table 1 are reasonable and appropriate for debris-flow run-out effect analysis in the Bayi Gully.
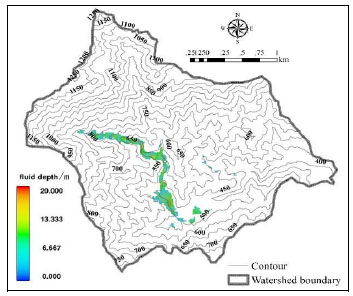
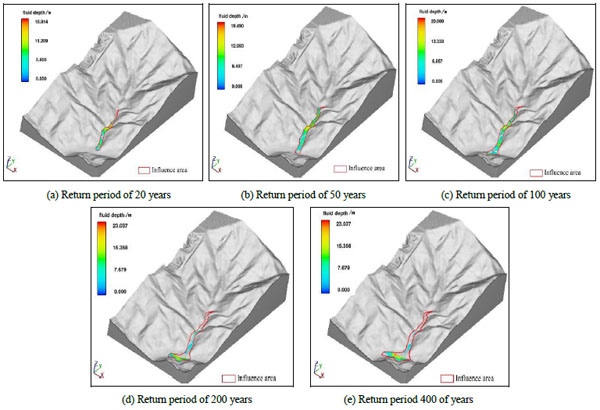
Based on remote sensing images and intensive field investigations, the distribution of debris-flow source and the outlet of debris-flow formation region were determined. This outlet is set as numerical boundary condition for these volumes of flow which is arranged at the same location, and then run the flow movement process. The other simulation parameters adopted in this study, based on the material data for the study area, are shown in Table 2. The numerical simulation results for final buried depth and inundated area under different return periods are shown in Fig. (7).
| Gully | Debris flow type | Density /m3/s | Yield stress /Pa | Viscosity coefficient /Pa·s | Roughness coefficient |
|---|---|---|---|---|---|
| Bayi | Bingham | 1.65 | 6000 | 0.5 | 0.02 |
The simulated inundated area under a 100-year return period rainfall event is similar to the actual area. Based on the simulation results for the distribution of fluid depths and inundated area, the major debris-flow risk area expands along the channel and alluvial fan, and the submerged area includes most affected bodies on the alluvial fan, such as houses and roads. After the debris flow event, we conducted intensive field investigations and measured mud levels, which can be used to validate simulation results. The comparison between measured and simulated results for fluid depth is shown in Fig. (8).
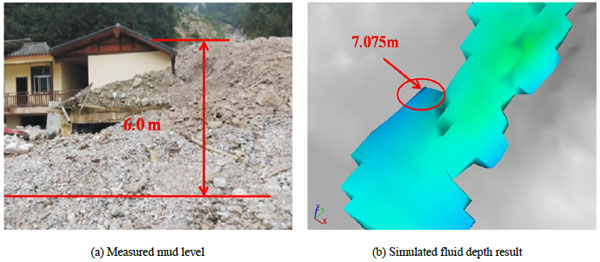
The simulated fluid depth value for a house on the alluvial fan was 7.075 m, and the measured value was 6.0 m; the relative error is 17.91%. This method can be applied to simulate the debris flow-inundated area and intensity (as indicated by parameters such as maximum flow depth and velocity), which shows the value of this method for important applications.
3.3. Debris-flow Run-out Effect Analysis of the Bayi Gully
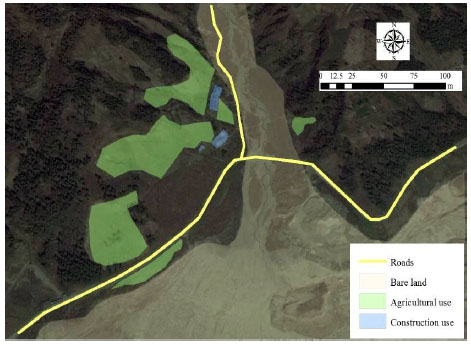
The land use types at the outlet of the Bayi Gully on the alluvial fan are mainly construction (houses), transportation (provincial and county roads), agriculture, bare land (landslide and debris flow deposit area) and forest, as shown in Fig. (9). Based on the local characteristics of this particular region, the standards for debris-flow run-out effect analysis can be obtained by combining the simulated final buried depth and the land use data within the inundated area are shown in Table 3. Bare land is not listed because of its particular characteristics; its run-out effect analysis standards are as follows: where the final buried depth is less than 3 m, the hazard level is low; where the final buried depth is between 3 and 5 m, the hazard level is moderate; and where the final buried depth is greater than 5 m, the hazard level is high.
| Final buried depth | Objects on the ground | |||||||
|---|---|---|---|---|---|---|---|---|
| Construction use | Hazard degree | Agricultural use | Hazard degree | Transportation use | Hazard degree | Forest use | Hazard degree | |
| More than 2 m | Destroyed completely | High | Destroyed completely | High | Destroyed completely | High | Destroyed completely | High |
| Between 1 and 2 m | Half destroyed | Moderate | Half destroyed | High | Destroyed completely | High | Slightly damaged | Moderate |
| Between 0.5 and 1m | Slightly damaged | Low | Half destroyed | Moderate | Half destroyed | Moderate | Slightly damaged | Low |
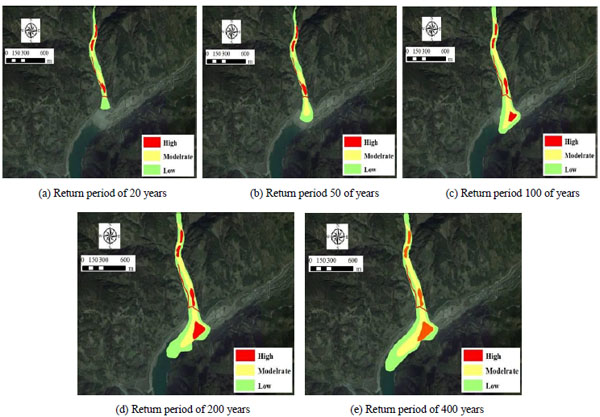
Based on the simulated final depth and standards for the debris-flow run-out effect, the results of the analysis are shown in Fig. (10).
CONCLUSION
This paper presents a new method to quantify debris flow run-out effects by combing debris flow simulation results with data for different types of land use. The high-risk environment for debris flows in the Bayi Gully was first fully explored. Then, the numerical simulation results for the debris flow-inundated areas and final buried depths under rainfalls with different return periods were obtained through numerical simulation. Finally, the debris-flow run-out effect was analyzed by combining the simulation results and data for different types of land use. The main conclusions are the following:
(1) Loose solid materials are widely distributed on the slope and along the channel in the gully and provide abundant material sources for debris flows. Large-scale debris flows could easily occur in the gully under the effects of heavy rainfall. Therefore, the possibility of debris-flow makes the Bayi Gully very dangerous and requires high vigilance.
(2) Numerical simulation was used to simulate the inundated areas and final buried depths of debris flows under rainfalls with different return periods. The field results for the investigation of the debris-flow event on August 13th, 2013, which was calculated as the result of a 100-year return period rainfall event, were used to validate the simulation results. The simulated fluid depth value at a house on the alluvial fan was 7.075 m, and the measured value was 6.0 m, with a relative error of 17.91%. The model used herein can be applied to simulate debris flow-inundated areas, final fluid depths and other important debris-flow parameters.
(3) After standards of the debris-flow run-out effect analysis were established by combing the simulation results and land use data, debris-flow hazard zones under different return periods were mapped. The debris-flow hazard regions are divided into three hazard degrees: high, moderate and low. These results can provide guidance for local economic construction planning and disaster prevention and mitigation.
CONFLICT OF INTEREST
The authors confirm that this article content has no conflict of interest.
ACKNOWLEDGEMENTS
This research is supported by the Water Resources Science and Technology Innovation Project of Guangdong Province (2016-15), National Natural Science Foundation (41301301; 41301183) and Guangdong Provincial Science and Technology Plan Projects (2013B060500072; 2014A020219006; 2013B020314003; 2014A020218013).

