All published articles of this journal are available on ScienceDirect.

Numerical Analysis on Rock Breaking by Disc Cutters with Different Joint Characteristics
Authors Info & Affiliations
Abstract
Background:
With the development of tunnel engineering, shield tunneling machines (shield machines, for short) have been widely used. Tunnel projects encountered complex geological conditions.
Objective:
To study the effects of joint characteristics on rock fragment by disc cutters of tunnel boring machine.
Method:
Firstly, the 3D (three-dimensional) rock breaking process of disc cutters (cutters, for short) was simplified as a 2D (two-dimensional) problem, and the rock-breaking model with different joint characteristics by disc cutters was established by using the particle discrete element method (PFC2D). By carrying out statistical analysis on the value of cutting forces, number of cracks, rock breaking area, specific energy, the length of main cracks and changing law of their crack angles in the process of breaking rock, the effects of joint characteristics on breaking rock by disc cutters are studied.
Results:
The relationship between the joint characteristics and the cutting performance of cutters is obtained.
Conclusion:
The study shows that the weaker strength of jointed rock mass lead to the greater influence of joint dip angle on cracks and rock breaking efficiency. The stronger strength of jointed rock mass leads to the bigger main crack depth, as well as, higher specific energy. Generally, the existence of joints helps to improve the speed of excavation. However, the speed of the cutter is decreased with some certain joint characteristics. When the strength of the joint surface is 5kPa and α=135º, the specific energy reaches its minimum.
1. INTRODUCTION
With the development of tunnel engineering [1], shield machines have been widely used because of their great advantages such as high tunneling efficiency, high security and low noise [2]. Tunnel project encountered complex geological conditions [3]. S. Yagiz [4] studied the key parameters on the estimation of shield machines performance. The parameters include rock strength, toughness, discontinuity in rock mass, type of shield machines and its specifications. Based on generated database, the statistical analyses were performed between available rock properties and measured shield machines data in the field. The result revealed that rock mass properties have strong affect on shield machines performance. The mechanical properties of rocks with different weathering degree are obviously different from each other. For example, during the tunneling process of Rail Transit Line 2 of Changsha, Hunan Province, China, different weathering degrees of rock are found, such as strongly weathered argillaceous siltstone, medium weathered argillaceous siltstone, medium weathered limestone, lightly weathered limestone, strong-weathered marls and so on. In general, a crack in the weathered rock mass, which produces no obvious displacement, is called a joint (also called fracture, bedding or foliation). The strength, stiffness and deformation resistance of the jointed rock is often more than one order of magnitude than that of the non-jointed rock material. The comprehensive characteristic value, which was proposed by the Z. T. Bieniawski [5] aiming at the classification of rock and widely used in Europe and America, contains the joint spacing, joint state and other joint related factors. S. Jade et al. [6] carried out the statistical analysis of uniaxial compressive strength and of elastic modulus of jointed rock masses under different confining pressures. Properties of the rock masses with different joint fabric, with and without gouge have been considered in the above analysis. C. Gehle et al. [7] studied the breakage and shear behaviors of intermittent rock joints; different cases have been investigated in a series of direct shear tests by a new shear device, The shear behavior of such a joint constellation has been found to be composed of different phases. Under the condition of joint development (the joint spacing is ranging from 30cm to 40cm), even if the compressive strength of rock is more than 150Mpa, the excavation of disc cutters is effective. Therefore, joint characteristics (including joint inclination, joint spacing, strength of jointed rock mass, etc.) have great influence on the tunneling efficiency. Previous scholars have performed a lot of physical cutting experiments with respect to rock with joints. Based on laboratory testing and in situ observations, some comprehensive models were proposed. In these models, the significance of joint spacing on TBM performance is emphasized (A. Bruland [8]; S. Cheema [9]; N. Barton [10]). However, there seems to be a lack of complete understanding of rock cutting process due to the very complex nature of the interaction between TBM cutters and rock masses (J. Rostami et al. [11]). D. F. Howarth [12] studied the impact of spacing of a set of joints on TBM performance using a rock cutting rig in the laboratory. In his study, the strike of the joint set was parallel to the axis of the tunnel. The experimental results showed that the smaller the spacing, the less thrust force is required to penetrate to a fixed depth. C. Laughton et al. [13] proposed a joint impact index (JII) to evaluate the effect of joints on TBM performance. The length which was equal to twice bored tunnel diameter, was used as a survey unit cell length. With the increase of JII, the penetration rate increases. When the JII reaches 4~6, the penetration rate reaches the maximum. As the jointing becomes more extensive, the face itself becomes more unstable, leading to “blocky condition”, which will result in a negative influence on penetration rate. However, the randomness of physical cutting tests is obvious and therefore the test result cannot be repeated. In addition, it is difficult to observe the changing law of rock cracks.
Numerical simulation can be used to simulate the different rock-breaking cases with different parameters such as joint spacing, joint angle and the strength of jointed rock mass. By simulation, the changes of rock cracks in the rock breaking process by disc cutters can be observed. The rock breaking process is a 3D problem. Due to various practical reasons, a simplified 2D model is generally used in most of the previous studies. H. Bejari et al. [14] studied the influence of joints on the cutting tools by UDEC. It shows that the increase of joint spacing will reduce the penetration rate of cutting tools. Q. M. Gong et al. [15, 16] analyzed the rock breaking process with different joint characteristics by UDEC. H. S. Ma et al. [17] studied the direction of crack under different joint tendency conditions through two groups of experiments. Besides, FLAC is used to analyze the relationship between the direction of crack and the distribution of stress field. J. Liu et al. [18] studied the cutting efficiency of a single cutter and multi-cutters when they are cutting joint rock with different crack patterns by using PFC2D. S. Choi et al. [19] studied the influence of joint spacing and joint angle on the stress of cutters by PFC2D.
Above studies simplified the cutting process as a 2D plane problem, and ignored some impact factors such as horizontal scrolling of cutters and rock friction. It is easy to observe the growing patterns of cracks in the rock mass during the vertical invasion. However, it is difficult to obtain the crack generation patterns when cutters are rolling on rock. On the other hand, as almost all of the existing similar models with rock joint are only concerned with the joint angle and joint spacing, the influence of the strength of jointed rock mass on rock breaking process has not been fully considered yet. The contribution of this paper is that a numerical cutters-rolling-rock model with friction factors considered is established. This model is closer to the engineering application. In addition, the model is established which considers the strength of joint surface and joint angle. Its conclusion has a wide application in geological engineering.
In this paper, the rock-breaking process is simplified as a 2D problem and the cutter is rotated under the drive of the friction force. By changing the parameters of rock joints, the stress and the growing patterns of rock cracks are studied. The results provide some theoretical guidance for the construction forecast of cutters in the joint formation.
2. THE ESTABLISHMENT OF NUMERIAL MODEL OF ROCK CUTTING
2.1. Model Simplification
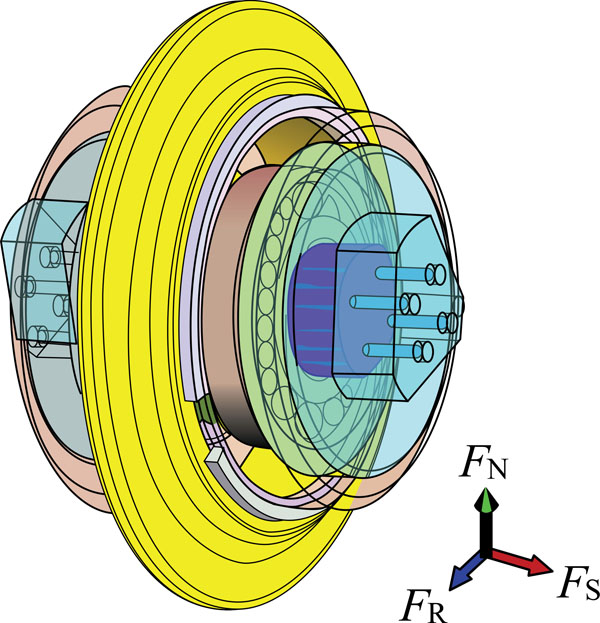
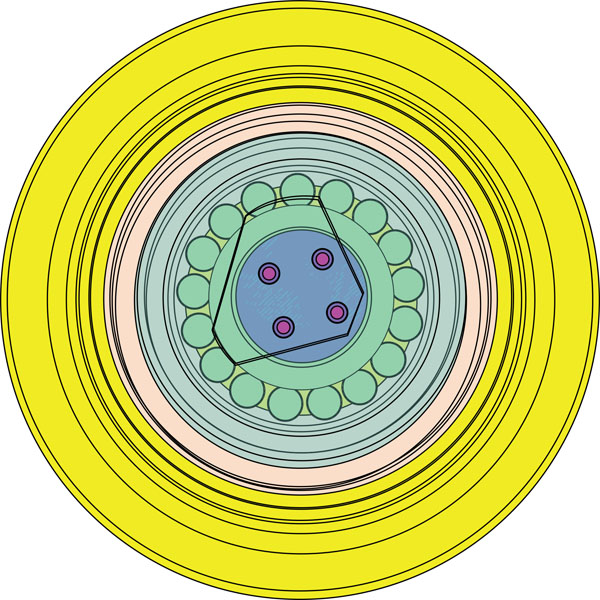
A cutter penetrates rock when the shield tunneling machine is working (depending on the tunneling surface of the ground). As Fig. (1) shows, FN is the normal force vertical to the surface Fs is the side force induced by the revolution of the cutters, and FR is the rolling force which is parallel to the working face and points to the movement direction of the cutters. The cutter head is thrusted into the tunneling surface mainly by the normal force. The rolling force is mainly provided by the torque of the cutter head. The side force is mainly derived from the extrusion pressure during the rotary operation of the cutters. Under the action of the cutter head, the cutters rotate around their axis and revolute around the center of the cutter head. The main consideration of this paper is the horizontal scroll of the cutters, and therefore the side force is further ignored in this 2D problem. In this paper, the test employed an approximate constant-cross-section cutter whose dimensional parameters are shown in Table 1. As the cutter ring is made of hardened steel, this article considered the cutter as a rigid body which is shown in Fig. (2).
|
r mm |
T mm |
d mm |
u ° |
|---|---|---|---|
| 105 | 10 | 4 | 20 |
2.2. Particle Contact Model
In particle flow method, the rock is divided into many rigid elements, and uses the explicit central difference method to solve the elements’ motion equations. These equations all satisfy the Newton's second law. The overall state of motion is given as follows:
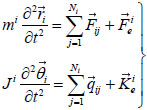 |
(1) |
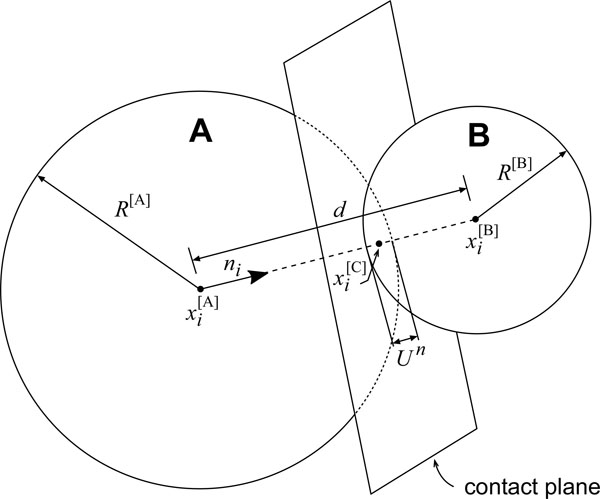
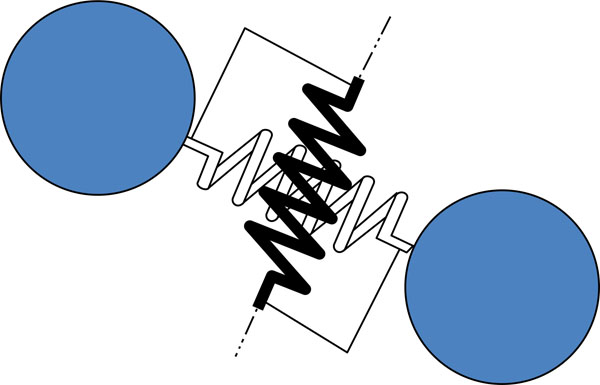
Based on the law of force displacement, the contact force can be superposed by the amount of overlapping displacement of two contact particles (balls). The contact force of the two balls, and that of the ball and the wall all occurs on the corresponding contact point. By a certain predetermined contact rule, the amount of contacted force in the given models (ball-ball model see Fig. (3), ball-wall model see Fig. (4)) can be calculated. In Fig. (3A and B) are the two particles in contact. In Fig. (4), W is the wall which can be used to simulate non-particle rigid objects, such as cutter.
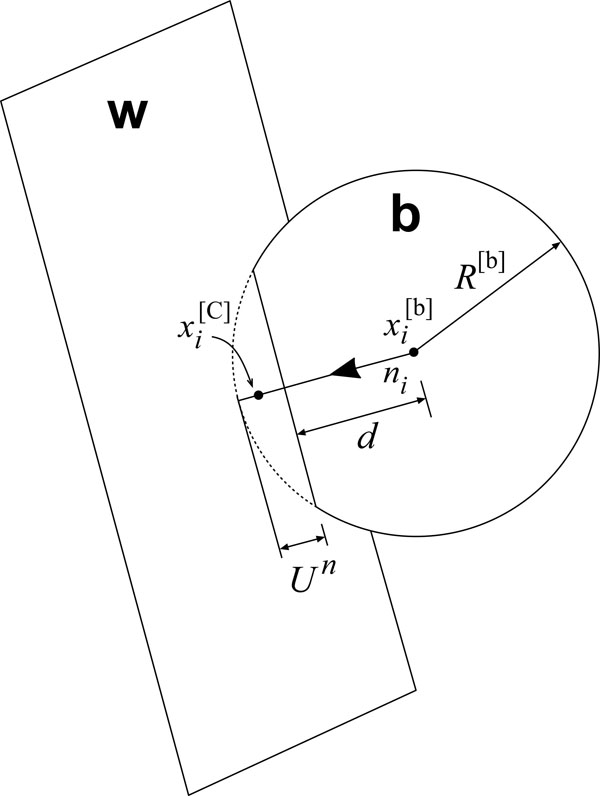
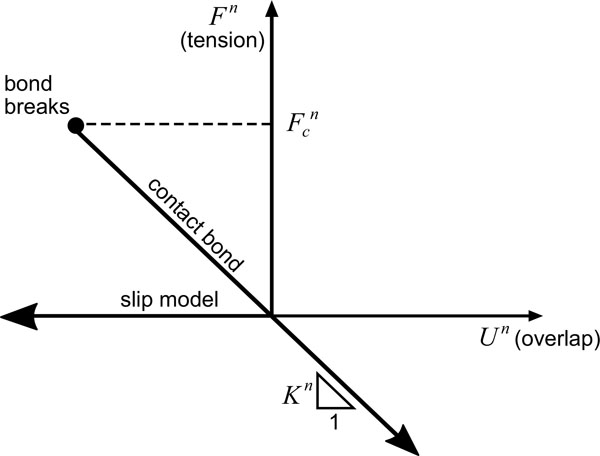
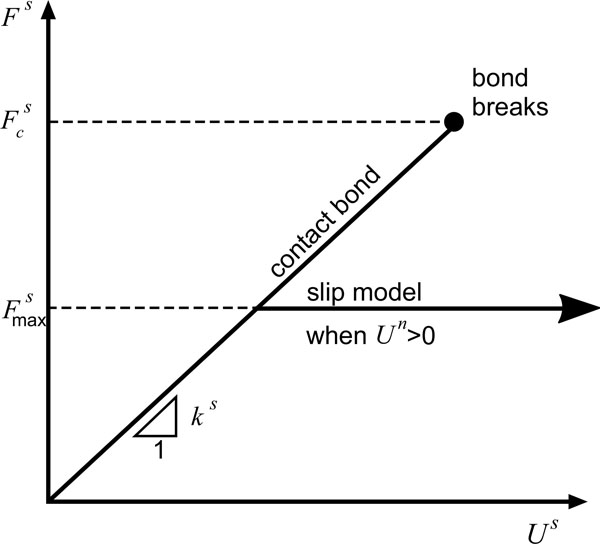
Particle contact constitutive model is expressed by the action of the contact force and the relative displacement relationship between the two entities (Fig. 5). The total contact force with respect to the displacement is determined by the normal stiffness (Fig. 6) and tangential stiffness (Fig. 7). The overall contact force constituted of the normal component
 and tangential component
 is located within the contact surface. Its expression is:
 |
(2) |
Assuming that the normal force
between the blocks is proportional to the normal “overlap” U n, like:
 |
(3) |
Actually, the “overlap” is an supposed parameter and is multiplied by kn as a measure of the normal force. For example, one can increase the value of kn or decrease Un to get the same normal force. Due to the fact that the shear force is relevant with the movement of the block and load history, the expression should be defined as a increment ∆Fn. Assume that relative displacement amount between the two bodies is ∆Un, so:
 |
(4) |
The shear force of one time can be calculated by the sum of tangential increment and the previous shear force:
 |
(5) |
2.3. Calibration of Rock Macro/Micro Parameters
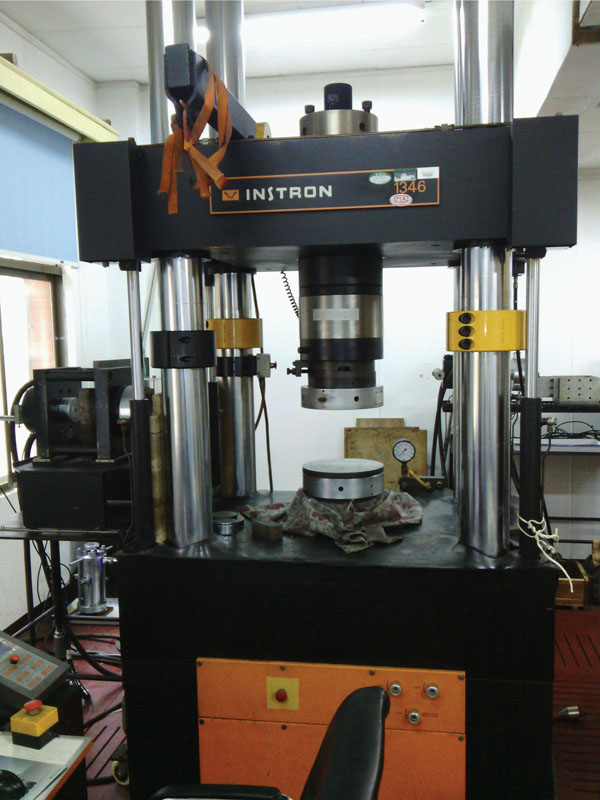
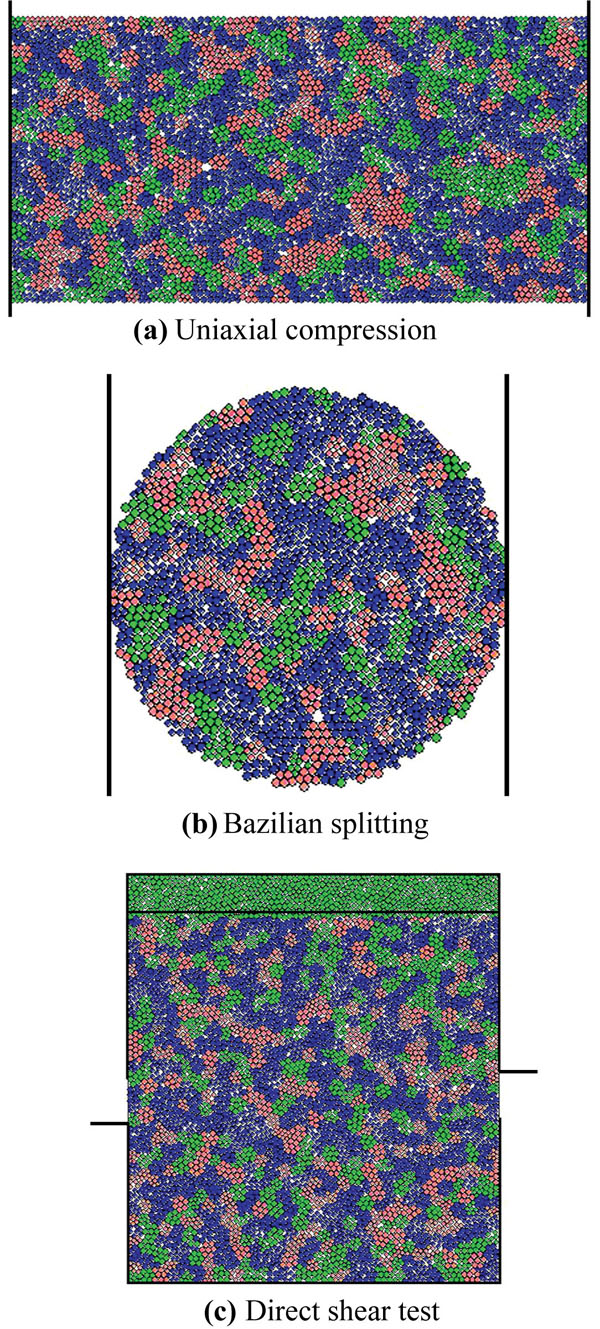
Due to the experimental conditions, soft rock is selected as the cutting object. As it is difficult to detect the original defects of natural rock, concrete samples are used to replace rock samples to increase the repeatability of the experiment in this paper. The aggregate of concrete is coarse sand. The macroscopic mechanical parameters of the concrete samples are tested on the INSTRON-1342 electro hydraulic servo control material testing machine (Fig. 8). The results are shown in Table 2. The concrete grade is equivalent to C20 whose compressive strength and other properties are close to soft rock such as natural mudstone and sandstone. In order to establish the relationship between micro-parameters of particle flow model and macroscopic mechanism of the materials, the basic sizes of particles and other parameters need to be confirmed (Table 3). The micro-parameters were calibrated by uniaxial compression tests. In Brazil split and direct shear tests (Fig. 9), the left and right walls in the uniaxial compression experiments are the servo loading plates (Fig. 9a) and then the compressive strength of the materials can be obtained. In the vertical direction, two mobile walls in the Brazilian split tests are servo loading plates (Fig. 9b). The tensile strength of the material can be obtained. In the shear test (Fig. 9c), two side walls of the upper are fixed. Both the upper polymer particle wall and the bottom wall are servo loading plates. Carrying out the direct shear test under different vertical stresses, the relationship between shear stress and shear displacement can be obtained. By extracting the peak values of shear stress, cohesion and internal friction angles can be obtained. Generally, by using the trial-and-error method, we can adjust the micro-parameters repeatedly until the curve of the output of the simulation is close to the curve of the physical calibration. The calibration parameters of the particle are shown in Table 4.
| Category | Unit | Macro-parameters |
|---|---|---|
| Ρ | kg/m3 | 2360 |
| E | GPa | 1.82 |
| σc | MPa | 21.88 |
| σt | MPa | 1.47 |
| ϑ | MPa | 4.12 |
| ɸ | ° | 35 |
| Rmin(mm) | Rmax/Rmin | kn⁄ks |
|---|---|---|
| 0.3 | 1.2 | 2.5 |
| Category | Unit | Micro-parameter |
|---|---|---|
| ρ | kg/m3 | 2950 |
| σn | MPa | 15 |
| σs | MPa | 15 |
| kn | N/m | 9.5×10⁸ |
| ks | N/m | 3.8×10⁸ |
| μ | 0.3 |
2.4. Establishment of Numerical Model
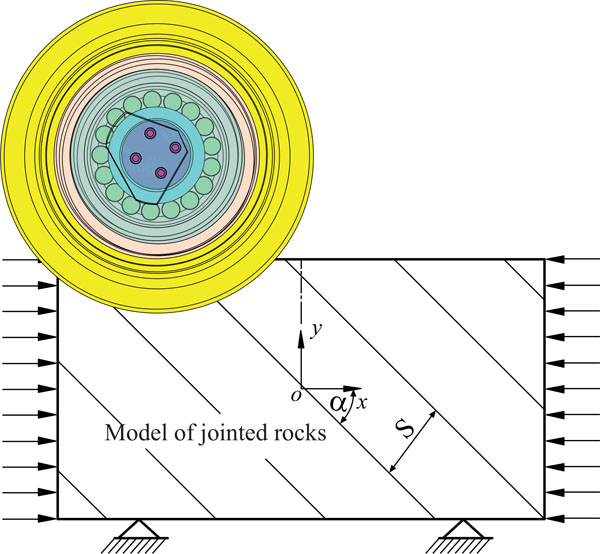
Based on the above physical and mechanical parameters of the concrete samples, the related microscopic parameters of the particle flow code are determined by using PFC2D. Based on the above work, the rock-breaking model with joint by a cutter (Fig. 10) is established. x and y are the moving directions of the cutter, S is the joint spacing, α is the joint inclination. The sample is placed at a square groove which is surrounded by three fixed walls. The size of the model is 400mm ×200mm. Joint characteristics of the joint model are set by the JSET command. Since the stiffness of the cutter is much greater than soft rock, the cutter will be treated as a rigid body with the property of wall type. The bearings in the cutter are replaced by a hinge. The cutter rolls on rock surface under the drive of the friction generated by the contacting surface. We can obtain useful information such as stress distribution of the cutter ring by implying the FISH statements. The contact friction coefficients between the cutter and rock is set as 0.3. In the simulation, rock failure can be considered as the key connection between particles during the loading process under the action of faults. There are two forms of key joints, namely contact and parallel keys. By setting the size/strength of the key and particle, different constitutive models are expressed. When the load exceeds the preset bond strength, it will make the particles broke away from contact and then make them destroyed. Macro cracks and statistical micro-cracks which are generated underneath the rock mass can be observed in the simulation.
3. ANALYSIS OF THE EFFECTS OF JOINT CHARACTERISTICS ON ROCK-BREAKING PROCESS BY THE CUTTER
3.1. Visual Analysis of the Rock Breaking Effect of the Disc Cutter
Joint characteristics have great influence on the cutting mechanism of the cutter. The joint distribution characteristics in nature rock is generally complex, and the relative position of the cutter and joints is changing constantly. As for this, some necessary simplification has been done in this paper. It assumes that there only exists one group of equally distributed joints in this numerical model (S=40mm). The rock strength is indirectly designed by the micro-parameters of particles (friction coefficient, normal intension, tangential intension) of the joint surface. By changing the micro-parameters of particles of the joint surface, different strength of joint rock with different cohesion and angle of internal friction, specific values of joint strength can be obtained by direct shear experiment.
It can be found that when μ is constant (i.e. set μ to be 0.3), with the normal and shear strength increases, the intensity of jointed rock mass increases. In this paper, we use three joint surface strength (5kPa/50kPa/500kPa) to describe various intensity in the joint (low strength of the joint/ medium strength of the joint/ high strength of the joint).
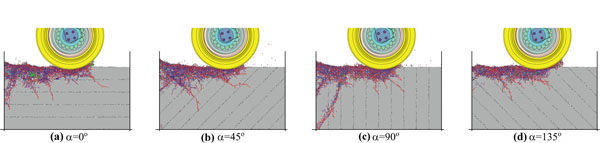
With different joint characteristics, the rock-breaking state diagrams of the cutter are shown in Figs. (11-13) (J=250mm, p=8mm,v=0.1m/s). In Fig. (11), connection strength of joint surface is 5kPa, so its intensity is low. From the Fig. (11a-d), it can be observed that the main crack rarely extends inward. There are few main cracks generated in the internal parts of rock mass, as low-strength joint surface is easy to be penetrated and it will constrain the cutter force from transmitting to the deeper side. From these subgraphs, we can draw the conclusion that there are a large number of fragments collapsed from the rock surface; most of crack initiation direction is perpendicular to the joint plane. In Fig. (12), connection strength of joint plane is 50kPa. Its intensity is moderate. When the joint angle is 0° or 45°, it can be observed that the main crack tends to perpendicularly propagate to the joint surface. Some main cracks can span much more widely and deeply. It means that comparing with the barrier effect of high joint surface on crack propagation, low joint surface intensity have a more effect.
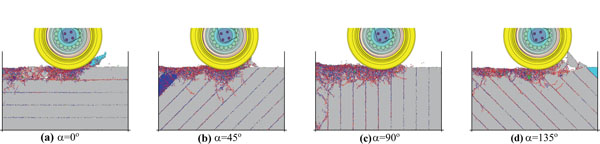
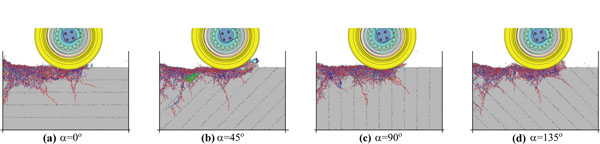
When the joint angle is 90° or 135°, it shows that the direction of the main crack tends to be parallel to the joint surface. In Fig. (13), connection strength of joint plane is 500kPa. Its intensity is comparatively high. The joint has little effect on the depth of crack propagation. Because of the influence of joint angles, propagation angles of the main crack still have certain regularity.
3.2. The Effect of Joint Characteristics on Crack Angle
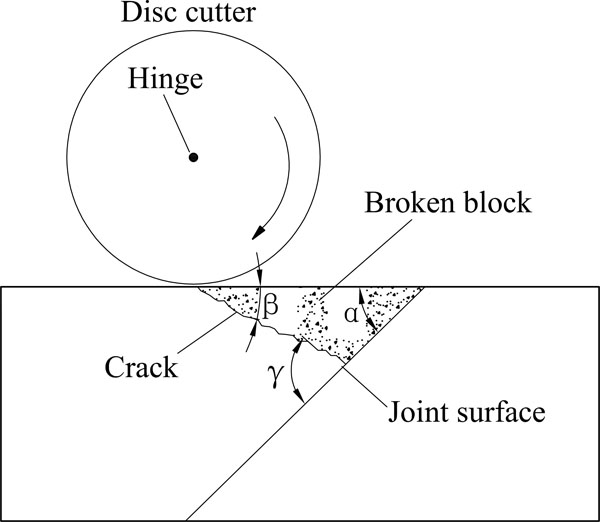
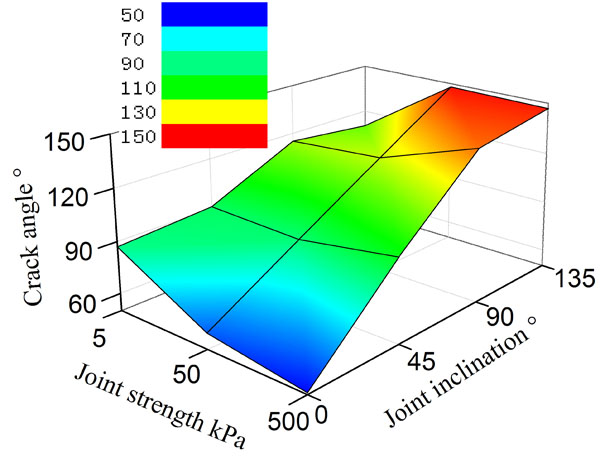
As shown in Fig. (14), the angle between the joint plane and the horizontal plane is defined as a joint angle α. The angle between the main crack and the horizontal plane angle is defined as the β. The angle between the main crack and the joint plane is defined as crack angle γ. Obviously, γ = α + β. As Fig. (15) shows, when the strength of joint surface is 5kPa, γ is always within 90° ± 30°. This conclusion is consistent with the research of H. S. Ma et al. [17]. When the strength of joint surface is 50kPa, γ increases with the increasing of α. When the strength of joint surface is 500kPa, γ is similar to the condition in which the connection strength of joint plane is 50kPa. When the connection strength of joint plane reaches a certain level, the deflection of γ tends to be stable.
3.3. The Effect of Joint Characteristics on the Number of Micro Cracks
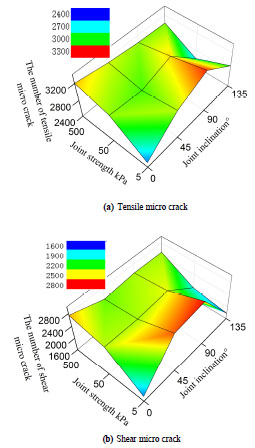
The association rules of the number of micro cracks and the joint characteristics are shown in Fig. (16). When the strength of joint surface is high, the effect of the number of micro cracks on α decreases, and when the strength of joint surface is low, the number of micro cracks have greater fluctuation with the changing value of joint angle α. When the strength of joint surfaces is 5kPa and the joint angle is 90°, the most favorable condition for the development of micro cracks is obtained and the number of average tensile micro cracks is more than the number of shear micro cracks. Due to the limitation of the 2D simulation, the number of micro cracks cannot directly reflect the speed and tunneling efficiency.
3.4. Influence of Joint Characteristics on Crack Depth
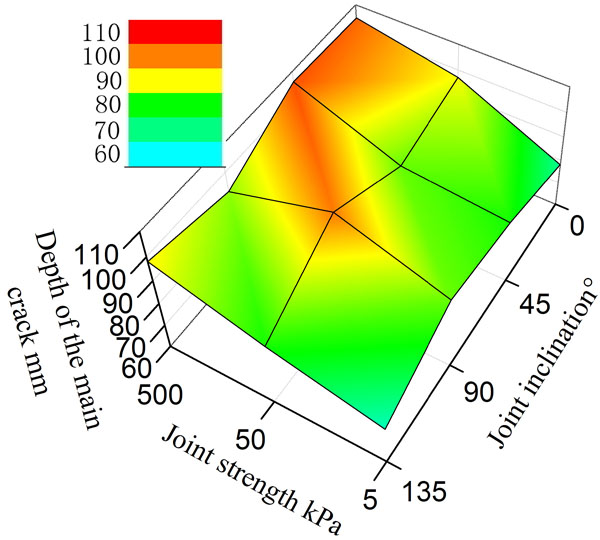
The strength of the joint surface and α has significant effect on the depth of the main crack. Low strength joint surfaces are good for crack initiation [17] while it will hinder the main crack from expanding. α could change the propagation direction of the main crack, leading to the change of the crack depth.
The main crack cannot effectively contribute to the exfoliation of rock, since it consumes a lot of work done by the cutting forces. Therefore, a large crack depth may not have a direct benefit for improving the rock-breaking efficiency. The changing discipline of the main crack’s average depth shows that Fig. (17): for high-strength joint surface, it is easy for the main crack to extend to the deeper side of the rock mass. The lower the strength of joint surface, the smaller depth the main crack can reach. It implies that the low strength joint surface can improve the rock-breaking efficiency.
3.5. Influence of Joint Characteristics on Rock Crushing Area
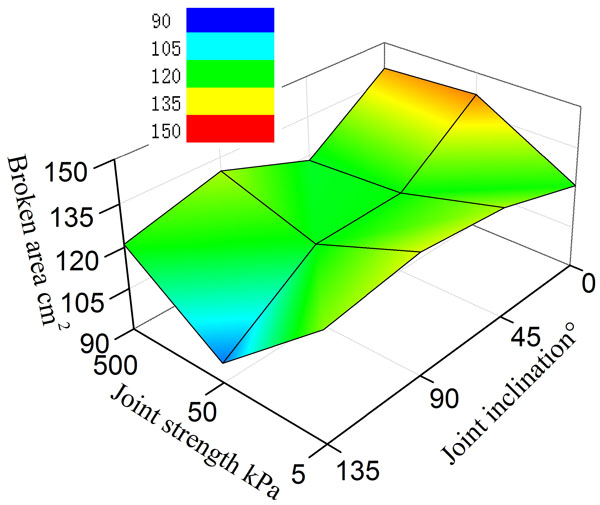
As for the given penetration depth, a larger broken area means a faster tunneling rate. By the auto measurement in CAD, the change discipline of rock-breaking area can be obtained (Fig. 18): the influence of joint orientation on the broken area is greater. As for the same intensity of joint surface, the broken area with 90° and 0° joint orientation is larger than other cases. The broken area will take the minimum when the strength of joint surface is 50kPa and α is 135°. It implies that this case is not conducive to improving the advance rate.
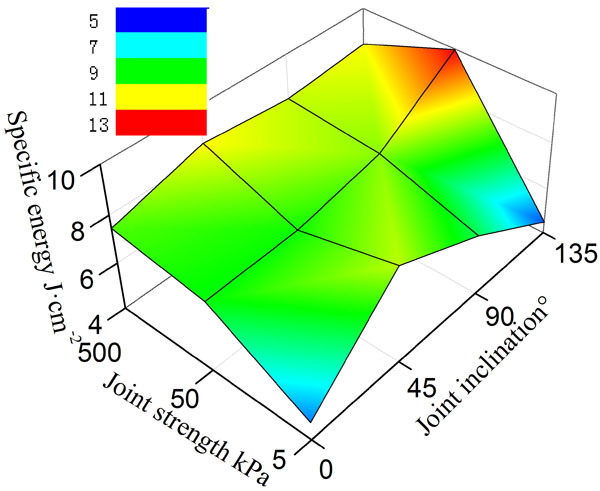
3.6. Influence of Joint Characteristics on Specific Energy Consumption
The specific energy (SE) is often used to index the rock-breaking efficiency. It is defined as the energy consumed by the cutter cutting the unit volume rock. The lower the specific energy, the higher is the rock-breaking efficiency.
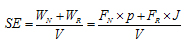 |
(6) |
Generally, the work done by the normal force just account for 5% of the work done by the rolling force. Therefore, the normal force can be ignored in the actual calculation. Due to the limitation of 2D simulation, the crushing block cannot be discharged (Fig. 11d). The graph shows that the rock collapsed under the action of the squeeze by the cutter and therefore the rolling force increased. If bulk rock caving is observed in the simulation, the rolling force needs to be corrected by being multiplied by the coefficient g (g=0~1), which will make the simulation results more reasonable for the construction site.
Finally, Table 5 can be obtained by statistical analysis. According to the Table 5, the specific energy trend chart can be drawn (Fig. 19). As it can be seen in the figure, with the low strength joint surface, α is obviously related with specific energy. However, with the high strength joint surface, α has little impact on specific energy. Generally, the weaker the strength of joint surface, the lower is the specific energy. It shows that the low strength joint surface often prevents the main crack from propagating in the rock mass, reduces the reactive power dissipation of the cutter and improves the rock-breaking efficiency. As for the high strength joint surface, it is not easy to hinder the propagation of the main crack in the rock mass, and the rock-breaking efficiency is low. In general, the most favorable value of α is 0 and then the rolling-cutting efficiency is improved. With the low strength joint surface, the specific energy will get the minimum value when α is 135°. In this case, it is easy to form a triangle broken area (see Fig. 11d). With the high strength joint surface, the specific energy will be higher when α=135°. In this situation, the joint surface is not easy to be broken. When the strength of joint surface is 500kPa, the rock-breaking efficiency will be higher when α is 0° or 90°. When the strength of joint surface is 50kPa, the rock-breaking efficiency will be higher when α is 0° or 45°. When the strength of joint surface is 5kPa, the rock-breaking efficiency will be higher when α is 0° or 135°.
| Joint strength | Joint orientation | Rolling force | Broken area | Specific energy | |
|---|---|---|---|---|---|
| kPa | ° | kN | cm2 | J·cm-2 | |
| 5 | 0 | 2.30 | 121 | 4.75 | |
| 45 | 4.2 | 130 | 8.08 | ||
| 90 | 3.47 | 133 | 6.54 | ||
| 135 | 2.30 | 128 | 4.49 | ||
| 50 | 0 | 3.95 | 142 | 6.95 | |
| 45 | 3.41 | 120 | 7.08 | ||
| 90 | 3.72 | 119 | 7.80 | ||
| 135 | 3.86 | 97 | 9.97 | ||
| 500 | 0 | 4.18 | 140 | 7.45 | |
| 45 | 4.02 | 118 | 8.49 | ||
| 90 | 4.25 | 130 | 8.16 | ||
| 135 | 4.09 | 121 | 8.48 | ||
CONCLUSION
The paper demonstrates how to use the bonded discrete element method (PFC2D) to study the rock-breaking process by a cutter, and how to evaluate the influence of impact factors such as joint strength and joint inclination on crack angle, number of cracks, depth of the main crack, broken area, and specific energy. The conclusions are listed as follows:
(1). α has a little effect on the number of micro cracks under high strength joint surface while it has considerable impact on the number of micro cracks under low strength joint surface. When the strength of the joint surface is weak, α has a great impact on γ. When α is 45°, γ is almost perpendicular to the joint surface.
(2). In general, the area of rock crushing will increase due to the joint. However, when the strength of the joint surface is 50kPa and α is 135°, the rock crushing area reaches it minimum.
(3). Low strength joint surface is the barrier to the main crack propagation, reducing the reactive power dissipation of disc cutter and improving the efficiency of rock breaking. In comparison, the rock breaking efficiency of high strength joint is low.
(4). Joint orientation will have a greater effect on the specific energy when the strength of the joint surface is weaker. The specific energy will be minimum when the strength of the joint surface is 5kPa and α is 135°.
Further research could be concentrated on the multi-parameter coupling known as joint strength, joint spacing and joint angle. And also, it is important to use statistical analysis tools, such as analysis of variance (ANOVA), to carry out much deeper research and obtain the best parameter influenced disc cutter rock broken.
LIST OF ABBREVIATIONS
| FN | = The vertical force on disc cutter |
| FR | = The rolling force on disc cutter |
| FS | = The lateral force on disc cutter |
| r | = Radius of disc cutter |
| T | = Width of cutting edge |
| d | = Transitional Radius |
| u | = Cutting edge angle |
| mi | = The quality of element I |
| Ji | = Rotary inertia of element I |
 |
= The central location of element I |
 |
= The central angle vector of element I |
 |
= The acting force of the neighboring element J on the element I |
 |
= The arm of force between the center of element I and element J |
 |
= The external force of element I |
 |
= The external moment of element I |
| Ni | = Number of adjacent elements of element I |
| N | = The total number of elements in the model |
| R | = The radius of particle |
| D | = Two particle center distance or the center to the wall of the shortest distance |
 |
= The displacement vector of the center of particle A |
 |
= The displacement vector of the center of particle B |
 |
= The vector of wall displacement |
| ni | = The unit normal vector when particles contact (The shortest distance direction of the contact center of Particle-wall to the wall) |
|
|
= The normal component of the contact force |
|
|
= The tangential component of the contact force |
| kn | = Normal stiffness |
| ks | = Shearing rigidity |
| ρ | = Material density |
| E | = Elastic modulus |
| σc | = Compressive strength about rock |
| σt | = Tensile strength about rock |
| ϑ | = Cohesion power |
| ɸ | = Internal friction angle |
| μ | = Friction coefficient |
| σn | = Normal strength |
| σs | = Tangential strength |
| vx | = Horizontal velocity |
| vy | = Penetration rate |
| S | = Joint spacing |
| p | = Penetration depth |
| v | = Cutting speed |
| J | = Cutting distance |
| V | = Crushed pits volume |
| α | = Joint orientation |
| β | = Angle between the main crack and the horizontal plane |
| γ | = Crack angle |
| SE | = Specific energy |
| WN | = Normal force work |
| WR | = Rolling force work |
CONFLICT OF INTEREST
The authors confirm that this article content has no conflict of interest.
ACKNOWLEDGEMENTS
This research was supported by National Program on Key Basic Research Project of China (2013CB035401), National Natural Science Foundation of China (51274252), and National Natural Science Foundation of China (2014FJ1002).

