All published articles of this journal are available on ScienceDirect.
Spatial Distribution Features of Debris Flows at Active Fault Zone Along Ya-Lu Highway, China
Abstract
Introduction:
Active faults and accompanied tectonic activities are a key triggering factor for debris flows in mountainous region. In this paper, the spatial distribution of 19 debris flows along Ya-Lu highway in western China was analyzed.
Method:
We collected basic data of these 19 debris-flow gullies in the in-situ investigation work, and documented key parameters including watershed area, the averaged slope gradient, gully type, debris-flow magnitude, and developing stage of the gully. Based on the DTM data from SRTM database, the overall spatial distribution features of these debris flows are analyzed.
Result and Conclusion:
We used a polar coordinate system to illustrate the relationship between debris flow magnitude and the direct distance to the active fault. In this system, the spatial distribution of these debris flows is represented by the vertical distance to the fault and the angle between gullies to the fault. It is revealed that the debris-flow magnitude has a close positive relationship with the vertical distance to the active fault, that generally debris-flow magnitude increases as closing to the active fault.
1. INTRODUCTION
Debris flows are one of the most common geomorphic phenomena in mountainous areas. They have been defined as mass movements consisting of granular solids, water and air moving as a viscous flow [1]. It is widely accepted that debris flows are one of the principal causes of loss of life and property around the world [2-4]. As such, there is a pressing need to know the debris-flow magnitude when applying a countermeasure to mitigate debris flow. Debris-flow magnitude is sensitive to many environmental variables, including rainfall strength, recharge rate, sediment erosion [5].
Previous studies have indicated that debris flows are the result of a complex interaction between environmental and human factors under certain pluviometry conditions [6]. These factors often fall into a number of categories, such as geomorphic, geological, land use/land cover, and hydrological factors [7-9]. Studies have long substantiated that climate condition is a major factor controlling the initiation of debris flows [10, 11]. Except for the climate or the geomorphic factors, geological factor also significantly affects the debris flows. Active faults are important geological structure for triggering debris flows because it is a common wisdom that the generated tectonic activities in the fault zone directly increase the sediment in the debris-flow gully [12].
Current studies often link the concentration of landslides or debris flows to the fault or the accompanied tectonic activities. For instance, Lorente et al. [6] introduced the spatial distribution of debris flows in central Spanish pyrenees. They indicated that loosen material from strongly tectonic activities is one factor explaining the debris flow spatial distribution. Zhuang et al. [13, 14] monstrated a close relationship between landslides and post-earthquake debris flows and active faults. Wei et al. [14] also implied that concentration of landslides and debris flows significantly decreases with the increase of the distance to the fault. Qi et al. [15] further described that 6290 landslides occurred within the buffer zone of 0–10 km distance to faults or surface ruptures, accounting for about 47.3% of the total landslides in the study region. Same conclusions were also given in Keefer [16, 17], Khazai and Sitar et al. [18]. As a remark, it has been substantiated that the concentration of debris flows has a close relationship to the active fault. However, studies regarding the relationship between debris flow magnitudes with active faults are rather rare.
In order to give an intuitive relationship between debris-flow magnitude and the active fault, we collected in-situ data of 19 debris-flow gullies along Ya-Lu highway in western China after the devastating Ms 8.0 earthquake of Wenchuan area occurred in May 12, 2008. Ya (Ya’an)-Lu (Lugu) highway, which locates within the borders of Ya’an City and Liangshan State in the southwest of Sichuan Province, is one of the major highway construction projects during the 11th Five-Year Plan. All the highway lines at the junction area of the Qinghai-Tibet Plateau and western Sichuan Basin, comparing to other highways, owning to its complicated terrain, geology, and high intensity of earthquake, it becomes more difficult for designing.
The most influential geological structures within the area along the highway are the active fault ruptures, including Longmenshan active fault rupture, Xianshuihe active fault rupture, and Anninghe active fault rupture. Composed by these three fault ruptures (blue lines in Fig. 1), this Y-shaped active fault zone as shown in Fig. (1) is widely regarded as an intense seismic active zone [19]. Due to its influence, as well as the complex geology and meteorology conditions, the geo-hazards along this highway are widely developed, especially the debris flows, which are regarded as an enormous threaten to the operation safety of Ya-Lu highway.
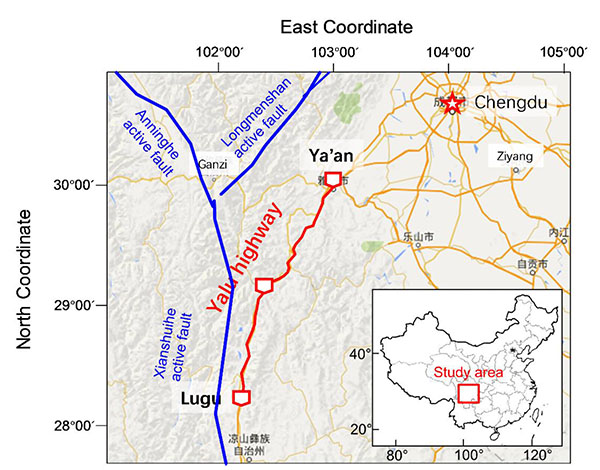
In many studies, the focus was on the relation between debris flow and the triggering seismic factors, such as the magnitude and mechanisms of the event. In this paper, this will be done by analyzing the relation with the distance and angle to the fault rupture. For this purpose, field investigation work of debris flow gullies in this area was conducted, Then the development characteristics of debris flow gullies were summarized, and the relationship between debris flow space position and its scale is also proposed with the introduction the distances and angles between debris flow gully and active rupture. This study may also be useful for the overall mitigation plan for Ya-Lu highway.
2. STUDY AREA AND DATA SOURCE
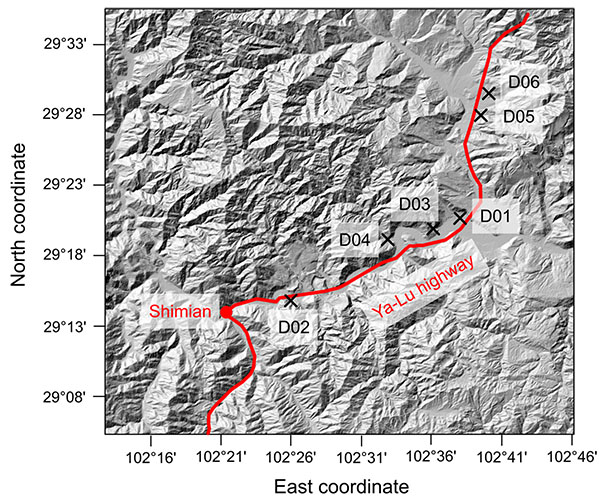
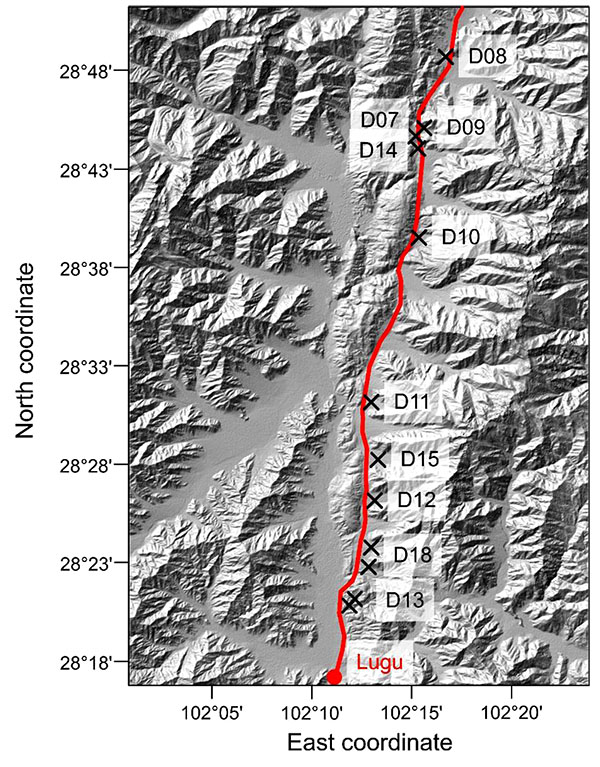
Based on the field investigation work, totally 25 gullies are found in the area, 6 gullies of which are verified to be flood channels, while rest 19 gullies are debris flow gullies. Using the 30-m resolution DTM, we extracted these 19 debris flow gullies. 6 gullies distributed in Ya’an-Shimian region Fig. (2), and 13 gullies in Shimian-Lugu region Fig. (3). To all 19 debris flow gullies in the area, intense heavy rainfall is the mainly triggering factor, when the soft loose materials accumulating to certain mount as influence by wind erosion and the activity of fault ruptures. As listed in the Table 1, almost all the debris flow gullies are identified as channel debris flow (C-type as marked in Table 1), which usually defined as happening in a evident channel, and only one named Shengjia gully is slope debris flow (S-type as marked in Table 1), which is sometimes similar with the landslide or debris avalanches.
For debris flow watershed morphology, by comparison, 11 gullies are developed in the watershed area with the acreage larger than 5 km2, 4 are developed in the watershed area with the acreage ranges from 5 km2 to 1 km2, and rest 4 are developed in the watershed area with the acreage smaller than 1 km2. Average hill slope gradients of these debris flow gullies are between 15% and 35%, with 16 debris flow gullies. It indicates that debris flow in this area are almost concentrating in the watershed with the acreage larger than 5km2 and slope gradient ranging between15% and 35%, and this kind of morphology is more prone for the accumulation of loose soft material participating in the debris flow process.
We list major parameters to represent the features of debris flow gullies in Table 1. Watershed area and averaged slope gradient are used to describe the catchment morphology. Distance to the active fault and angle between the gully to active fault are used to show the spatial features of debris flow gullies to the fault. While gully type, scale, and developing stage represent the debris flow magnitude. For the development characteristic, by investigation, debris flow in 11 gullies are recognized as medium scale debris flow (M as marked in Table 1), with the possible peak discharge ranging from 50~100m3/s, and deposition amount ranging from 10,000~100,000m3. 6 are recognized as small scale debris flow (S as marked in Table 1), with the possible peak discharge smaller than 50 m3/s, and deposition amount less than 10,000m3.
Only 2 are recognized as large scale debris flow (L as marked in Table 1), with the possible peak discharge ranging from 100~200 m3/s, and deposition amount ranging from 100,000~1,000,000 m3. Based by the hyper entropy theoretic proposed by Jiang [19], three developing stages including evolution stage (E), prime stage (P), and decline stage (D) for the debris flow gully development period are divided, in this area there are 7, 11, and 1 respectively, which indicates that the debris flow activities along Ya-Lu highway are rather intense in these decades.
| No. | Name | Watershed area (km2) |
Averaged slope gradient (%) | Distance to the active fault (km) | Angle between channel to active fault (°) | Gully type | Scale | Developing stage |
|---|---|---|---|---|---|---|---|---|
| D01 | Guanjia Gully | 6.11 | 23.3 | 35.85 | 14.54 | C-type | M | P |
| D02 | Xiaoheda Gully | 48.59 | 14.5 | 17.73 | 5.19 | C-type | L | P |
| D03 | Tianbagan Gully | 8.01 | 30.56 | 34.21 | 23.07 | C-type | M | E |
| D04 | Shengjia Gully | 1.24 | 42.32 | 34.95 | 27.04 | S-type | M | P |
| D05 | Xiaosha Gully | 1.74 | 35.3 | 41.92 | 26.55 | C-type | M | P |
| D06 | Dasha Gully | 12.57 | 21.49 | 44.93 | 51.07 | C-type | M | P |
| D07 | Yejidong Gully | 0.97 | 21.57 | 2.37 | 29.13 | C-type | M | P |
| D08 | Xiaogouer Gully | 12.85 | 15.73 | 1.01 | 42.76 | C-type | M | E |
| D09 | Que’er Gully | 14.08 | 15.73 | 1.64 | 51.33 | C-type | M | D |
| D10 | Shekeniluo Gully | 0.77 | 26.97 | 2.21 | 67.51 | C-type | M | P |
| D11 | Tuobie Gully | 19.99 | 22.9 | 2.08 | 88.82 | S-type | S | E |
| D12 | Ma’an Gully | 10.68 | 32.2 | 2.21 | 73.23 | C-type | M | E |
| D13 | Chunhe Gully | 11.79 | 17.9 | 2.67 | 89.21 | C-type | S | P |
| D14 | Lamafang Gully | 4.23 | 17.7 | 3.51 | 70.31 | C-type | S | E |
| D15 | Geli Gully | 16.99 | 31.5 | 0.31 | 76.66 | C-type | L | P |
| D16 | Shihuiyao Gully | 5.81 | 29.1 | 1.79 | 75.27 | C-type | M | P |
| D17 | Tiaoshui Gully | 0.83 | 31 | 3.56 | 48.26 | C-type | S | E |
| D18 | Xiaobaozi Gully | 1.94 | 25.6 | 4.1 | 21.82 | C-type | S | P |
| D19 | Shilong Gully | 0.41 | 21.2 | 5.45 | 86.53 | C-type | S | E |
3. METHOD AND RESULTS
The area from Ya’an to Shimian is the basin region where hills surrounding the gully are low, with the elevation between 1,500~2,000 m. While the area from Shimian to Lugu is valley region where hills are abrupt, with the elevation between 2,000 m to 2,500 m, and are prone for the debris flow initiation as shown in Fig. (4). For the space distribution characteristics, what should be noticed is that there are only 6 debris flow channels within the highway of Ya’an to Shimian, with the debris flow distribution density of 0.062/km as shown in Fig. (2). 13 gullies within the highway of Shimian to Lugu, with the debris flow distribution density of 0.091/km as shown in Fig. (3), almost 1.5 times more than the area of Ya’an to Shimian. This space distribution feature is related to the topography distinguish of two areas and influence by the active fault rupture.

It also can be observed that debris flow gullies are mostly concentrated in the regions along the active fault ruptures. Especially for the gullies that influenced by Anninghe active fault rupture (D07~D19), distances from debris gully to the Anninghe active fault rupture are within 5 km. More can be found that with the decrease of distance, both the scale and frequency of debris flow are increasing. For the gullies locate in Shimian to Lugu region, although the space relationship between debris flow gully and active fault rupture are not evident, other phenomenon can be found that due to the influence by multiple active fault rupture, the scales of debris flow locate in Ya’an to Shimian region are more huge. Thus the conclusion that debris flows, both in scale and space distribution are evidently influenced and even controlled by the active fault ruptures, can be obtained.
In order to further more analyze the relationship of debris flow and a certain fault rupture, gullies in the Shimian-Lugu region are selected. The distances of debris flow gullies to rupture, the angles between directions of debris flow gullies to rupture, and debris flow scales are considered. Then a polar coordinate system is created as described by the following equation:
 |
(1) |
Where Im is the position of vertical axis, Re is the position of horizontal axis, r is the distance between debris flow gully and active rupture (km), and θ is the angle between directions of debris flow gully and active rupture (°). According to Eq.(1), position of gullies in the a polar coordinate system can be calculated, and debris flow scales are distinguished by different colors, as shown in (Fig. 5).
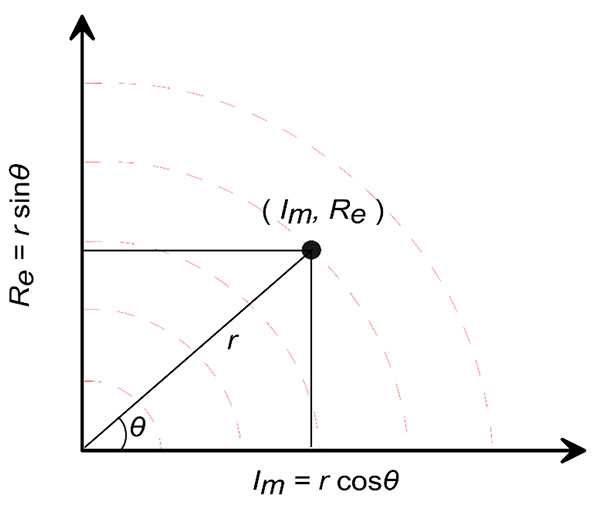
Fig. (6) indicates that the scale of debris flow relates to the space relationship of the gully and active fault rupture. Fig. (6a) shows this relationship of 13 gullies in Ya’an-Shimian region, which are affected majorly by Anninghe active fault. Fig. (6b) shows the relationship of 6 gullies in Shimian-Lugu region, which are majorly affected by Longmenshan and Anninghe active faults. Spatial distribution can be described with the factors of distance r and direction angle θ. In the figure, we use grey semi-circle zones to delineate different magnitudes of debris flows as implied in the spatial distribution of the data scatters. It is revealed that the factor r (distance from the scatter to the origin) roughly controls the debris flow magnitude. With the decrease of r, it has an enlargement trend for debris flow magnitude, this is also approximate to the proposed relationship between landslide and active fault rupture [20-22].
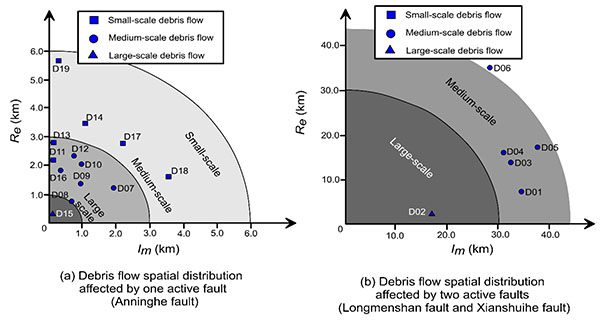
Fig. (6) indicates that the distance r is the main factor that controls debris flow magnitude in this polar coordinate, although direction angle θ also plays a role in affecting magnitude. As shown in Fig. (6a), D11 and D13 have the comparable distances to the origin with D12 and D10, however, their magnitudes are smaller. Comparing the spatial distribution in Figs. (6a and 6b), we also notice that although the gullies of D01 to D06 are far from the both faults, the magnitude of these debris flows are comparable to the 13 gullies that close to one fault. It supports that active faults are a dominating factor influencing the debris flow magnitude.
4. DISCUSSION
In this paper, we discussed the spatial distribution features of debris flows at the active fault zone in southwestern Sichuan area, China. A close relationship between debris-flow magnitude and spatial distribution features (i.e., the minimum distance to the fault and direction angle of debris flow gully and fault) has been indicated. However, the explored relationship is based on the in-situ investigation data of 19 debris-flow events in one active fault zone. The insufficiency of the data source somewhat limits the further analysis on the detailed quantitative relationship. Currently, we are still working on collecting the data of debris flow events from in-situ investigation and previous literatures.
Another limitation in the current study is the quantitative learning of the relation between the number of faults and debris flow magnitude. In Fig. (6), the gullies of D01 to D06 are controlled by two faults, although the distances from these gullies to either fault is much greater than D07~D19, the magnitude of these debris flows are comparable. it is shown that the number of the faults in the zone plays an important role to control the debris flow magnitude. However, due to the insufficiency of the data source in two-fault zone, this relationship is difficult to quantitatively evaluate.
CONCLUSION
Debris flows are most frequent in the mountainous region of western China. In our in-situ investigation work for geo-hazards along the newly built Ya-Lu highway, we found 19 debris flows gullies, with 6 gullies in Ya’an-Shimian region, and 13 gullies in Shimian-Lugu region. We collected basic data of these 19 debris-flow gullies, and documented the key parameters. The parameters of watershed area and averaged slope gradient are used to describe the watershed morphology, while gully type and developing stage of the gully are used to describe debris-flow scale.
The collected data were used to study the relationship between debris flows and active fault in this region. Using a 30-m resolution DTM, these 19 debris-flow gullies were extracted. Two parameters were measured to represent the spatial distribution of these gullies, i.e., the distance of debris flow gully to fault, and the angle between the debris flow gully and the fault. We used a polar coordinate system to illustrate the relationship between debris flow magnitude and vertical distance to the active fault.
The analyzed results indicate that the debris-flow magnitude has a close positive relationship with the vertical distance to the active fault. Debris-flow magnitude significantly increases as closing the active fault, although the other factor.
ETHICS APPROVAL AND CONSENT TO PARTICIPATE
Not applicable.
HUMAN AND ANIMAL RIGHTS
No Animals/Humans were used for studies that are base of this research.
CONSENT FOR PUBLICATION
Not applicable.
CONFLICT OF INTEREST
The authors declare no conflict of interest, financial or otherwise.
ACKNOWLEDGEMENTS
This study was financially supported by the National Key R&D Program of China (Grant No. 2017YFB1201204, Z. Han); the Foundation of State Key Laboratory of Geo-hazard Prevention and Geo-environment Protection (Grant No. SKLGP2017K014, Z. Han); and the National Natural Science Foundation of China (Grant No. 51378509, J. Huang, Grant No. 51478483, W. Wang, and Grant No. 41502295, Y. Li).


