All published articles of this journal are available on ScienceDirect.
Assessment of the Current State of Internal Force and the Optimization of Cable Force for an Existing Long-span Pre-Stressed Concrete (PC) Cable-stayed Bridge
Abstract
Introduction:
Due to the influence of load, fatigue, corrosion, natural material aging and other long-term adverse factors, the state of the internal force of a cable-stayed bridge will be changed. These long-term effects can result in the bridge not meeting specified functional requirements, and potentially resulting in structural failure. This investigation focuses on the parameter identification of a girder for a pre-stressed concrete (PC) cable-stayed bridge. Without considering the influence of cable relaxation and temperature on the girder’s geometric shape, an improved method based on the “cable force-girder’s displacement” relationship is proposed.
Method:
In this method, measurement variations of displacement and cable force are simultaneously obtained, enabling the use of an optimization method to identify parameters which need to be resolved. To verify the proposed method, a single pylon PC cable stayed bridge (2×160m) is selected as a case study. For the state of internal force, results from the case study bridge indicate that the crack resistance value of the girder no longer satisfies the demand of Generalized codes for design of highway bridges and culverts(JTG D60-2004,in Chinese). In order to adjust the internal force, cable force optimization was undertaken, whereby bending energy was taken as the objective function.
Result:
Using these results the geometric shape of the girder was restored to its initial state. The results also show that neither the crack resistance value nor the compression resistance value of the girder exceeded specified limits, and that the stress of the girder was effectively controlled.
1. INTRODUCTION
Current methods for identifying the state of internal forces of civil structures can be classified into local and global methods. Based on whether the characteristic variable required for state identification depends on a structural model, the methods can also be classified into model-dependent methods and model-independent methods. In terms of identification strategy, the further classification of non-inversion-based, inversion-based and mixed-type identification methods can be adopted [1, 2]. The inversion-based state identification method, mainly based on the model updating theory, is currently used. Model updating is derived from the difference between the result obtained by the finite-element theory and the test result; the basic premise is that, when the measured response information of a structure is employed to update the initial finite-element model, the updated finite-element model will more suitably reflect the mechanical behavior of the structure. Model updating methods mainly include the matrix updating method and the parameter updating method (i.e. parameter identification). As the basis of structural state identification, the model updating theory and the parameter identification theory essentially pose an inverse problem which can ultimately be resolved into an optimization problem for a solution [3-5].
Current parameter identification methods are mainly based on dynamic response and static response data. Dynamic response is characterized by, for example, large volumes of data, ease of availability without influencing the normal service of structures, and convenient real-time monitoring of the structural state. Static response data provides, amongst others, better accuracy and reliability, and therefore enables high precision and stability data-based parameter identification; this data is widely used in parameter identification and detecting damage. Sanayei and Scampoli [6] developed a parameter identification method using the static force-displacement relation by partitioning the stiffness matrix of a structure into known and unknown sub-matrices based on the known applied load vector and known measured displacements. Hajela and Soeiro [7] used a static based identification method that used the output error approach. Their method also used an optimization routine to minimize errors between measured displacements of a structure and the calculated analytical displacements. The important difference of this method is based on the loading procedure. Wang et al. [8] proposed a damage identification method that used structural static deformation and the first several natural frequencies. To identify damage in a two-dimensional beam-element frame model, Johnson [9] used a sequential quadratic program using unconstrained, nonlinear optimization. This method created an objective function by using the error in the measured displacements of the actual structure and that of a mathematical model of the structure. Chen et al. [10] developed a structural damage detection method by using a limited test static displacement method based on grey system theory. The grey relation coefficient of displacement curvature was defined and used to locate damage in a structure.
The main idea presented in this paper is that, without considering the influence of cable relaxation and temperature affection cable force and the girder’s geometric shape, the change of structural parameters may result in the deformation of the girder, and thus result in a change of cable force. In turn, a change of cable force may result in deformation. Based on static response data, a “cable force-displacement” relationship-based parameter identification method is proposed to determine the state of internal force of an existing cable-stayed bridge and provide cable force optimization on this basis.
2. STATIC RESPONSE-BASED PARAMETER IDENTIFICATION
2.1. Parameter Identification and Optimization
After discretizing the structure into a finite-element model with n degrees of freedom, the static equilibrium equation can be expressed as:
 |
(1) |
where, K(p) represents the global stiffness matrix of the structure; p , U and F represent the parameter vector to-be-identified, the static displacement vector and the load vector of the structure, respectively. Correspondingly, the structure’s displacement response vector U and strain response vector ε under the load F can be expressed as:
 |
(2) |
where, B represents the strain-displacement relationship matrix.
As with the dynamic response test, general loading and testing can only be conducted with a small degree of freedom in current structures. Furthermore, loading and testing usually do not follow the same sequence of degrees of freedom. It is assumed that the structural response test will be carried out under nlc linearly-independent working conditions. Under the ith working condition, assuming that the number of degrees of freedom tested in the displacement response test is m, that the number of degrees of freedom untested is l, and that the structural load vector is Fi, then the corresponding displacement and strain test values become Umi and εmi, respectively. Under the ith working condition, the theoretical values of static response of the structure are Ui and εi, respectively. For correspondence between analysis results and measured results, Ui can be divided into a tested component UTi (m dimensions) and an untested component UNi (l dimensions); Fi can be divided into FTi and FNi. On this basis, Eq. (1) can be converted into:
 |
(3) |
The following equation can be obtained from Eq. (3):
 |
(4) |
After substituting Eq. (4) into Eq. (3), UTi can be shown as:
 |
(5) |
To simplify Eq. (5), it can be expressed as:
 |
(6) |
Similarly, the strain εTi corresponding to the measured part has a similar form:
 |
(7) |
where, Hui and Hεi represent the displacement matrix and the strain observation matrix, respectively.
The displacement and strain residual vectors corresponding to the ith working condition are therefore:
 |
(8) |
 |
(9) |
Due to unavoidable errors with displacement and strain test data in structural and load test processes, and taking into consideration that errors may vary with the degrees of freedom of testing and loading, the displacement-weighted matrix (Wu), the strain-weighted matrix (Wε) and the load-weighted matrix (WF) have been introduced with regard to each working condition. These matrices are in accordance with the precisions of various displacement measuring points, strain measuring points and loading conditions. Wu, Wε and WF are all diagonal matrices and the diagonal elements are the weighted values of the observed results of static displacement vectors, strain vectors or load vectors under various working conditions. For example, in the ith working condition, diagonal elements of Wui are the weighted values of the static displacement vector in Eui(p).
 |
(10) |
In the ith working condition, Wεi and WFi have the same form as Wui. For repeated trials, the diagonal elements of Wui and Wεi can be selected as the reciprocal of variance of observed results, and the diagonal elements of WFi can be selected as the reciprocal of variance of loads. However, for a single trial, the diagonal elements can be chosen according to the same rule of thumb. After weighted correction, the displacement and strain residual vector corresponding to the ith working condition can be expressed as:
 |
(11) |
 |
(12) |
By using the head-tail connection of the displacement and strain residual vector under each working condition, the overall residual vector  of the static response of the structure can be obtained.
The magnitude-weighted matrix Wss can also be introduced to correct  under two considerations: (1)the magnitude of the displacement data and the strain data in the residual vector need to be maintained on the same order; and (2)consideration of the relatively significant differences in the magnitudes of different test data will prevent low-magnitude test data being submerged by high-magnitude test data. According to Cui, Wss can therefore be represented as [11]:
 |
(13) |
Assuming that the number of dimensions of all the static response test data under all working conditions is SM, and taking the minimum variance solution as the solution to each parameter to-be-identified, then the static response-based structural parameter identification problem can be summarized as the optimization problem:
 |
(14) |
where, ei (p) represents the ith element of the SM-dimensional vector Est (p); and pL, pU are the upper and lower limits of p.
2.2. “Cable Force-Displacement” Relationship
The relationship between the change of cable force and the change of displacement will be derived in this section. If the variations of displacement and cable force can be simultaneously measured, the parameters to be solved can then be identified by using the optimization method.
The strain energy of the structure can be expressed as [12, 13]:
 |
(15) |
If the influence of shear stress is neglected, the strain energy of the structure can be further expressed by introducing the finite-element concept:
 |
(16) |
where, m represents the number of beam elements; li, Ei, Ii and Ai represent the length, elastic modulus, sectional moment of inertia and sectional area of the ith element, respectively; Mil and Mir represent the bending moments at the left and right ends of the ith element, respectively; Nil and Nir represent the axial forces at the left and right ends of the ith element, respectively.
Here, the bending moment and the axial force can be expressed as a function of external forces:
 |
(17) |
where, FDLP represents dead load, live load and pre-stressing force; and T represents the cable force. Matrices B and C are determined by element characteristics and structural forms. Without imposing other constraint conditions, ∂U/∂Ti = 0 indicates that the displacement of a notch of the stay cable relative to the unknown cable force Ti is 0, and on this basis the following equation can be established:
 |
(18) |
where, Φ represents the influence matrix, and the value in the ith row and the jth column represents the variation of the ith target value (including displacement, stress, counter-force, etc.) after the cable force of the jth stay cable goes through element change; and δ represents the actual variation of the target value. This equation is in fact an equation of force method where Φ represents the flexibility matrix; uDLP represents the displacement vector caused by other loads; and δ=−uDLP.
3. PARAMETER IDENTIFICATION OF A GIRDER
3.1. Jiujiang Bridge
Jiujiang Bridge is a single-pylon, double-cable plane PC cable-stayed bridge based on the fixed pier-pylon-beam system. This bridge, being operational since June 1988, has a span combination of 2×160m, as shown in Fig. (1) and Fig. (2) illustrates the general cross-sectional profile. The geometric shape of the girder and cable force tests were conducted in July, 2000 and August, 2008;both tests were undertaken under similar conditions. In addition, by the time of the first test, the bridge had been in service for more than a decade and concrete creep had ceased. Therefore, it was presumed that creep exerted no influence on girder deformation from 2000 to 2008. As described in the previous section, without considering the influence of stay cable relaxation and temperature on cable force and the geometric shape of the girder, the variation of external loads may give rise to a corresponding displacement, and the change in the shape of the cable-stayed bridge girder is only caused by the change of cable force.
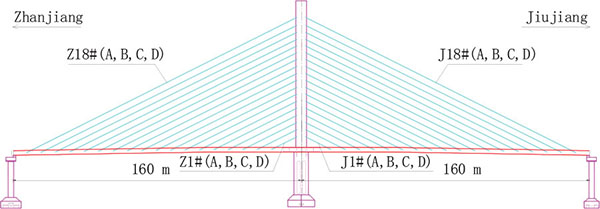
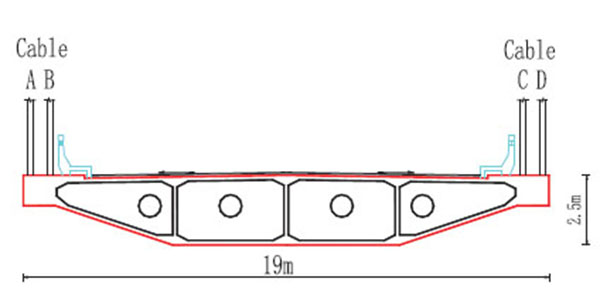
The spatial finite-element model of the cable-stayed bridge is shown in (Fig. 3); the pylon, stay cable and bridge deck system are simplified and they have been applied with corresponding loads.
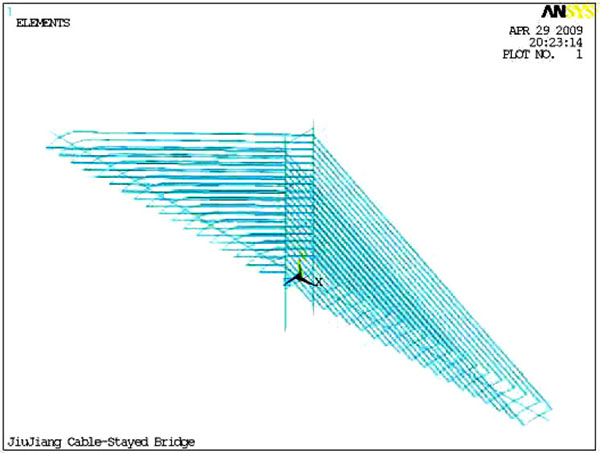
(1) Structural members: The girder, pier and pylon all adopted BEAM4 elements and the cable adopted the LINK10 element.
(2) Materials and sections: The concrete elastic modulus of the girder adopted the result measured by the on-site rebound method, and its sectional area and sectional moment of inertia referred to the design drawings.
(3) Loads: Given the materials and parameters of the structure, its actual state of internal force only depends on four factors: dead load of the structure, counter-force of the support, permanent pre-stressing force inside the girder and cable force of the stay cable [14]. (i) The dead load of the structure was determined according to the design drawings. (ii) The counter-force of the support was calculated by simulating the state evolution process of the bridge (including the construction stage of the bridge and the operation stage after bridge completion) based on existing design data and taking into account the influence of various factors on the structure. (iii) The permanent pre-stressing force was calculated using the equivalent load method and calculation of pre-stressing force loss according to the General Code for Design of Highway Bridges and Culverts (JTG D60-2004) [15]. (iv) The cable force refers to the result of the full-bridge cable force measurement undertaken in 2008 [16].
3.2. Selection of Parameters
Based on the sensitivity of different parameters, selecting parameters more sensitive to displacement change for correction can improve model correction efficiency [17]. As known from sensitivity analysis, the mass of the girder exerts no influence on deformation; stiffness is the key parameter influencing girder deformation. Given that it is very difficult to accurately obtain the current concrete elastic modulus value of the girder, section area and moment of inertia of the girder were taken as constant values (referring to the values given by the design drawings), and concrete elastic modulus as a corrected parameter was adopted. As the bridge has different types of girder sections at the site of mid-span, side span and pylon, the girder was divided into six zones in the longitudinal direction (as shown in Fig. 4), each of which was assigned with a corrected parameter value. Table 1 shows the variables and value ranges of the parameters to-be-identified.

| No. | Section of to-be-updated elastic modulus coefficient | Variable name | Initial variable value | Change range | Variable value after optimization |
|---|---|---|---|---|---|
| 1 | Section A | BEAM-EA | 1.0 | [0.50,1.50] | 0.790 |
| 2 | Section B | BEAM-EB | 1.0 | [0.50,1.50] | 0.854 |
| 3 | Section C | BEAM-EC | 1.0 | [0.50,1.50] | 0.829 |
| 4 | Section D | BEAM-ED | 1.0 | [0.50,1.50] | 0.813 |
| 5 | Section E | BEAM-EE | 1.0 | [0.50,1.50] | 0.805 |
| 6 | Section F | BEAM-EF | 1.0 | [0.50,1.50] | 0.782 |
3.3. Determination of Objective Function
After the determination of parameters to-be-identified, the parameter identification of the girder became an issue of structural parameter optimization. Based on the girder’s geometric shape and cable force data of the bridge obtained from the two tests (2000 and 2008), the change of cable force was adopted as the real variable parameter optimization, thus making the displacement change value of the model approach the measured value. In the model, girder displacement caused by the change of measured cable force was Uai (calculated displacement). Taking Uai as a design variable, the absolute value of the relative error between calculated displacement and measured displacement was defined as the objective function:
 |
(19) |
where, Uti represents the measured displacement difference (of the girder’s geometric shape) between 2008 and 2000; and Uai represents the calculated displacement. The number of measuring points is reflected by the number 36.
3.4. Results of Optimization
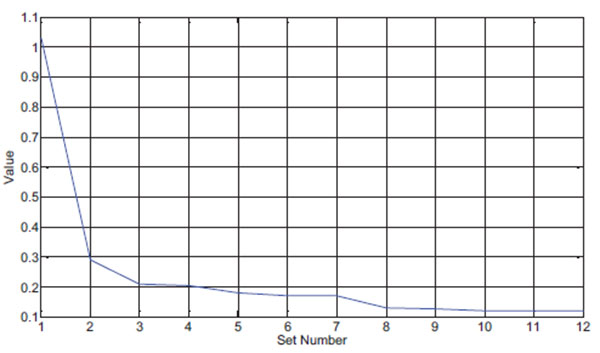
ANSYS optimization module was employed to create the corresponding optimization analysis file for optimized iterative analysis by a total of 50 iterative steps. The optimal solution was obtained after the convergence of the program ended at the 12th step. The final value of the objective function was min(objection_function). After solving the optimal solution by the first-order optimization method, the zero-order optimization method was then employed for verification. The two methods obtained the same result and presented a high level of consistency, suggesting that the optimization result is a global solution rather than solely a local solution. Fig. (5) shows the convergence of the objective function and Table 1 shows the values of various design variables under the optimal result. A comparison between the calculated displacement and the measured displacement values of various measuring points after parameter optimization is shown in (Fig. 6).
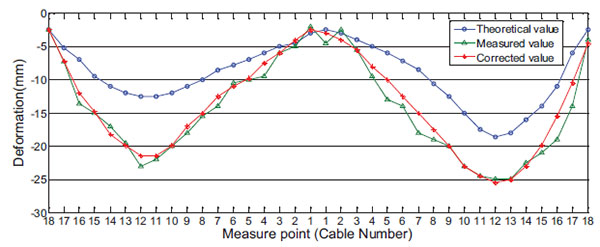
(Note: The displacement measuring point is located at the connection between the stay cable and the girder)
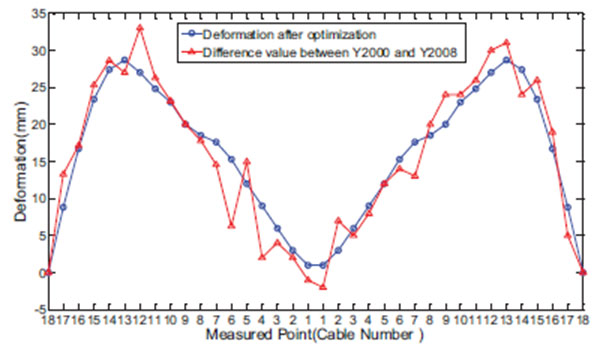
Results for the theoretical displacement and the measured displacement Fig. (6) show a relatively significant error; the average difference was 36.72%. Results for the corrected displacement and measured displacement showed a difference of 5.32%, indicating a good fit. As shown in Table 1, the coefficients of elastic modulus of various zones after identification ranged between 0.782 and 0.854, with a mean value of 0.812. This suggests that the mean decline in the stiffness of the girder was about 18.8%. To test the degree of influence of measured displacement error on the parameter identification results, for the purpose of parameter optimization, the measured displacement value Uti was increased and decreased by 5%, respectively. When Uti increased by 5%, the mean value of the coefficients of elastic modulus (BEAM_E) decreased by 3.16%; when Uti decreased by 5%, BEAM_E values increased by 3.94%. These results suggest that a small input error would not result in a large output error, and that the error of the measured displacement Uti caused no significant disturbance to the identification results.
4. ASSESSMENT OF THE STATE OF INTERNAL FORCE
Using the results from the parameter identification, it was possible to correct the girder parameter, the cable force of the finite-element model, the analyzed internal force under the dead load state and the service state.
4.1. Internal Force Under Deadload
A comparison between the results of internal force identification and the values measured by the stress release method in 2007 are shown in Table 2 [18, 19]. The mean value of the identification results was 2 MPa less than that of the measured results; the results provide consistent rules of stress distribution. The difference in result between the two sets of results may be due to different temperature conditions. However, under the dead load state, the girder stress was always in a compressed state.
| Girder’s longitudinal coordinate X (m) | Corresponding position of the girder | Value measured by the stress release method (MPa) | Value calculated in this paper (MPa) |
|
|---|---|---|---|---|
| -149 | At Cable Z17# | Top flange | -7.78 | -5.89 |
| Bottom flange | -9.69 | -4.94 | ||
| -120 | At Cable Z14# | Top flange | -10.09 | -8.88 |
| Bottom flange | -10.86 | -8.29 | ||
| -79 | At Cable Z9# | Top flange | -11.84 | -8.14 |
| Bottom flange | -10.54 | -8.41 | ||
| -39.4 | At Cable Z4# | Top flange | -12.71 | -9.34 |
| Bottom flange | -10.67 | -9.9 | ||
| 12 | At Cable J1# | Top flange | -14.15 | -10.62 |
| Bottom flange | -11.42 | -11.04 | ||
| 79 | At Cable J9# | Top flange | -7.78 | -8.14 |
| Bottom flange | -9.37 | -8.26 | ||
| 149 | At Cable J17# | Top flange | -9.56 | -6.92 |
| Bottom flange | -10.03 | -6.99 | ||
4.2. Internal Force in the Normal Service Stage
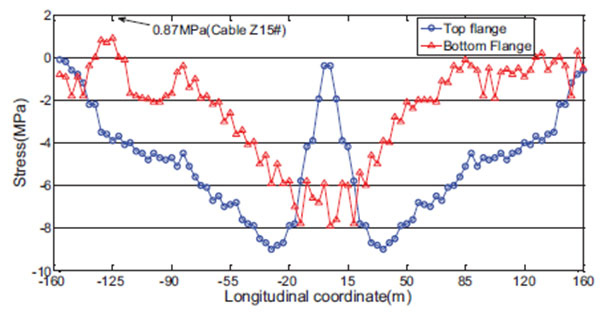
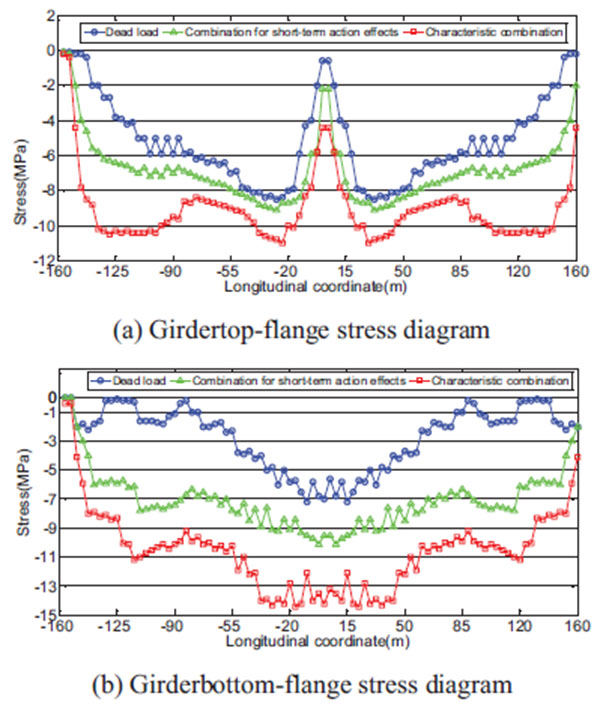
The crack resistance and compression resistance of the girder were calculated in the normal service stage. The calculation results of the normal section crack resistance of the girder are shown in Fig. (7). Under the combination for short-term action effects, the top flange had a relatively high compressive stress reserve. However, the compressive stress reserve of the bottom flange was already very low; a tensile stress of 0.87MPa was recorded at the bottom flange position near Cable Z15#. According to the requirements of the Generalized codes for design of highway bridges and culverts (JTG D60-2004) [15], tensile stress is not allowed.
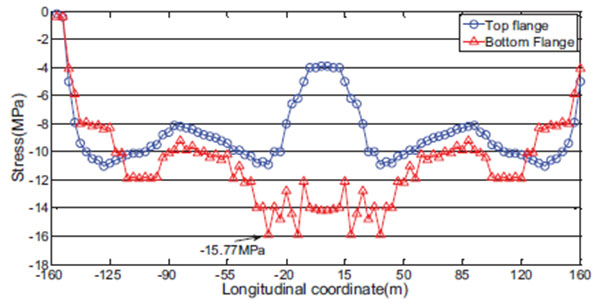
The calculation results for the normal section compression resistance of the girder are shown in Fig. (8). Under the characteristic combination, the maximum compressive stress (-15.77MPa) occurred near Cable Z4#, already approaching the specified allowable value of -16.2 MPa [15]. The girder was therefore already in an extremely dangerous working state and adjustment of the internal force was required.
5. CABLE FORCE OPTIMIZATION BASED ON MINIMUM BENDING ENERGY
Based on existing principles of internal force optimization for concrete cable-stayed bridges, bending energy was taken as the objective function. Control of the girder’s tensile and compressive stresses within the specified limits in the normal service stage were adopted as constraint conditions, and cable force within its limits for the purpose of optimization were confined. This method focused on adjusting the internal force and gave due consideration to the girder’s geometric shape.
5.1. Determination of Objective Function
Taking U as the bending strain energy of the structure, the following objective function can be used:
 |
(20) |
where,
 |
 and
and  represent the matrices constituted by the bending moment and the axial force on the left and right ends of the element under the action of dead load (including dead weight, pre-stressing force and current cable force);
  and
and  represent the influence matrices of the bending moment and the axial force on both ends of the element under the action of individual element cable forces; and {T} represents the adjusted cable force vector. {B} is a diagonal matrix having the following diagonal elements:
 |
As Jiujiang Bridge is a single-pylon symmetric structure, to prevent cable force adjustment from causing an additional bending moment to the main pylon, it is assumed that the stay cables at symmetric positions on both sides of the pylon (having the same cable number, such as Z10# and J10#) have the same adjusted cable force. It is also assumed that the four horizontal cables (A, B, C and D) corresponding to the same cable number also have the same adjusted cable force. In total there were 18 adjusted cable force variables.
5.2. Optimization Constraints
(1) Stress Constraint
Results from the stress calculation in section 3.2 showed that the top flange of the girder had a relatively high compressive stress reserve under the combination for short-term action effects and the characteristic combination. Constraints therefore are only imposed on the bottom flange stress; tensile stress is not permitted in the crack resistance calculation of the girder:
 |
The compressive stress in the compression resistance calculation of the girder does not exceed its limits:
 |
where, {FD1} represents the maximum tensile stress(absolute value) of the bottom flange of the girder under the combination for short-term action effects before cable force adjustment; {FD2} represents the maximum compressive stress(absolute value)of the bottom flange of the girder under the characteristic combination before cable force adjustment; [FA] represents the influence matrix of the bottom flange stress of the element under the action of individual element cable forces; and fck represents the axial compressive strength of C50 concrete.
Therefore, taking stress as aconstraint condition can ensure that the structural stress of the girder after cable force optimization adheres to relevant specifications.
(2) Cable Force Constraint
Considering the issues of strength and fatigue, the cable force of the stay cable under the deadload state and the service state should not exceed its reasonable carrying range, and it should be restrained by setting upper and lower limits. In addition, the adjusted cable force should be a tensile force greater than zero. Thus, cable force constraint can be expressed as:
 |
(21) |
 |
(22) |
where, {PD} represents the measured cable force before cable force adjustment; [PA] represents the influence matrix of the cable force of the stay cable; and {PU} represents the upper limit of the cable force value of the stay cable (determined on the basis of a cable force safety coefficient of 2.5; see details in the provisions of Article 4.3.1 of the Design Specifications of Highway Cable Stayed Bridge (JTJ027-96) [20]).
5.3. Solving the Objective Function
After determining the objective function and constraint conditions, the problem of cable force optimization was converted into a quadratic programming problem in its standard form:
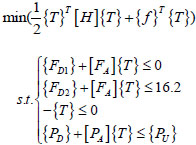 |
In fact, the model for the cable force optimization of cable-stayed bridges is a special constrained extreme value model, expressed in the form of a sum of squares or weighted sum of squares. [H] in the model is therefore a positive definite matrix. On this premise, the optimization problem of this model is converted into a convex quadratic programming problem [21], to which there is a unique global solution. MATLAB toolbox was used to solve the quadratic programming problem and provide a solution to the cable force optimization problem by using the “quadprog” function in the optimization toolbox.
5.4. Results of Optimization of Cable Force
(1) Results for the optimization of cable force are shown in Fig. (9). After cable force optimization, Cable 8# had the maximum adjusted cable force (-118.8kN) and Cable 3# had the minimum adjusted cable force (6.2kN). It can also be seen that various groups had relatively uniform cable forces.
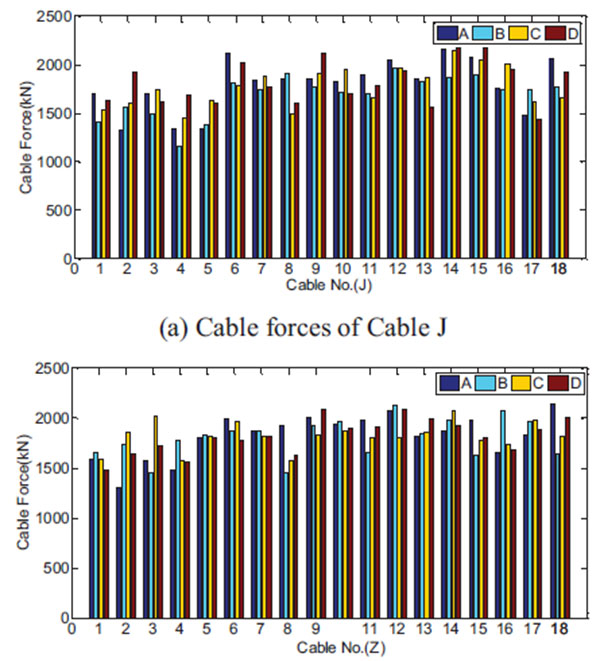
(The distribution of A,B,C and D are shown in Figs. (1 and 2).
(2) Results for cable displacement after optimization are shown in Fig. (10). Results show that the geometric shape of the girder was restored to the level recorded in 2000. The maximum displacement increment (27.83 mm) was observed at cable position 13#.
(3) Stress and internal force results after optimization for the girder are shown in Fig. (11). The top and bottom flanges of the girder are both in the compression situation under the state of dead load, the combination for short-term action effects and the characteristic combination. Neither the crack resistance value nor the compression resistance value of the girder in the checking calculation exceeded the specified limits [15]; the maximum compressive stress of the top and bottom flanges were -10.9Mpa and -14.6Mpa, respectively, indicating that stress had been effectively controlled.
CONCLUSION
The method in this investigation has simplified the identification of the state of internal force into the identification of girder stiffness, and proposed a “cable force-displacement” relationship-based parameter identification method. This method was successfully applied to the Jiujiang Bridge. The main conclusions from this investigation are:
(1) A correspondence between the change of cable force and the change of displacement has been verified in this investigation. Given the variations of displacement and cable force during measurement, parameter identification can be translated to the problem of optimization. The proposed method was successfully applied in a case study (Jiujiang Bridge);assessment results of the state of internal force of the structure were shown to fit relatively well with the measured results. In the normal service stage, with the combination of short-term action effects and the characteristic combination, the girder was already in an extremely dangerous working state and adjustment of internal force was required.
(2) Application of the proposed model with results from Jiujiang Bridge examined the influence of displacement error on the parameter identification results. The results demonstrated that a small input error would not result in a large output error, and that the error of the measured parameter caused no significant disturbance to the identification results. These findings indicated that the proposed method provides reliable and stable results.
(3) When bending energy was taken as the objective function for the optimization of cable force, the girder’s geometric shape was restored to levels recorded in the year 2000. The top and bottom flange stresses of the girder under dead load state were more uniform than those before cable force adjustment. It was also found that neither the crack resistance value nor the compression resistance value of the girder in the checking calculation exceeded specified limits, thus stress had been effectively controlled. Therefore, the cable force adjustment scheme adopting internal force as an optimization objective is practical and feasible, improving both internal force and the girder’s geometric shape.
ETHICS APPROVAL AND CONSENT TO PARTICIPATE
Not applicable.
CONSENT FOR PUBLICATION
Not applicable.
CONFLICT OF INTEREST
The authors declare no conflict of interest, financial or otherwise.
ACKONWLEDGEMENTS
This work was supported in part by the National Natural Science Foundation of China(Grant No.51608136) and the New Talent Project of Guangzhou University(No.2608). The authors confirm no conflict of interest.


