All published articles of this journal are available on ScienceDirect.
Emergency Restoration of High Voltage Transmission Lines
Abstract
Background:
Blackouts on high voltage (HV) transmission lines occur due to harsh weather and non-climatic reasons such as human errors and mechanical failures. While it is impossible to prevent all such situations, utility officials and contractors can be equipped to meet such emergencies.
Objective:
This paper discusses: (1) the economic impact of climatic events in the USA and economic justification for having Emergency Restoration (ER) plans and, (2) emergency restoration procedures for downed transmission lines in Oman. Key aspects of emergency restoration procedures are discussed.
1. INTRODUCTION
High voltage electric transmission lines carry electrical energy from power generating stations to substations. These transmission lines function in a wide range of terrains, climates and physical environments and are always at risk to experience catastrophic events, both weather-related and man-made. Weather-related events include high winds, ice buildup, ice storms, flash floods, rock or mud slides, erosion of foundations and much more. Sudden power blackouts caused by nature are very common; however, non-climatic events are just as likely. These include human error, vehicle accidents, vandalism/sabotage, terrorism, design defects and poor maintenance protocols.
All high voltage transmission lines are exposed to a certain level of damage risk, threatening to disrupt or impair critical power supply infrastructure and affect public safety. Utilities cannot escape these emergencies; therefore, it is important to know their cause and quickly, efficiently respond to the problem. Emergency situations may include failure of structural systems and foundations (including guy wires and anchors), failure of conductor splices and damage to conductor strands leading to conductor failure. Structural damage may also occur due to degradation of conductors due to wild fires, snapped conductors from falling trees, insulator breakage, failure of cross-arms and buckling of tower angle members or connection failures.
In all these cases, the demand is to restore the system to normalcy rapidly. The primary concern in Emergency Restoration is to revive the transmission network, get the line back into operation as quickly as possible and to restore electricity supply to the affected consumers. The other important concern is to minimize the economic impact of the costs associated with the devastation and rebuilding. While the cost to rebuild or restore a failed transmission line is inversely proportional to the restoration time, the total losses are directly proportional to the outage time. Therefore, one can view any Emergency Restoration Plan as a combination of technical or engineering processes and financial planning.
This paper presents a brief discussion on the impact of typical storm-related blackouts, and their financial impact followed by a review of procedures used during emergency restoration of three damaged high-voltage transmission lines in Oman.
2. ECONOMIC IMPACT OF MAJOR CLIMATIC EVENTS
2.1. Storm-Related Blackouts in The U.S
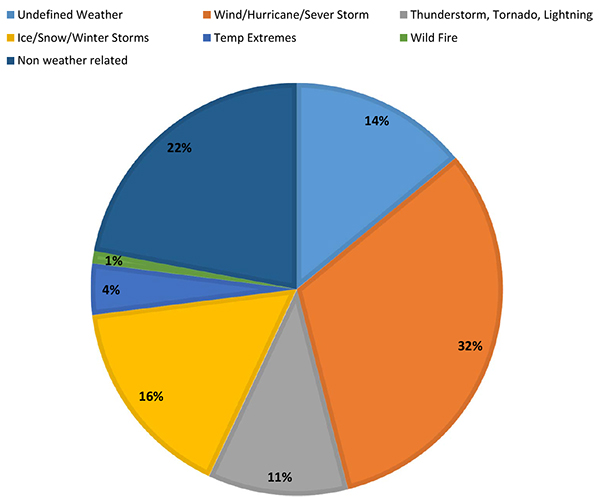
According to studies from the reported incidents in the United States for the period 1992-2011 [1], nearly 78% of electric grid disruptions are weather related, affecting 178 million customers. Fig. (1) shows the historical “Grid Disturbance” data from the US Department of Energy [2].

Table 1 shows the causes of large blackouts in the United States between 1984 and 2006. It can be seen that nearly 44% are weather-related. Table 2 gives a representative idea of the economic impact of weather-related outages between 1989 and 2004 as compiled by one utility.
Utilities use two types of indices, namely SAIFI and SAIDI, to benchmark reliability of their power supply systems [3, 4] and to develop effective emergency restoration plans.
| No. | Category | % of Events | Mean Size in MW * | Customers Affected * |
|---|---|---|---|---|
| 1 | Earthquake | 0.8 | 1,408 | 375,900 |
| 2 | Tornado | 2.8 | 367 | 115,439 |
| 3 | Hurricane/Tropical Storm | 4.2 | 1,309 | 782,695 |
| 4 | Ice Storm | 5 | 1,152 | 343,448 |
| 5 | Lightning | 11.3 | 270 | 70,944 |
| 6 | Wind/Rain | 14.8 | 793 | 185,199 |
| 7 | Other Cold Weather | 5.5 | 542 | 150,255 |
| 8 | Fire | 5.2 | 431 | 111,244 |
| 9 | Intentional Attack | 1.6 | 340 | 24,572 |
| 10 | Supply Shortage | 5.3 | 341 | 138,957 |
| 11 | Other External Cause | 4.8 | 710 | 246,071 |
| 12 | Equipment Failure | 29.7 | 379 | 57,140 |
| 13 | Operator Error | 10.1 | 489 | 105,322 |
| 14 | Voltage Reduction | 7.7 | 153 | 212,900 |
| 15 | Volunteer Reduction | 5.9 | 190 | 134,543 |
affecting 50,000 customers or more.
| No. | Storm/Event | Location | Storm Year |
Cost of Storm (US$ Million) * |
|---|---|---|---|---|
| 1 | Tornadoes | N. Carolina | May 1989 | 15.2 |
| 2 | Hurricane Hugo | S. Carolina | Sep 1989 | 64.7 |
| 3 | All Storms | Varies | 1990 | 0.75 |
| 4 | Wind, Ice and Snow | Varies | Mar 1993 | 9.2 |
| 5 | Ice Storm | N. Carolina | Feb 1996 | 22.9 |
| 6 | Ice Storms | N. Carolina | 2000 | 205 |
| 7 | Hurricane Isabel | Virginia | 2003 | 212 |
| 8 | Hurricanes 1 | Florida | 2004 | 890 |
| 7 | Hurricanes 2 | Florida | 2004 | 366 |
1 Florida Power & Light 2 Progress Energy Florida
*including cost of restoration and recovery
SAIFI is the System Average Interruption Frequency Index and represents the average number of times per year that the power supply to the customer is interrupted, expressed as interruptions per customer per year.
SAIDI is the System Average Interruption Duration Index and represents the average amount of time per year that power supply to a customer is interrupted, expressed in minutes per customer per year.
These two indices are defined as follows:
 |
(1) |
 |
(2) |
One problem with these indices is the lack of consistency in that they normally do not include storm-related outages. Some jurisdictions in the USA and elsewhere consider storm-related outages as “extreme events” and do not include them in power disruption statistics. Also, as stated by Campbell [3], what is considered unusual weather in one region may be normal in another region. In one study [4], it was found that the total SAIDI outage duration time, including storm-related events is about 3 hours, translating into a 50% percentile annual unserved electricity cost of nearly $2.5 Billion.
2.2. Economic Justification for an Emergency Response System
CIGRE [7] states that one of management’s top goals in an Investor Owned Utility environment is “to minimize the net present value of annual expenditures over a given investment period”. Lindsey [5] gives the economic justification for having an Emergency Restoration System in terms of a Net Present Value (NPV) approach as:
 |
(3) |
where:
NPV = Net Present Value of annual utility expenditures
n = period taken into consideration in years (i = 0 is initial investment)
r = discount rate
Ci = Annual expenditure in the Year “i” = Ei + Ri
Ei = Deterministic costs or planned expenditures in the Year “i”
Ri = Probabilistic costs associated with risk of failure in the Year “i”
NPV includes both known (normal operations, maintenance, and investments) and anticipated costs. For a high-voltage overhead transmission line asset, all relevant cost factors (both deterministic and probabilistic) have to be taken into consideration during a given investment period. The probabilistic cost factor Ri is called the Risk of Failure and is defined as follows:
 |
(4) |
Risk of failure during a time interval may be defined in economic terms such as NPV and is a function of time since both the probability of failure and the consequences are functions of time. In general, the risk of failure R is also a function of planned expenditure E.
 |
(5) |
From the above equations it is clear that risk can be controlled by either:
(a) Controlling the likelihood or chance of failure-initiating event
(b) Controlling the magnitude of resulting consequences including cost
Item (b) is the fundamental basis of economic justification of any emergency restoration process or plan. Proper planning for outages and rapid restoration helps minimize the costs of consequences.
3. EFFECTIVE EMERGENCY RESTORATION
When a high voltage transmission line goes down with one or several damaged structures, the responsible utility incurs huge monetary losses and hundreds of non-transmission (outage) hours. Given that the total losses and/or damages are directly proportional to the outage duration, time is a crucial factor in reinstating or remediating the damaged/fallen structure(s). In some cases, the process of formally rebuilding a new line can take as long as 5 to 6 weeks.
However, by using an effective Emergency Restoration Plan, the damaged/fallen transmission structures (towers or poles) can be replaced in a few hours depending on the nature and depth of the damage. Proper planning not only maximizes restoration efficiency but can also minimize inventory levels.
An effective Emergency Restoration Plan contains three (3) essential elements:
1. Planning
2. Emergency Materials
3. Training
Planning includes determining which transmission lines are important, the possible ways in which they can fail and how best to restore them. This includes general information about existing structures and foundations, data on past climate-related failures, weather criteria and structural loading and extent/location of damages.
To perform any quick emergency restoration work, critical materials must be readily available for use. The inventory must include standard wire sizes in sufficient quantities. If the line consisted of poles, then the inventory stock must have a reasonable number of poles of similar size and strength. Structures used for restoration can be modular, temporary or permanent.
An important part of any restoration is the training of field personnel in the erection of the replacement structures, stringing and guying operations etc. A rapid mobilization of trained work force is vital to the process of emergency restoration.
4. EMERGENCY RESTORATION ACTIONS
The author was personally involved with the following high voltage line restoration projects in Oman, each highlighting one of the three types of damages: weather-related (storms), incident-related (an accident or unintended activity) and design-related (defective design or failure to follow established design protocol).


4.1. Restoration 1 - Weather-Related Damage
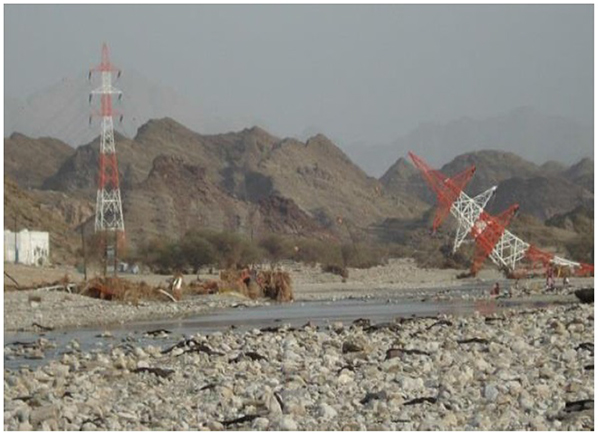
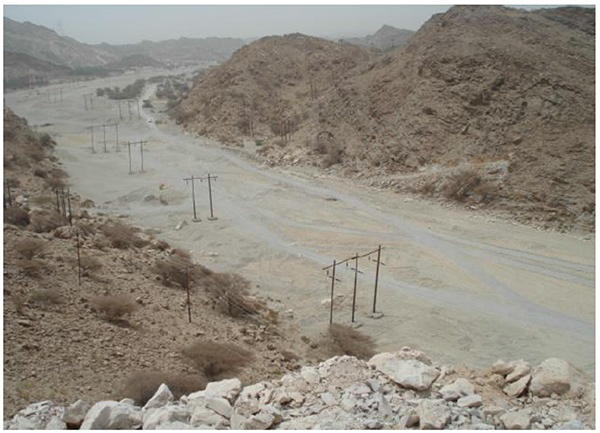
Cyclone GONU of 2007 was one of the strongest tropical cyclones to hit Oman. At its peak, GONU sustained wind speeds of 220 km/h (138 mph) [6]. Strong winds coupled with heavy rains and flash floods knocked out power lines and other critical infrastructure. The flooding and wind caused widespread damages to several transmission installations in the country including the main 132 kV Interconnected Transmission Network in the Eastern region. This includes the collapse of several transmission towers, disrupting power to approximately 19,000 customers. GONU is estimated to have caused damages up to US $4 Billion. Fig. (2) shows the image of one of the collapsed lattice towers. The emergency restoration procedure was aimed at quickly reinstating at least one circuit of the double circuit line with temporary wooden poles (see Fig. 3).The overall task was doubly challenging because there were no access roads to the affected site. The line was restored completely in 8 days [6].

The restoration process consisted of:
1. A simple design with standard weather criteria for the re-route
2. Required wood poles and other materials shifted to the affected site from inventory stock collected from every region of the country.
3. Special construction methods devised for quick restoration.
4.2. Restoration 2 - Incident-related Damage
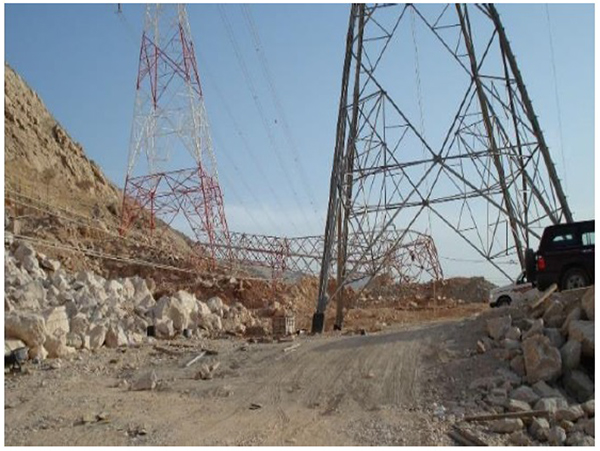
This particular incident illustrates the dangers to a transmission line during work on a neighboring road close to the transmission line route. In spite of safety measures adopted by the roads department, huge pieces of rock debris slipped and fell directly onto the foot of the tower causing immediate collapse. Fig. (4) Shows the collapsed lattice tower. After inspecting the area, repair work commenced within a few hours. Readily-available movable transmission towers were used to restore one circuit of the double circuit 132 kV transmission line temporarily, while permanent restoration with a new concrete foundation and tower erection was performed simultaneously. The line was energized within 12 hours of the incident although permanent restoration took 7 days to complete with a new foundation and tower.
The restoration process consisted of:
1. Temporary movable towers
2. Simultaneous construction of a new tower with new foundation
4.3. Restoration 3 - Design-related Damage
Fig. (5) shows a typical example of hardware failure from a 220 kV transmission line in Oman, where conductors are not suitably damped per original design requirement. The resulting fatigue from repeated wire vibration due to galloping broke the connection hardware, later determined to be a ball-eye fitting. Replacement parts of ball-eye fitting and additional vibration dampers were ordered on an urgent basis. The line was restored within a short scheduled outage during which the repair work was completed.

The restoration process consisted of:
1. Determining the cause of failure as due to galloping
2. Replacing the hardware fittings
3. Adding more vibration dampers to the conductors to increase damping
(Dog bone dampers as shown in the figure)
The three restoration activities discussed above highlight the importance of utilizing available inventory, devising quick construction methods, deployment of temporary structures and why conformance to design protocols is critical to avoid hardware failures.
CONCLUSION
In the previous sections, the economics of weather-related transmission line failures was discussed. For utilities, having an effective Emergency Restoration plan, can help control the financial impact of losses due to weather-related power outages. Examples of structural, foundation and hardware failures on high voltage transmission lines in Oman and restorative processes adopted were provided.
Effective emergency restoration procedures capable of being activated at short notice must be in place with all utility companies. These procedures must be based on the knowledge of stock materials in storage, trained workforce, available equipment and resource mobilization while responding to power blackouts caused by nature. Since new materials and techniques are constantly being developed, these ER procedures require periodic review with updated technologies.
NOTATION
| SAIFI | = System Average Interruption Frequency Index |
| SAIDI | = System Average Interruption Duration Index |
| NPV | = Net Present Value of Annual utility expenditures |
| n | = period taken into consideration in years (i = 0 is initial investment) |
| r | = discount rate |
| Ci | = Annual expenditure in the year “i” = Ei + Ri |
| Ei | = Deterministic costs or planned expenditures in the year “i” |
| Ri | = Probabilistic costs associated with risk of failure in the year “i” |
CONSENT FOR PUBLICATION
Not applicable.
CONFLICT OF INTEREST
The authors declare no conflict of interest, financial or otherwise.
ACKNOWLEDGEMENTS
Declared none.


