All published articles of this journal are available on ScienceDirect.
Experimental Study on Seismic Performance of Reinforced Concrete Frame Columns Supported with Post-build Wing Walls
Abstract
Six specimens of concrete frame columns reinforced by post-build wing walls on the opposite faces were designed and fabricated to investigate their seismic performance. Axial compression ratio was considered as the critical factor and divided into 0.31, 0.36, and 0.40 before reinforcement. HRB400 steel grade was used to the longitudinal bar and the ratio of longitudinal reinforcement divided into 1.23%, 1.05% and 0.82%, stirrup reinforcement ratio was 0.6%, and the stirrups were made by HPB300 steel grade. To meet with requirement of ‘strong shear, weak bending’, the ratio of the shear span to effective depth of columns was equal to 2.4. All specimens were subjected into cyclic reversing load. The testing results showed that wing walls reinforced significantly increased the seismic bearing capacity of the specimens and the wing walls damaged seriously, but the columns were not. The limited drift was ranged from 0.021 to 0.033. The post-build wing walls under horizontal motion may dissipate energy effectively while ensuring that the existing columns without obvious damage under vertical loads and earthquake strong motion.
1. INTRODUCTION
Substituting a post-build concrete wing wall for in filled or maintenance walls is an efficient method for minimizing the influence on the service function of reinforced buildings and improving their seismic performance in a strong earthquake event. After the earthquake in Wenchuan, reinforced concrete (RC) columns in seismic regions have been strengthened with post-build wing walls to ensure the quick recovery of usual production and lives in these areas [1].
The theoretical analysis and experimental researches have been done by some domestic scholars and new views were proposed. Axial compression ratio, longitudinal reinforcement ratio and volume stirrup ratio were chosen as basic parameters. In general, seismic behavior of the frame columns became better with the decrease of axial compression ratio, the increase of longitudinal reinforcement ratio and volume stirrup ratio. Frame structure was divided into four anti-seismic grades according to the seismic fortification intensity, site condition and building floor number. In this paper, the different anti-seismic grades columns close to the maximum axial compression ratio and the minimum volume stirrup ratio were reinforced, and the reinforcement detailing was determined according to the ratio of section length and wing wall width.
Yang et al. [2] studied the seismic performance and the reinforcement effect of a frame with wing walls and columns. They found that the wing walls were damaged firstly by the repeated tension and compression, so the columns were effectively protected. Thus, multiple seismic fortification was provided. A large number of cracks occurred at the end of beams to realize the ‘strong column-weak beam’ mechanism. Zhang et al. [3] designed a typical single-span frame building reinforced with wing walls to study the influence of different wing wall forms and dimensions on the strengthening effect of the frame structure. The software ETABS was used to analyse the elasticity and elastoplasticity of the strengthened and non-strengthened structures in three dimensions. The results showed that wing walls should be installed in two directions so that both the seismic bearing and deflection capacities can be improved in both directions of the structure. Zhang et al. [4] evaluated a frame and post-build wing wall frame under the horizontal cyclic loading of a pseudo-static experiment. Their results indicated that the hysteresis curves were full, the skeleton curve included large horizontal section after the peak load, and reflect high level of energy dissipation. Guo et al. [5] studied experimental specimens to simulate ground columns strengthened by wing walls at the third power plant of Harbin. They concluded that the wing walls behaved together with the column and bearing capacity of specimens was higher than that of the existing columns. The deflection capacity of the specimens reinforced with wing walls was not large, and the bearing capacity and lateral stiffness of the specimens decayed significantly under a cyclic reversing load.
The fact was not considered in the above tests and researches that the frame column bears the vertical load before reinforcement. In strengthening practice, it is difficult to unload frame column. Because the wing wall is not subjected to a compressive stress caused by a vertical load, the wing wall has a lower crack load under tension to relatively early and ultimate compressive strain under compressive to relative delay with a horizontal load.
Six RC frame columns with post-build concrete wing walls were designed with different parameters. The specimens were subjected to low cyclic reverse loading to evaluate the anti-seismic behaviour in terms of the seismic bearing capacity, hysteresis energy dissipation capability, displacement ductility, ultimate inter-story drift ratio, and so on. The test results provide a basis for the seismic strengthening of concrete frame columns to some extent.
2. EXPERIMENT
2.1.. Specimen Design and Fabrication
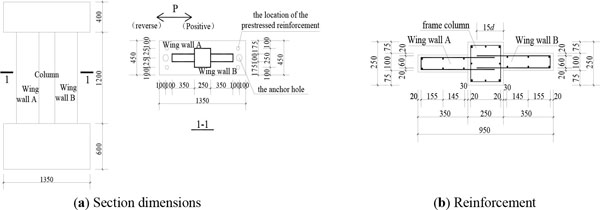
Six specimens were designed and manufactured. Axial compression was determined, and the minimum longitudinal reinforcement ratio corresponding to axial compression ratio and anti-seismic grade was determined [6]. The reinforcements in wing wall not only has effect of resisting shear force, but also has effect of connecting existing columns and form skeleton of mesh reinforcement. In addition, the horizon reinforcements should also meet the requirement of resisting shear strength between wing walls and existing column. Three axial compression ratio including 0.31, 0.36, 0.40 were designated for exiting frame columns. The ratio of longitudinal reinforcement was 1.23%, 1.05%, 0.82%, respectively, and stirrup ratio was 0.6%. The test basic parameters are shown in Fig. (1) Table 1.
The existing frame columns of the 6 strengthened specimens had cross-sectional dimensions of 250mm×250mm with a 20mm thick concrete cover. All of the columns had a height of 1200mm. The area of post-build wing walls is larger than the area of exist frame columns, thus the two phase back wing wall length is 350mm, the thickness of the post-build wing walls were all 100mm. There were beams respectively placed on the top and bottom of the specimens. The top beam was 1350mm×450mm×400mm, while the bottom beam was 1350mm×450mm×600mm. The standard cubic specimens (150mm×150mm×150mm) were measured to have a average compressive strength of 38.5MPa. The longitudinal reinforcements were HRB400 and the lateral reinforcements were HPB300. Table 2 presents the basic mechanical property indices of the reinforcements. The large-diameter longitudinal reinforcement of the original column was arranged in the corner.
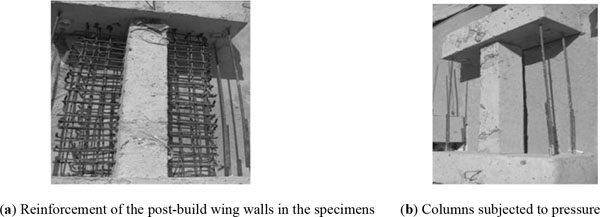
The specimens were made in two phases. First, the concrete columns, top beams and bottom beams were produced. The columns were put on pressure by screw tension to consider the actual reinforce situation. Then, the post-build wing walls were placed on the columns under loading. The specimens were produced in two stages based on the method of horizontal concrete casting.
In the test, four externally pre-stressed tendons were used to anchor both the top and bottom beams in order to reinforce the concrete column under loading. The post-build wing walls were connected to the sides of the column after the vertical loading became stable, as shown in Fig. (2). Before the concrete of the wing walls was cast, the horizontal reinforcement was planted in the column, while the vertical reinforcement was planted in the top and bottom beams. The horizontal and vertical reinforcements had lengths of 15d.
| Specimens | The Axial Compression Ratio | Longitudinal Reinforcement of Columns | Longitudinal Reinforcement Ratio of Columns | The Stirrup of Columns | Vertical Reinforcement of Each Side Wing Wall | Horizontal Reinforcing Steel Bar of Wing Wall |
|---|---|---|---|---|---|---|
| YQKZ1 | 0.31 | 4C12+4C8 | 1.05% | A10@100 | 6C8 | C12@100 |
| YQKZ2 | 0.31 | 4C12+4C8 | 1.05% | A10@100 | 6C8 | C12@100 |
| YQKZ3 | 0.36 | 8C10 | 1.00% | A10@100 | 6C8 | C12@100 |
| YQKZ4 | 0.36 | 8C10 | 1.00% | A10@100 | 6C8 | C12@100 |
| YQKZ5 | 0.40 | 4C10+4C8 | 0.82% | A10@100 | 6C8 | C12@100 |
| YQKZ6 | 0.40 | 4C10+4C8 | 0.82% | A10@100 | 6C8 | C12@100 |
| Steel Types | Yield Strength (MPa) |
Ultimate Strength (MPa) |
Modulus of Elasticity (GPa) |
|---|---|---|---|
| C12 | 493.3 | 630.0 | 21.6 |
| C10 | 436.5 | 538.5 | 21.4 |
| C8 | 423.8 | 512.9 | 21.0 |
| A10 | 342.6 | 428.3 | 22.1 |
2.2. Test Device and Loading System
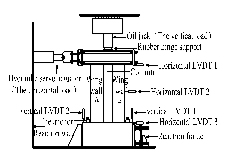
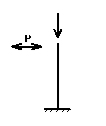
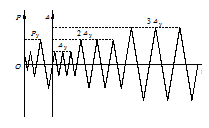
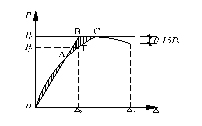
The lateral reverse load was exerted by an MTS horizontal hydraulic servo-actuator fixed to the reaction wall. The loading point was located at the centre of the top beam through the vertical centroid line of the original column. A vertical load was applied by a hydraulic jack, which was installed on the distribution beam and remained unchanged during the test process. A rubber hinged support was placed between the vertical hydraulic jack and the specimen. The bottom of the specimen was fixed by vertical ground anchors and horizontal reaction frames on both sides of the channel flow. Fig. (1) shows the loading device, and Fig. (4) shows the force diagram of the specimen. The hydraulic jack was used to replace the four external pre-stressed reinforcements at the top of each specimen, which applied a predetermined axial force on the original column, in order to avoid them influencing the test results. The replacement process included applying an axial force from zero to the predetermined value by the hydraulic jack and unloading the resultant force of the four bars from the predetermined axial force to zero and then removing them. The horizontal loading tests complied with the loading regimes provided by the current standard [7] (Fig. 5). Linear variable differential transformers (LVDTs) (Fig. 3) were used as horizontal displacement sensors to measure the lateral displacements of relevant parts of the specimens during the loading process. The cracking load was defined as the point at which the specimen began to crack. As shown in Fig. (6), the yield load Py was determined by the energy method. The ultimate load Pu was the peak load of the skeleton curve, and the displacement corresponding to 85% of the peak load in the descending stage was regarded as the ultimate displacement Δu.
3. TEST RESULTS AND ANALYSIS
3.1. Test Procedure and Phenomena
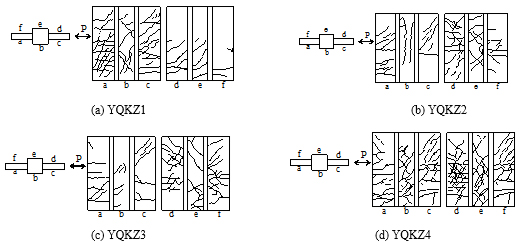
The direction of the horizontal load and the name and location of the wing wall are marked in Fig. (1)
The test results of the six specimens showed that the maximum tensile and compressive stresses and strains of the cross-section were all on the edges of the post-build wing walls because these walls were on the opposite faces of the existing columns (Table 3). The normal stresses and strains of the existing columns due to the horizontal load were not very prominent, the columns played a relatively large role in resisting the horizontal shear force. Not only was the seismic bearing capacity of the specimens clearly improved but also the damage to the original column under horizontal and vertical loads was relatively low because of the effective energy dissipation by the post-build wing walls on both sides.
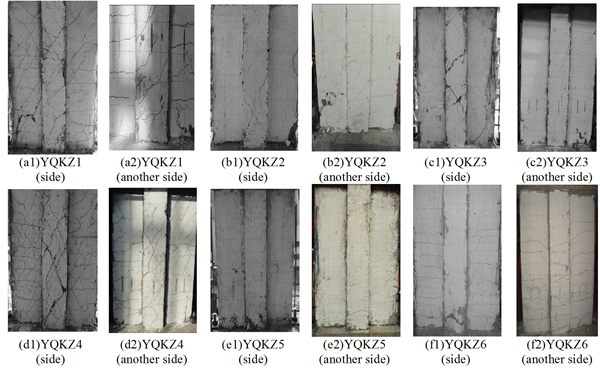
Under low reverse cyclic loading, the wing walls experienced the process of cracking, cracking development, yielding of the longitudinal reinforcement close to the edge of the cross-section, and crushing of the concrete at the edge of compression zone. The existing columns were relatively lightly damaged. Thus, the post-build wing walls provided resistance against horizontal earthquake action, achieved effective energy consumption, and guaranteed relatively light damage to the original frame columns under vertical and horizontal loadings. Figs. (7 and 8) were shown the damage and cracks of the specimens.
3.2. Test Procedure and Phenomena
Hysteretic and skeleton curves of specimens under a horizontal load are both synthetic reflections of seismic behavior. Figs. (9 and 10) present the hysteretic and skeleton curves of each specimen.
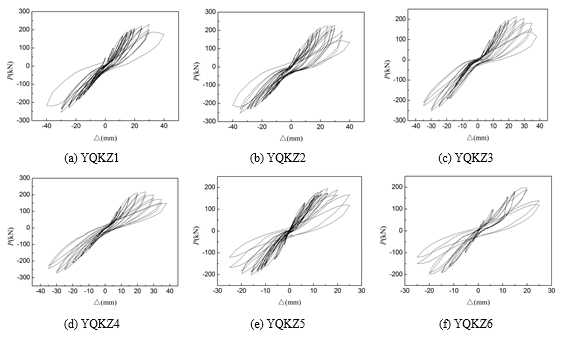
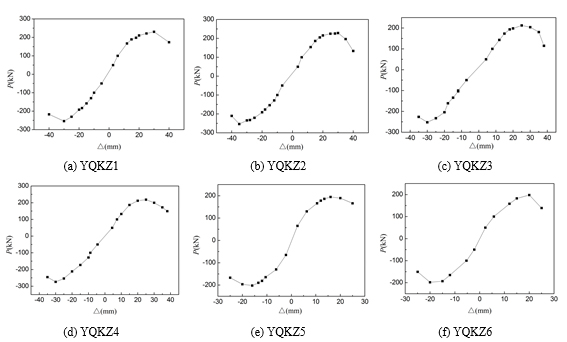
- When the horizontal load was less than the cracking load, the specimens were basically elastic. The load displacement curves rose along a straight line during loading, while the deformation was restored after unloading. As the load was increased, the load displacement curves gradually deviated from a straight line, and deformations accelerated so that residual deformations began to appear and reached a certain degree under unloading. The specimens began to assume elastoplastic properties. When the load was less than the yield load, the loading stiffness and unloading stiffness did not change significantly. When the load reached the yield load, the loading stiffness and unloading stiffness decreased with increasing load or lateral displacement.
- The specimens showed better deformability with a low axial compression ratio than with a high axial compression ratio. After the maximum load was reached, the decline in the skeleton curve was relatively slow, which indicates that the ductility was relatively good. When the axial compression ratio of the columns was increased, the skeleton curves showed a relatively steep decline after the peak value, and the bearing capacity degraded relatively rapidly.
3.3. Experimental Results
The cracking load Pcr, the cracking displacement ∆cr, the yield load Py, the yield displacement ∆y, the ultimate load Pu, the displacement corresponding to the ultimate load ∆max, the ultimate displacement ∆u, the load corresponding to the ultimate displacement P’u, elastic plastic story drift angle θp and ductility factor μ of each specimen are shown in Table 4. In the current code, the limit values for the elastoplastic inter-story drift are 0.02 and 0.008 for a frame structure and shear wall structure [6], respectively. The data were between 0.021 to 0.033, which were all greater than the limits. The elastic plastic interstory drift index of reinforced concrete frame structures, structure failure was 0.016 [8], so the specimens were failure. The specimens ductility coefficient were satisfied with seismic fortification requirements in basically [9].
| Specimens | The axial compression ratio | Loading direction |
Pcr (kN) |
Δcr (mm) |
Py (kN) |
Δy (mm) |
Pmax (kN) |
Δmax (mm) |
Pu (kN) |
Δu (mm) |
μ | θp(rad) |
|---|---|---|---|---|---|---|---|---|---|---|---|---|
| KZYQ1 | 0.31 | positive | 70.0 | 3.8 | 186.7 | 16.2 | 230.1 | 30.0 | 173.5 | 40.0 | 2.4 | 0.033 |
| reverse | 90.0 | 8.7 | 191.7 | 20.0 | 253.9 | 30.0 | 216.9 | 40.0 | 2.0 | 0.033 | ||
| KZYQ2 | positive | 70.0 | 3.2 | 186.1 | 15.0 | 228.0 | 25.0 | 133.1 | 40.0 | 2.6 | 0.030 | |
| reverse | 70.0 | 7.1 | 176.5 | 18.0 | 253.6 | 35.0 | 210.6 | 40.0 | 2.2 | 0.033 | ||
| KZYQ3 | 0.36 | positive | 100.0 | 7.9 | 143.0 | 12.0 | 212.4 | 25.0 | 114.5 | 38.0 | 3.1 | 0.031 |
| reverse | 80.0 | 9.9 | 161.1 | 18.0 | 252.2 | 30.0 | 226.3 | 35.0 | 1.9 | 0.029 | ||
| KZYQ4 | positive | 90.0 | 6.7 | 161.7 | 13.5 | 218.6 | 25.0 | 149.3 | 38.0 | 2.8 | 0.031 | |
| reverse | 90.0 | 7.9 | 172.5 | 15.0 | 273.7 | 30.0 | 245.4 | 35.0 | 2.3 | 0.029 | ||
| KZYQ5 | 0.40 | positive | 110.0 | 5.3 | 151.2 | 12.0 | 194.5 | 16.0 | 166.2 | 25.0 | 2.1 | 0.021 |
| reverse | 110.0 | 5.1 | 180.7 | 12.0 | 201.9 | 16.0 | 166.9 | 25.0 | 2.1 | 0.021 | ||
| KZYQ6 | positive | 80.0 | 4.8 | 138.8 | 12.0 | 197.7 | 20.0 | 166.2 | 25.0 | 2.1 | 0.021 | |
| reverse | 80.0 | 3.9 | 165.3 | 12.0 | 197.9 | 20.0 | 150.6 | 25.0 | 2.1 | 0.021 |
| Specimens | Axial force (kN) | The calculated value of ultimate load of column (kN) | Tested value of positive horizontal peak load (kN) | Tested value of reverse horizontal peak load (kN) | Positive increase of load (%) | Reverse increase of load (%) |
|---|---|---|---|---|---|---|
| YQKZ1 | 573.5 | 54.0 | 230.1 | 253.9 | 326.2 | 370.3 |
| YQKZ2 | 573.5 | 54.0 | 228.0 | 253.6 | 322.2 | 369.6 |
| YQKZ3 | 666.0 | 56.1 | 212.4 | 252.2 | 278.6 | 349.6 |
| YQKZ4 | 666.0 | 56.1 | 218.6 | 273.7 | 289.7 | 387.9 |
| YQKZ5 | 740.0 | 57.3 | 194.5 | 201.9 | 239.6 | 252.5 |
| YQKZ6 | 740.0 | 57.3 | 197.7 | 197.9 | 245.1 | 245.5 |
3.4. Stiffness Degradation
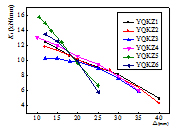
Under horizontal low-cyclic reverse loading, the deformations of the specimens developed constantly, and the stiffness gradually decreased with the increasing loads and displacements of the test pieces. The secant stiffness Ki can be used to represent the stiffness under a horizontal low-cyclic reverse loading:

where Pi represents the load under the control displacement and ∆i represents the displacement value corresponding to Pi. Fig. (11) shows the secant stiffness curves at different axial compression ratios of the specimens changing with the displacement. As the displacement increased, the secant stiffness of the test pieces gradually decreased.
3.5. Comparison Between Bearing Capacities Before and after Reinforcement
Before reinforcement, the ultimate horizontal load of each column was estimated according to the current code [10] by using the measured strengths of the concrete and steel. After reinforcement, the test values of the horizontal ultimate load adopted the ultimate loads of the skeleton curves under forward and reverse loadings.
Table 4 indicates that all of the specimens that showed large increases in the seismic capacity.
CONCLUSION
Six RC columns with post-build wing walls were tested under low cyclic reverse loading. The experimental phenomena and results were analysed, and in the research the following conclusions were drawn.
1) Post-build wing walls can increase the seismic bearing capacity of the frame columns; if the axial force is constant, the columns ability to resist horizontal seismic action can be significantly enhanced. When the axial compression ratio of the columns was increased, the ductility was reduced, and the degradation in stiffness accelerated after reinforcement.
2) Under low reverse cyclic loading, the wing walls experienced the process of cracking, cracking development, yielding of the longitudinal reinforcement close to the edge of the cross-section, and crushing of the concrete at the edge of the compression zone. There were also relatively lightly damaged columns. Thus, the post-build wing walls achieved the purpose of resisting horizontal earthquake action, effective energy consumption, and guaranteeing relatively light damage to the frame columns under vertical and horizontal loadings.
3) Note that, the post-build wing walls did not bear a vertical load, the horizontal cracking load decreased relative to the length-to-thickness ratio of the same section on shear wall and special-shaped columns. This delays the point at which the wing walls are crushed. Experiments will be performed as a follow-up to evaluating the seismic performance of post-build wing walls for RC frame columns through nonlinear finite element analysis, and the results will be used to develop suggested guidelines.
CONFLICT OF INTEREST
The authors confirm that this article content has no conflict of interest.
ACKNOWLEDGEMENTS
This research was financially supported by: Changjiang Scholars Program of China (2009-37), Harbin Institution of Technology “985 Project” Innovation team-building Program (2011), Key Program of Natural Science Foundation of Heilongjiang Province (No.ZD2015010), Education Department Subject of Heilongjiang Province(12535047).


