All published articles of this journal are available on ScienceDirect.
Structural Analysis of Bus Networks Using Indicators of Graph Theory and Complex Network Theory
Abstract
The structure of bus network is very significant for bus system. To evaluate the performance of the structure of bus network, indicators basing on graph theory and complex network theory are proposed. Three forms of matrices comprising line-station matrix, weighted adjacency matrix and adjacency matrix under space P are used to represent the bus network. The paper proposes a shift power law distribution which is related average degree of network to fit the degree distribution and a method to calculate the average transfer time between any two stations using adjacency matrix under P space. Moreover, this paper proposes weighted average shortest path distance and transfer efficiency to evaluate the bus network. The results show that the indicators that we introduce, effectively reflect properties of bus network.
INTRODUCTION
Bus has been widely regarded as a tool to alleviate the increasingly serious urban challenges from traffic congestion, noise, air pollution etc. With the rapid development of bus in urban cities, the demand for an effective method to evaluate the bus network is increasing sharply. Efficient evaluation indicators play an important role in measuring the network and guiding the network design or network modification. From the design point of view, bus network design comprises five stages including line design, frequency setting, timetable development, bus scheduling and crew scheduling [1]. Many indicators related with the five stages have been proposed such as commercial speed, frequency, reliability, safety, accessibility, productivity and synchronization to apply for bus evaluation [2-4].
Bus network structure is the fundamental part of a bus system, which plays a key role in the bus service system. To evaluate the network structure, graph theory is a useful tool that has been successfully applied to many fields. Gattuso and Mirello evaluated metro networks of 13 big metropolitans with proposed new indicators based on the graph theory and geography [5]. Derrible and Kennedy proposed two indicators and studied 19 subway systems worldwide. The relationship between ridership and network design was studied by using updated graph theory concepts [6]. Mishra, et al. recently studied the public bus connectivity in multi-modal transportation networks [7]. They proposed measures to determine connectivity from graph theoretical approach. Recently, Ek et al. studied star-like graphs and subway network of Atlanta and found that the subdivided star networks can be efficient models for subways [8].
Bus network is a little different from subway network, which has larger network size and complex structure. For subway network, it is easy to visualize and find the most overlapping segment. However, it is quite hard to visualize the bus network because of the network size. Complex network is a new tool that is based on graph theory and offers several indicators that are useful for bus network study. Sienkiewicz and Holyst examined 21 public transport networks in Poland and they found that the degree distribution can follow a power law distribution p=k-γ [9]. Xu et al. studied the bus networks of Beijing, Shanghai and Nanjing in China; they used degree distribution, clustering and average path length to measure the bus networks [10]. Ferber et al. used four spaces to represent the bus network and studied the shortest path, between centrality and harness [11].
The former researches rarely considered the impact of distance between stations. To fill this gap, this research used three forms of matrices to represent the bus network; line-station, weighted adjacency matrix, adjacency matrix in Space P. The aim of this paper was to introduce new indicators and to find the relationship between the indicators, we introduced the new ones and those that have been proposed in the former researches. The indicators that we used originated from traditional graph theory and new complex network theory. The data we collected contained nearly all structure characters including lines, stations, distance between any two adjacent stations and the number of overlapped segments. Indicators could be deduced from the three forms of matrices.
In this paper, two new indicators were introduced. The relationship between the bus network characters was found out. The structure characteristics of bus network were researched from both the macroscopic view and microscopic view. Indicators that we have introduced can capture the structure characteristics, significant for transportation dynamics. This research is a fundamental part of bus system and could be utilized in preliminary bus network evaluation.
DATA
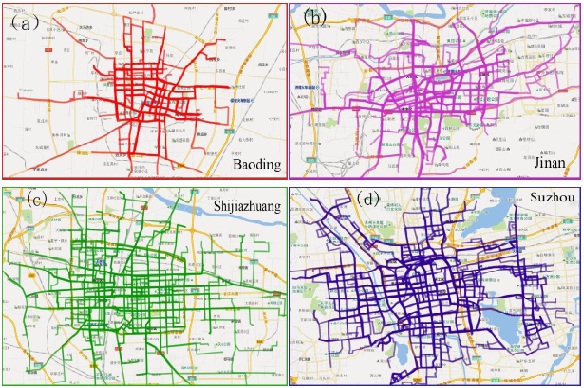
Four Chinese cities’ data including Baoding (BD), Jinan (JN), Shijiazhuang (SJZ) and Suzhou (SZ) were collected from the website (http://www.mapbar.com/). The data contain line length, stations in each line, line name, station name and distance between any two adjacent stations. Specifically, the data of Baoding bus network comprise 52 lines and 634 stations; Jinan comprises 100 lines and 883 stations; Shijiazhuang consists of 139 lines and 1299 stations; Suzhou includes 109 lines and 1402 stations. Fig. (1) shows the actual bus network of the four cities.
NETWORK REPRESENTATION
Here, we use three matrices to represent the bus networks. Fig. (2a) shows a simple bus network with three different lines. Typically, line-station matrix is widely used to represent a bus network. Fig. (2b) shows the line-station matrix of (Fig. 2a) with each row showing a line, the first column representing the line number and the rest of the columns expressing the stations. The matrix shows that there are three lines in the network: (1) 1-2-3-4-5-6, (2) 7-8-4-3-9-10, (3) 2-8-5-9. The most commonly used matrix in graph theory is the adjacency matrix. In Fig. (2c), the weight adjacency matrix is used to represent the bus network. The weight can describe many meanings such as segment length, the number of overlapped segment or the volume of the segment. The last matrix we introduced is a matrix under Space P which is a concept in complex network theory. In the matrix, all the nodes in a line are connected with each other, which is shown in Fig. (2d).
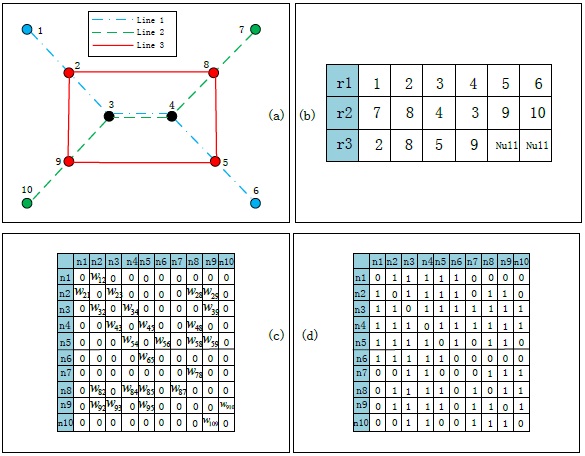
The adjacency matrix has been widely used in the graph theory. The basic adjacency matrix is the network with weight ωij=1, i, j ϵ { 1,.....,N} where stands for the number of nodes. In this paper, besides the basic adjacency matrix, weight standing for segment length and the number of overlapped links are also used.
Specifically, we first obtained the line-station matrix including the distance between the two adjacent stations from the website. Then, the weighted adjacency matrices were constructed from the line-station matrix and the weights representing the distance between any two adjacent stations and the number of overlapped links. The common adjacency matrix was obtained from the weighted matrices. The P space matrix can be achieved from the line-station matrix. The three forms of matrices were useful to grasp the characteristics of networks by deducing the indicators. Using the three forms of data, the proposed indicators can be easily achieved.
INDICATORS
There are many indicators which are based on graph theory to subway networks. Before we introduce the new indicators, some of them have been used to evaluate the subway network. These indicators have been well discussed in the paper of Gattuso and Miriello [5] and are shown in Table 1.
| Variable | Symbol | Equations | BD | JN | SJZ | SZ |
|---|---|---|---|---|---|---|
| Number of nodes | N | - | 634 | 883 | 1299 | 1402 |
| Number of lines | NL | - | 52 | 100 | 139 | 109 |
| Number of links | A | - | 882 | 1171 | 1894 | 2041 |
| Network length | L |

|
808.3 | 1338.4 | 2208.7 | 2417.3 |
| Average line length |

|

|
15.5 | 13.4 | 15.9 | 22.2 |
| Average link length |

|

|
0.52 | 0.60 | 0.66 | 0.65 |
| Net network length | LN |

|
455.2 | 701.3 | 1248.7 | 1336.5 |
| Network weight | P |

|
3530 | 4684 | 7576 | 8164 |
| Average weight of the network nodes |

|

|
5.57 | 5.30 | 5.83 | 5.82 |
| Average number f destinations in direct way | ND |

|
59.86 | 61.55 | 52.85 | 87.64 |
| Connection indicator | τ |

|
0.466 | 0.443 | 0.487 | 0.486 |
| Complexity indicator | β |

|
1.392 | 1.326 | 1.458 | 1.456 |
| Number of network loops | M |

|
249.5 | 289 | 596 | 640 |
| Available of loops | αM |

|
0.198 | 0.164 | 0.229 | 0.229 |
| Line overlapping degree | θl |

|
0.437 | 0.476 | 0.435 | 0.447 |
| Network specific weight | λ |

|
7.755 | 6.679 | 6.067 | 6.108 |
| Network extension | p |

|
13.47 | 15.08 | 33.57 | 35.45 |
| weighted average shortest path distance | ψ |

|
17.14 | 32.99 | 31.64 | 30.65 |
| Degree efficiency | η |

|
1.86 | 1.04 | 1.26 | 1.06 |
In this paper, some complex network indicators such as degree, average shortest path, cluster coefficient, efficiency, degree correlation, community structure and average transfer time that have been introduced by Zhang et al. [12] are used (see in Table 2). The degree of node is defined as the number of nodes connected; the average shortest path refers to the mean shortest path distance of adjacency matrix; cluster coefficient is a property of characterizing the local cohesiveness of the current node or the extent to which the nodes in the network are clustered together; efficiency is the indicator related to the shortest path; degree correlation reflects the model of connection between nodes and community structure shows the close connection of some nodes in the network.
Here, two new indicators are introduced to reflect the properties of bus network: weighted average shortest path distance and degree efficiency. The indicators refer to the factors of actual link length and node degree which have rarely been considered in evaluating the bus networks.
| Variable | Symbol | Equation | BD | JN | SJZ | SZ |
|---|---|---|---|---|---|---|
| Average degree |

|

|
2.78 | 2.65 | 2.92 | 2.91 |
| Average shortest path | l |

|
13.82 | 20.9 | 14.9 | 18.2 |
| Clusters | C |

|
0.056 | 0.06 | 0.09 | 0.08 |
| Efficiency | E |

|
0.101 | 0.072 | 0.09 | 0.074 |
| Correlation coefficient | r |

|
0.117 | 0.266 | 0.195 | 0.169 |
| Number of community | Z | Gephi | 19 | 22 | 23 | 19 |
| Modularity | Q |

|
0.838 | 0.86 | 0.854 | 0.869 |
| Average transfer time | atr |

|
1.068 | 1.314 | 1.464 | 1.242 |
Weighted average shortest path distance: The weighted average shortest path distance is to reflect the actual feeling of path distance which combines with the factor of transfer time. The weighted average shortest path distance (ψ) is defined as follows
 |
(1) |
Where, N is the number of nodes, sij is the actual average shortest path distance which means the weighted matrix we used is with actual distance between node i and node j, trij is the number of transfer time between node i and node j.
Transfer efficiency: In a bus system, transferring from one line to other lines is ubiquitous. In this paper, transfer efficiency is introduced to probe the network intrinsic property combing transfer time and degree. The transfer efficiency (ξ) is defined as
 |
(2) |
Complex network researches show that most of the bus networks are assortative correlation networks, which means that nodes with larger degree have tendency to connect nodes with larger degree directly. Transfer efficiency can reflect the transfer mechanism in bus network basing on complex network theory.
Table 1 shows the values of indicators we introduced. We can see that Suzhou has the largest scale of bus network from network length perspective. The smallest value of weighted average shortest path distance is Baoding, with a value of 17.14 compared with 32.99, 31.64 and 30.65 in Jinan, Shijiazhuang and Suzhou, respectively. This is easily understandable because of the small scale of network. For degree efficiency, Baoding has the largest value. For the transfer efficiency, Baoding has the smallest value and Jinan has the largest value, which means that Baoding has better transfer condition compared with other three cities.
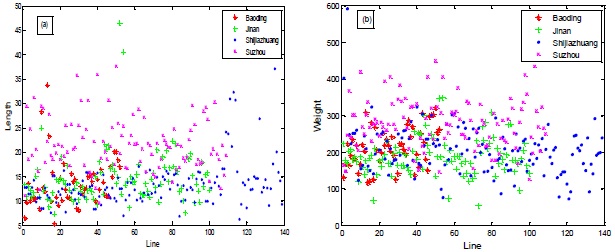
Line is the basic unit to construct bus network and plays an important role in efficiency of bus network. To better understand the four bus networks, Fig. (3a) gives the line length and Fig. (3b) gives line weight in the four cities. Here, line weight is defined that the sum of all nodes degree in the line. From the figures, it can be seen that Suzhou has numerous larger length lines and the lines with greater weight.
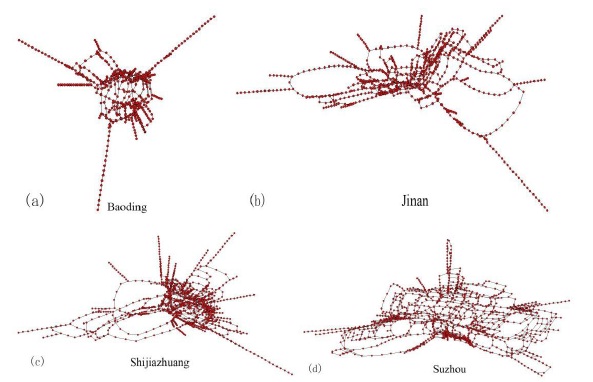
Complex network theory is a useful tool to analyze complex networks such as Internet, social network, electricity network, biological network and transportation network. In this paper, the complex network indicators are introduced to analyze the four bus networks. Complex theory focuses on the topological structure and does not provide connection details. Here, we represent network as a graph using common adjacent matrix. Based on the adjacency matrix, the topology maps of four bus networks are given in Fig. (4). From the pictures, the connections between the nodes are shown visually.
Degree distribution is an important concept in complex network theory. The degree ki of node iis defined as the number of nodes connected with the node i, which reflects the importance of the node i. In this paper, nodes represent stations and the degree of a node represents the number of neighbor stations.
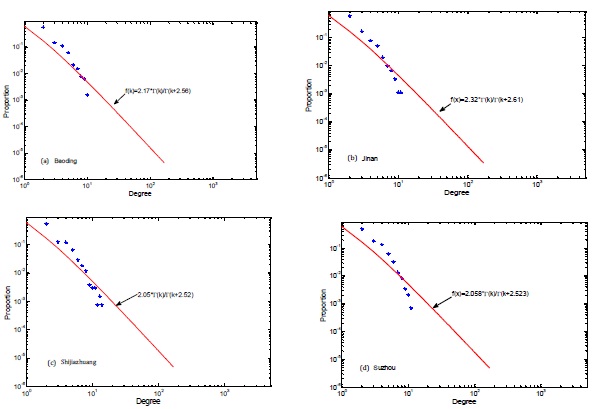
The former research shows that the degree distribution of bus network follows a power distribution. We find the shifted power law distribution which is related to the average degree of the bus network and can better fit the degree distribution.
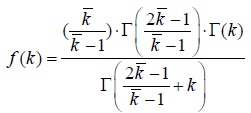 |
Where, f(k) is the proportion of degree,
 is the average degree of bus network and k is the degree. Fig. (5) gives the degree distribution and fitting function of four bus networks.
Besides degree distribution, average degree, average shortest path, clusters, efficiency, correlation, number of community, modularity and average transfer time are important indicators to measure complex network. Notably, it is convenient to calculate the average transfer time using P space. A network under P space is the matrix which shows that there is a link between any two nodes in a line.
Using Floyd shortest path algorithm to calculate the shortest path between any two nodes in the matrix, the result is the number of necessary lines to use. The transfer time is calculated by the formula:
 |
(3) |
where atr is average transfer time,
 is the shortest path distance between node i and node j under P space.
Table 2 gives the symbols and values of complex network indicators of four cities. From the table, it is notable that Baoding has the highest efficiency value and lowest average shortest path value and average transfer time value. The results show that Baoding network is the optimal among the four cities under complex network theory.
DISCUSSION
From the results of indicators, it can be observed that the indicator of weighted average shortest path distance can effectively reflect the distance between origin station and destinations while considering the transfer feeling. Large value of the indicator reflects the shortage of network. The result shows that Baoding has the smallest value of weighted average shortest path and Jinan has the largest value. With respect to degree efficiency, the large value means that the bus network has the characteristic that the distance between nodes with larger degree is small. The result conforms to the requirement that the connection between busy stations should be convenient. Baoding has the largest value of degree efficiency and Jinan has the smallest value, which means the performance of Baoding outweighs Jinan’s. Transfer efficiency reflects the relationship combing transfer time and degree. Small value means less transfer time between nodes with larger degree. Baoding has the smallest value and Jinan has the largest value.
CONCLUSION
This paper studied four cities’ bus networks using indicators that were based on graph theory and complex network theory. Considering the complex structural characteristics of bus network, three new indicators were introduced to measure the effectiveness of the bus network. Two new indicators consider the factors of degree, the actual shortest path and transfer time that are very important for the performance of bus network. The results indicate that the three indicators can evaluate the bus network effectively from their perspectives. In this paper, 28 indicators basing on graph theory and complex network theory were used to evaluate the bus network. The results show that there is no network in the four cities which can be effective in showing good performance on the whole. From a comprehensive perspective, the performances from good to bad in the four cities are: Baoding, Shijiazhuang, Suzhou and Jinan.
Three matrices were used to present the bus network. It is easy to calculate the value of the indicators that has been introduced using these three matrices. Moreover, this paper also investigated the degree distribution in bus network. A shifted power law distribution with the average degree was proven to fit the degree distribution well. The topological structures of the four networks were shown, and adjacency matrix under P space to calculate the average transfer time was introduced. Complex network theory is a useful tool to evaluate the bus network. The results indicate that the indicators basing on the graph theory and complex network theory could well be applied to evaluate the structure when designing a bus network.
The future work will consider the origin-destination demand when calculating the average transfer time. The mechanism of how the indicators reflect the characteristics of bus network would be discussed in the future. Furthermore, to give a comprehensive evaluation, operational factors such as frequency and timetable should be considered.
CONFLICT OF INTEREST
The authors confirm that this article content has no conflict of interest.
ACKNOWLEDGEMENTS
The Project was supported by the open fund for the key laboratory for traffic and transportation security of Jiangsu province (TTS2016-02).


