All published articles of this journal are available on ScienceDirect.
A Simplified Simulation Model to Estimate the Storage Length of the Right-Turn Lane in Left-Hand Traffic at Signalised Intersections for Different Signal Phases and Cycle Timings
Abstract
Introduction:
A large number of the current guidelines and models are used to estimate the right-turn lane (RTL) length in left-hand traffic at signalised intersections under split phase, in which the movement of traffic in the right-turn lane and through lane happen concurrently. There is a need to examine other phase types and timings as a part of the RTL design. This is particularly significant in the case of established intersections that cannot be modified due to physical constraints.
Methods:
A MATLAB based simulation programme was developed to provide an estimate of the right-turn lane storage length for different traffic volumes in order to avoid the problems associated with blockage and overflow of the right turn vehicles in 95% of the traffic signal cycles. The model enhances flexibility when dealing with the complexity of the design of the storage length taking into account different signal phases and timings to overcome the aforementioned problems. The simulation model also takes into consideration the left-over queue from the previous cycle which was ignored by most of the previous studies.
Results and Conclusion:
The model input includes as a configuration matrix containing the sequence of operational states of the intersection. This ensures the flexibility and the simplicity of manipulating the data to reflect all phase types and timings. The model results have been compared against a recently developed analytical model in which similar signal phases and timings were investigated. The outcomes agree to the results that are obtained from the analytical model in most of the signal phases. The developed simulation model is flexible enough to be used further to simulate the situation when there is a large difference between the approaching and opposing traffic volumes and optimise the green time in case of split phase. In this study, the simplified simulation model for estimating the RTL storage length has been developed for the left-hand traffic countries; however, the study is equally applicable to the left-turn lane (LTL) in right-hand traffic countries.
1. INTRODUCTION
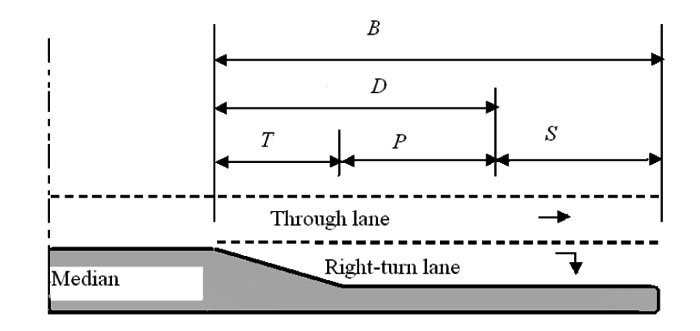
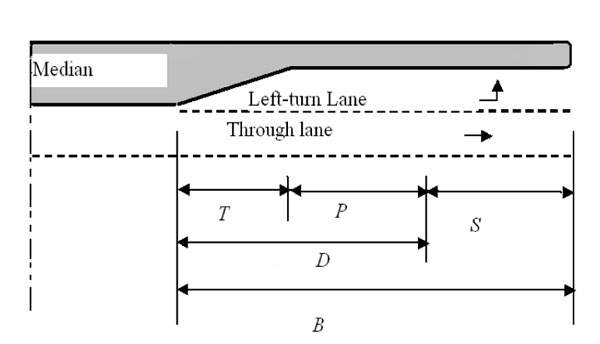
The design of the right-turn lane in signalised intersections involves several variables. Some are associated with the signal phasing and timing and the others are associated with traffic parameters, such as through lane and turn lane traffic volumes, arrival rate and headway. According to the American Association of State Highway and Transportation Officials [1] as well as the Association of Australian and New Zealand Road Transport and Traffic Authorities [2], the lane length comprises of taper length, deceleration length and storage length as shown in Fig. (1a). The main aim of this study is the estimation of the storage length.
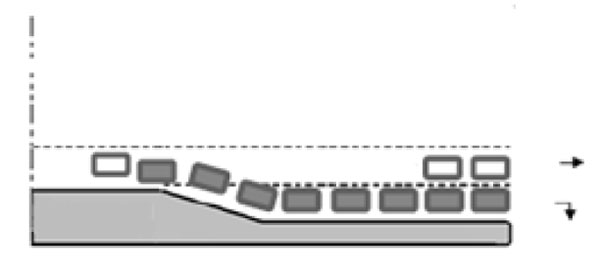
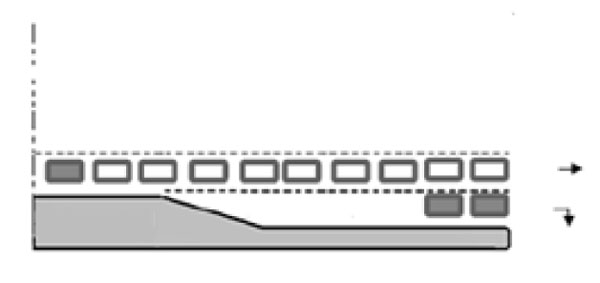
The design of the storage length should be sufficient to avoid the overflow of the cars from the right-turn lane that may hinder the flow of the through traffic while preventing the blockage of the right-turn lane that may be caused by the queue formed in the through lane [3-5]. The overflow and the blockage situations are depicted in Figs. (2a and Fig. (2b), respectively. The overestimation of the length would result in an unnecessary and costly feature; moreover, it will lure drivers to take this lane unintentionally causing safety concern [6].
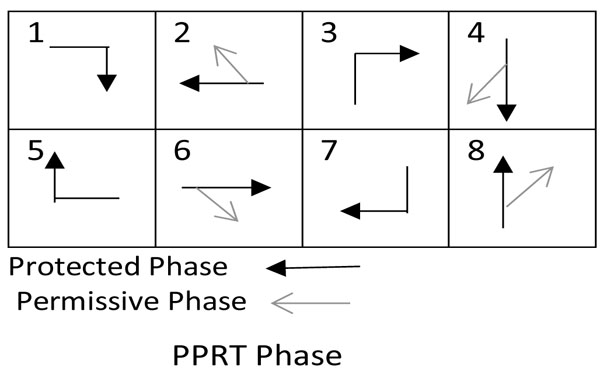
In this study, a simulation model has been developed to estimate the storage component of the right-turn lane length, considering two cycle lengths of 90 seconds and 120 seconds. The simulation model has been used to estimate the right-turn lane length for different approach traffic volumes at 30%, 50%, 70% turning probability for all possible phase types: (1) Split phase, in which the traffic movements for the through lane and right-turn lane, at the same leg of the intersection, occur concurrently; (2) Protected only (PO) when the turn movement runs under green arrow followed or preceded by the through movement, PO-Leading, PO-Lagging, respectively; (3) Permissive only (PmO) in which the turn movement can occur when it is safe to turn giving way to the opposing traffic; (4) The protected/permissive right turn phase (PPRT) in which the turn movement phase alternates between permissive and protective. The signal phases are illustrated in Fig. (3) as Adapted [7]. The simulation results were compared against the analytical method developed by Kickuchi and Kronprasert [5].
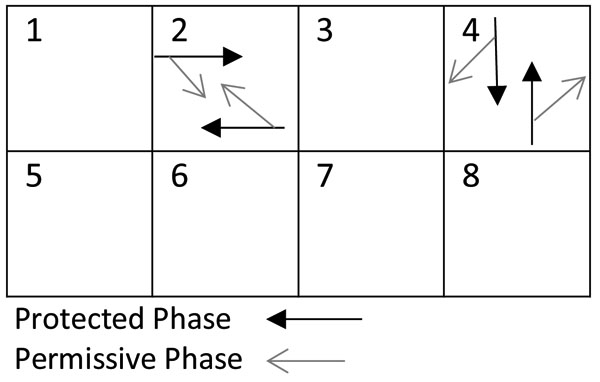
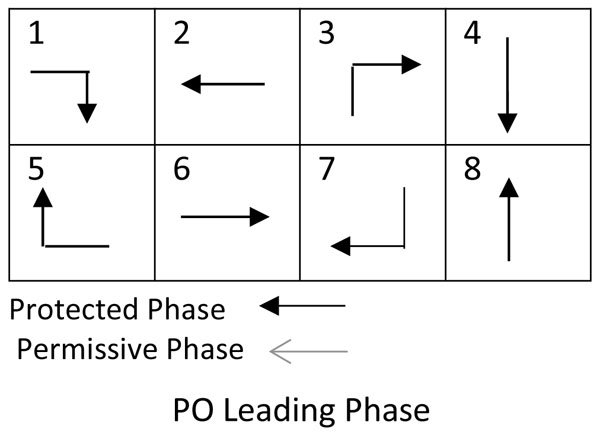
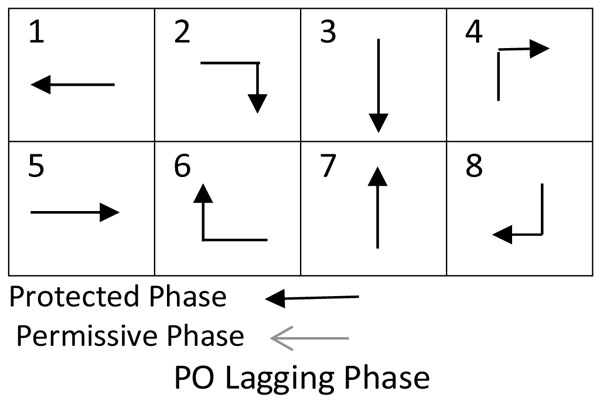
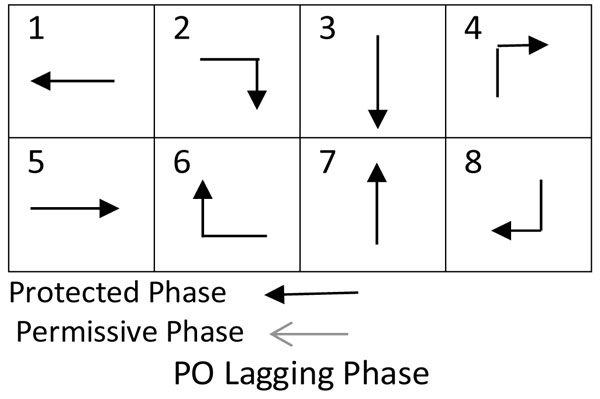
The inherent randomness of the arrival of vehicles and the stop and go characteristics of the traffic at signalised intersections contribute to the complexity of the design of the RTL of traffic, thus the traffic simulation is considered a useful approach for assessing traffic behaviour at signalised intersections [8]. The Australian Standard [2] also recommends the use of simulation software to simulate the intersection and analysing the data to estimate the required storage length based on the 95-percentile queue. However, the existing simulation-based software is either time consuming or lacking in accuracy [6]. Moreover, although several methods have been developed to estimate the storage length, there have been few attempts to provide a flexible model for integrating signal phases and timings for the designing of the RTL length.
2. BACKGROUND AND LITERATURE REVIEW
Several models have been developed to estimate the storage length of the right-turn lane at signalised intersections based on different methods. Guidelines such as the American Association of State Highway and Transportation Officials [1], and Texas department of Transportation [9] prescribe a rule of thumb method by assuming the length of the lane to be 1.5-2 times the average number of turning vehicles during one cycle, considering that this ratio would be sufficient to cater for the burst in peak hour. The rule of thumb method only considers the problem associated with the right-turn lane overflow and does not consider the departure rate; hence it misjudges the estimation of right-turn lane length.
Using an analytical method, Oppenlander and Oppenlander [10] developed a model based on queue theory, assuming a Poisson random distribution for the arrival rate and an exponential distribution for the departure rate. This model assumes a constant serving queue ignoring the non-constant characteristic of the traffic flow at signalised intersections. Furthermore, as was the case for rule of thumb method, this model only considers the overflow of vehicles in the right-turn lane and does not consider the blockage situation. To rectify these models, Kikuchi et al. [3] used a discrete time Markov chain-based method (DTMC) to estimate the queue length of the right-turn lane at signalised intersections. The DTMC reflects on preceding and present probabilities of states to predict the next state of the system, considering a probability of right-turn lane overflow of < 0.02 and a probability of blockage due to through lane queue of < 0.01 emphasising the need to consider the blockage situation. The method developed by Kickuchi et al. [3] considered the continuous and the inherent randomness of the traffic flow as well as the impact of traffic signals on the right-turn lane queue; however, the model fell short of considering the leftover queue at the end of the green-phase, that should be added to the formed queue during the red-phase in the proceeding cycle, thus this method results in underestimation of the queue length.
In order to account for the arrival flow during the red-phase and both the overflow and blockage problems combined, Kikuchi et al. [4] developed a model for dual right-turn lanes and a single through lane considering low probability (1% - 5%) of the occurrence of overflow or blockage problem based on the assumptions that the queues in the through lane and the right-turn lane are formed only during the red-phase. In other words, neglecting carry over queues from the previous cycle, as was the case in the previously mentioned study [3]. This assumption was examined and found to be unjustified as carryover queues were observed in 20% of the cycles [8]; however, it was a good attempt to cater for overflow and blockage situation combination.
Qi et al. [8] developed a different model based on DTMC emphasising the need to design the right-turn lane length to be adequate to store the longest predicted queue taking into account the left-over queue at the end of the green phase of the previous cycle in addition to the queue formed during the red phase.
In an attempt to cater for all the situations that may arise due to different signal phases and timings, Kikuchi and Kronprasert [5] developed several formulas to calculate the storage length using a 5% threshold for blockage or overflow situations. This study recommended storage lengths for different signal phases, timings and traffic volumes in both through and turn lanes. The results show that the volume of the opposing traffic does not affect the right-turn lane length when the right-turn lane volume is small. It also indicates that the leading right-turn lane signal phase produces shorter lengths comparing to the lagging right-turn phase.
Using simulation-based methods many researchers examined the problems of calculating appropriate queue lengths. Oppenlander and Oppenlander [11, 12] conducted investigations using a Mont Carlo based simulation model, to estimate the left-turn queue length. These studies were only for signalised intersections that use separate signal phase in which the right-turn movement is allowed only as protected. Therefore, a more complex model was developed by Oppenlander and Oppenlander [13] to calculate the storage length in permitted right-turn lanes. In addition to cycle length and green time the variable of opposing traffic volume was defined as any conflicting movement with the vehicle in the right-turn lane and was taken into consideration in the model. However, the simulation model did not consider the permissive protected phase that could be required during peak hours.
As part of an investigation to calculate the queue length for the right-turn lane at signalised intersections, Qi et al. [6] examined the performance of simulation based software such as SimTraffic and VISSIM and concluded that: 1. VISSIM overestimated the queue lengths in some cases due to a problem in separating the turn lane queue from the through lane queue when overflow and blocking situations occur; 2. SimTraffic results provide more accuracy, however, it takes long time to calibrate and run the simulation.
The brief review as presented here highlights the complexity associated with the design of the RTL storage length at signalised intersections and the limitations of the existing models. The aim of this study was to provide a simple simulation model that can incorporate the phase types and timings to estimate the RTL storage length meanwhile addressing both the overflow and the blockage situations.
3. PROPOSED SIMULATION MODEL
The simulation model represents the situation in which cars/vehicles arrive at a set of traffic light with the option of continuing straight or turning right. There is only one lane of traffic approaching the intersection which branches into a straight lane and a tuning lane. The traffic signals operate on a fixed time/periodic sequence and can allow for both permissive and protected right-turn signal flow. Any vehicles left in the queue when the traffic light turns red remain in the system ready to depart during the next green phase. The model developed here considers the following assumptions:
- Traffic is assumed to arrive randomly and is modelled using a Weibull distribution with shape parameter equal to one. Traffic in the opposing direction is also assumed to arrive randomly and is allowed to have a different mean rate of arrival.
- Under green light conditions, it is assumed that the traffic departs from the intersection at a constant rate. The departure rate is based on an average value of the time taken for cars to react to the movement of the car in front, and to travel the length of the queue.
- When the traffic light turns green, the first car is assumed to move off immediately without hesitation, however if the traffic lights change to a permissive phase, the first car will be delayed by a fixed amount of time. This delay is introduced to reflect the time taken for a permissively turning vehicle to assess whether it is safe to turn.
- Although there is no explicit consideration of left-turning traffic, it is assumed that left-turning traffic is subject to the same signal constraints as the straight traffic (i.e. no permissive left-turn).
- The length of the turning lane can be expressed in terms of a number of vehicles (i.e. vehicles are assumed to have a common length).
- The model calculates the length of the turn lane that avoids the overflow and the blockage situation in 95% of the cycles.
4. DESCRIPTION OF ALGORITHM
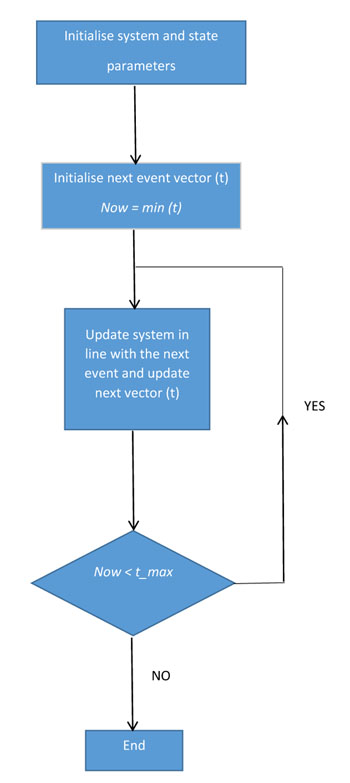
The overall structure of the simulation model is illustrated in Fig. (4). Once the system and state parameters have been initialised, the simulation algorithm defines a next event vector. The next event vector has four entries, each corresponding to a specific type of event that will change the state of the system: 1. A new vehicle arrival; 2. A vehicle departure from the straight lane; 3. A vehicle departure from the right-turn lane; 4. A change in the traffic light signals. The entries in the next event vector represent the next time at which each of the above events will occur. The minimum time value in the next event vector indicates the next event and is labelled ‘Now’. Once the next event vector is defined, the next event is identified (i.e. the event with the minimum next time value), and the system is updated accordingly. If the maximum simulation duration ‘t_max’ has not been exceeded then the simulation algorithm returns to update the next event vector, and the cycle continues. Once the maximum simulation duration is exceeded the simulation terminates. A more detailed description of the above algorithm stages is provided as pseudo-code in the appendix.
4.1. Model Inputs
The model inputs as considered are given below:
- The peak approach traffic volume as the number of vehicle per hour per lane (vphpl)
-
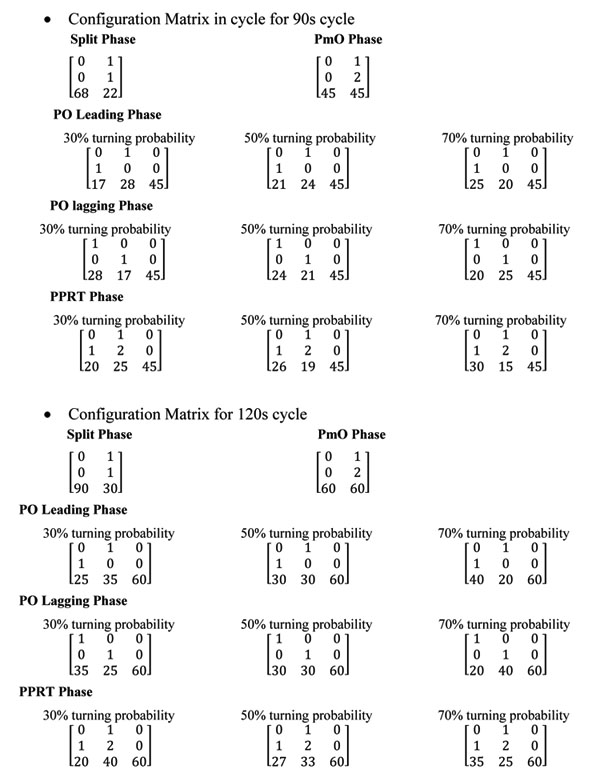
The phase type and timing concluded as a matrix (configuration matrix) containing the sequence of operational states of the intersection. Each column specifies a state in which the first row indicates whether the signal for the through lane is red (= 0) or green (= 1), the second row indicates whether the turning light is red, green or permissive (= 2), and the bottom row indicates the state durations shown in the matrix sample as below:

- The turning probability of the approach traffic volume
These inputs are used to design the RTL length to avoid the overflow and the blockage situations in 95% of the cycles. Thus, the RTL length is the 95th percentile of the through lane queue when the blockage is the limiting factor while the RTL length is the 95th percentile of the turning lane queue when the overflow is the restraining factor. This model could be used to evaluate the traffic operation at a certain intersection by inputting the existing RTL length as the number of vehicle.
4.2. The Procedure for Comparing the Simulation Results against the Analytical Model
The simulation model was run to estimate the right-turn lane length such that the blockage and the overflow are avoided in at least 95% of cycles. The simulation was tested for five different phase configurations under two different cycle lengths of 90 s and 120 s. The results were obtained for the turn probability values of 30%, 50% and 70%, and compared with the corresponding results from the analytical method by Kikuchi and Kronprasert [5]. The RTL lengths were examined for approaching traffic volumes of 200, 400, 600, 800 (vphpl) and was recorded in number of vehicles (veh) (Table 1). The phase timings are similar to the values suggested by Kikuchi and Kronprasert [5] for the purpose of comparison and validation. These values were entered into the configuration matrix as explained below:
| Right-Turn Signal Phase Type | |||||||||||||||||
|---|---|---|---|---|---|---|---|---|---|---|---|---|---|---|---|---|---|
| Approach | Split phase | Protected Phase | PPRT Phase | Permissive only | |||||||||||||
| Volume | Leading RTL | Lagging RTL | Opposing Traffic Volume | Opposing Traffic Volume | |||||||||||||
| (vphpl) | 200 vphpl | 600 vphpl | 200 vphpl | 600 vphpl | |||||||||||||
| KA | CS | KA | CS | KA | CS | KA | CS | KA | CS | KA | CS | KA | CS | ||||
| Cycle Length 90 s., percentage of right turn volume = 30% | |||||||||||||||||
| 200 | 4 | 5 | 4 | 5 | 4 | 5 | 4 | 5 | 4 | 4 | 3 | 4 | 3 | 4 | |||
| 400 | 8 | 9 | 8 | 8 | 8 | 8 | 8 | 8 | 6 | 8 | 5 | 6 | 5 | 6 | |||
| 600 | 11 | 12 | 11 | 11 | 11 | 11 | 11 | 11 | 9 | 11 | 8 | 9 | 8 | 9 | |||
| 800 | 14 | 16 | 14 | 14 | 14 | 14 | 14 | 14 | 11 | 14 | 10 | 11 | 10 | 11 | |||
| Cycle Length 90 s., percentage of right – turn Volume =50% | |||||||||||||||||
| 200 | 4 | 5 | 5 | 5 | 5 | 5 | 4 | 4 | 4 | 4 | 3 | 4 | 3 | 4 | |||
| 400 | 7 | 8 | 8 | 8 | 8 | 8 | 6 | 7 | 6 | 7 | 5 | 6 | 5 | 6 | |||
| 600 | 10 | 11 | 11 | 11 | 11 | 11 | 8 | 10 | 8 | 10 | 7 | 8 | 7 | 8 | |||
| 800 | 12 | 13 | 14 | 13 | 14 | 13 | 11 | 12 | 11 | 12 | 9 | 10 | 9 | 10 | |||
| Cycle Length 90 s., percentage of right – turn Volume =70% | |||||||||||||||||
| 200 | 4 | 6 | 5 | 5 | 5 | 5 | 4 | 4 | 4 | 4 | 3 | 4 | 3 | 5 | |||
| 400 | 8 | 9 | 10 | 9 | 10 | 9 | 7 | 7 | 7 | 7 | 5 | 7 | 5 | 7 | |||
| 600 | 11 | 13 | 14 | 12 | 14 | 12 | 10 | 10 | 10 | 10 | 8 | 10 | 8 | 10 | |||
| 800 | 14 | 16 | 18 | 16 | 19 | 16 | 14 | 12 | 14 | 12 | 10 | 12 | 10 | 14 | |||
| Cycle Length 120 s., percentage of right-turn volume = 30% | |||||||||||||||||
| 200 | 5 | 6 | 6 | 6 | 6 | 6 | 5 | 6 | 5 | 6 | 4 | 5 | 4 | 5 | |||
| 400 | 10 | 11 | 10 | 10 | 10 | 11 | 9 | 10 | 9 | 10 | 7 | 8 | 7 | 8 | |||
| 600 | 14 | 15 | 14 | 15 | 15 | 15 | 13 | 14 | 14 | 14 | 10 | 11 | 10 | 11 | |||
| 800 | 19 | 20 | 18 | 19 | 20 | 19 | 16 | 18 | 18 | 18 | 13 | 14 | 14 | 14 | |||
| Cycle Length 120 s., percentage of right–turn Volume = 50% | |||||||||||||||||
| 200 | 5 | 6 | 6 | 6 | 6 | 6 | 4 | 6 | 4 | 5 | 4 | 5 | 4 | 5 | |||
| 400 | 9 | 10 | 10 | 10 | 10 | 10 | 8 | 9 | 8 | 9 | 6 | 7 | 6 | 8 | |||
| 600 | 12 | 13 | 14 | 13 | 15 | 13 | 11 | 12 | 11 | 12 | 9 | 10 | 9 | 10 | |||
| 800 | 16 | 17 | 19 | 17 | 20 | 17 | 14 | 15 | 15 | 15 | 11 | 12 | 12 | 12 | |||
| Cycle Length 120 s., percentage of right–turn Volume = 70% | |||||||||||||||||
| 200 | 5 | 7 | 8 | 6 | 8 | 6 | 4 | 5 | 4 | 5 | 4 | 5 | 4 | 5 | |||
| 400 | 10 | 12 | 12 | 11 | 13 | 11 | 7 | 9 | 7 | 9 | 7 | 9 | 7 | 9 | |||
| 600 | 14 | 16 | 17 | 15 | 18 | 15 | 10 | 12 | 10 | 12 | 10 | 12 | 10 | 13 | |||
| 800 | 19 | 20 | 22 | 19 | 24 | 19 | 13 | 15 | 14 | 16 | 13 | 16 | 14 | 16 | |||
Phase Type and Timing Configuration Matrix Presentation
The model simulates each approach separately, so it could be used in a T intersection as well as the typical signalised intersections.
5. RESULTS AND DISCUSSION
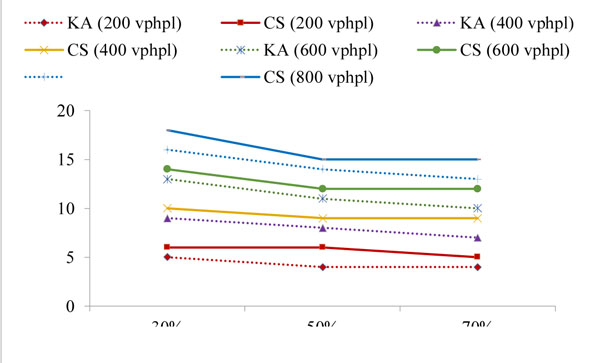
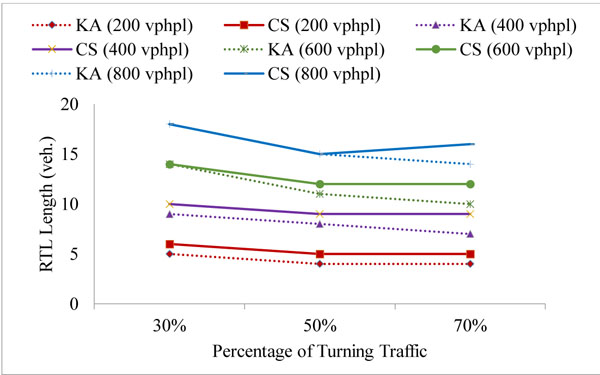
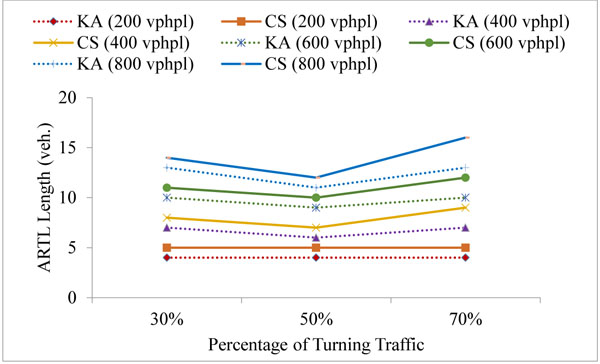
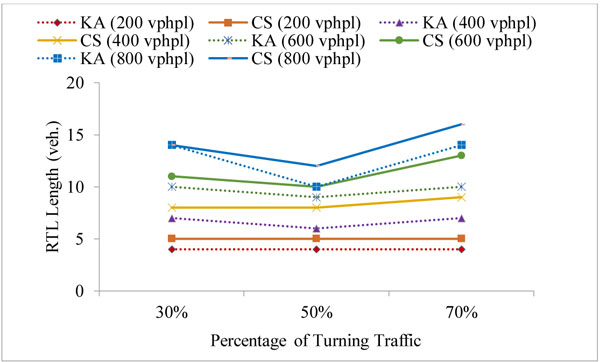
The simulation model was run to estimate the right-turn lane length such that the blockage and the overflow are avoided in at least 95% of cycles. The simulation was applied for 5 different signal phases and for 2 fixed cycle time: 90 s and 120 s. The results were obtained for the turn probability of 30%, 50% and 70%, and compared with the corresponding results from the analytical method by Kikuchi and Kronprasert [5]. The right-turn lane (RTL) lengths were examined for approaching traffic volumes of 200, 400, 600, 800 vehicles per hour per lane (vphpl) and have been given in Table 1 in number of vehicles (veh.) It may be noted that the phase timings are similar to the suggested values in Kikuchi and Kronprasert [5], for the purpose of comparison and validation. The comparison between the Kikuchi and Kronprasert analytical model (KA) and the current study (CS) were presented in Figs. (5 and 6) and Table 1.
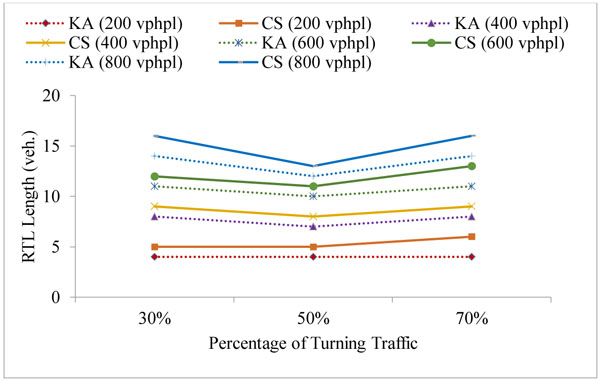
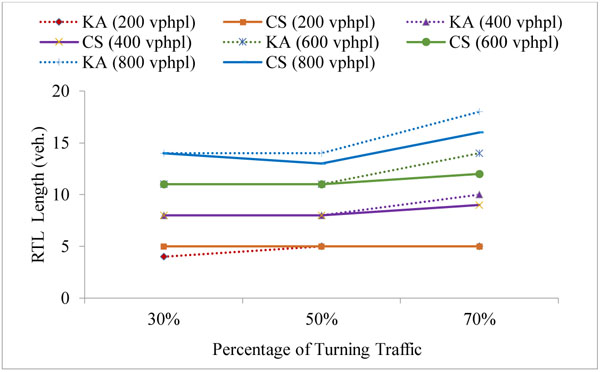
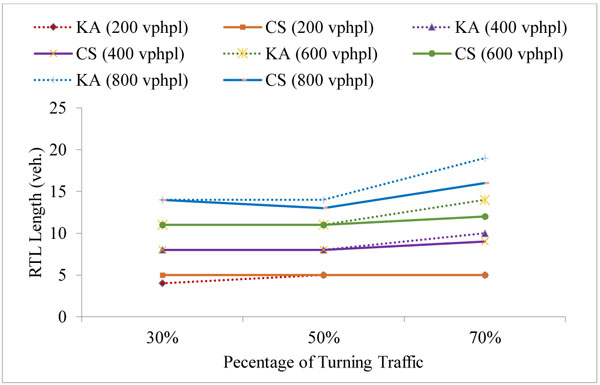
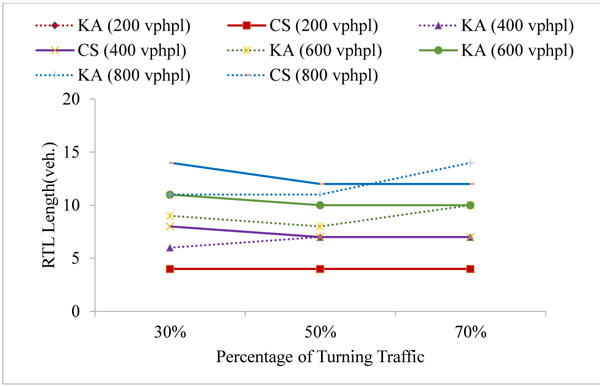
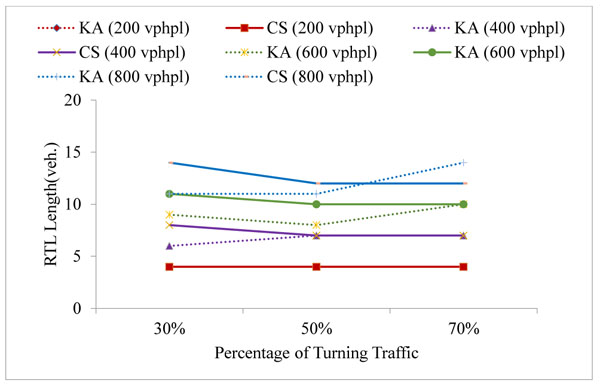
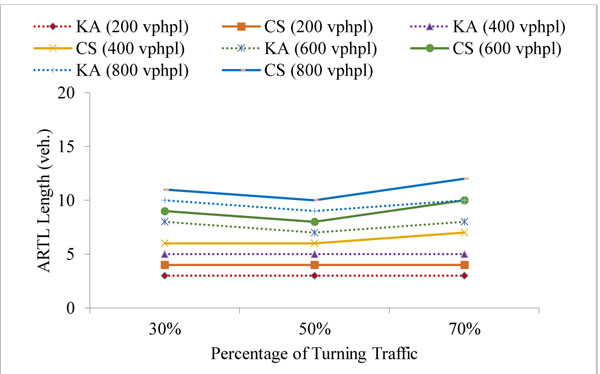
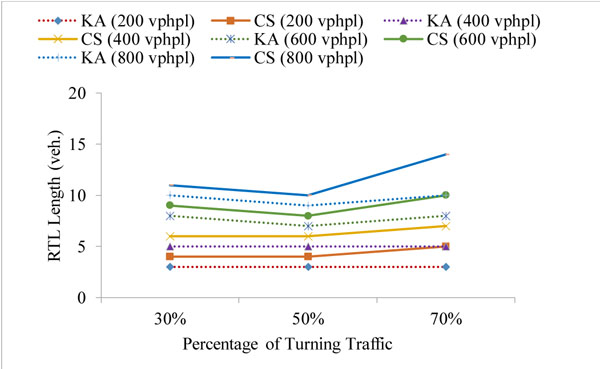
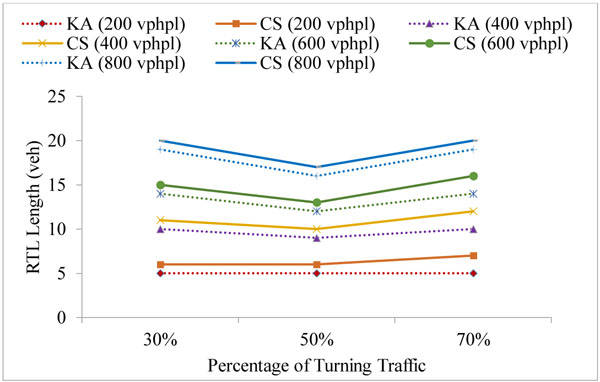
The simulation results were consistent with the corresponding results from the analytical method and indicated similar trends and values in most cases for the split phase, PO and PmO in the 90 seconds cycle as shown in Figs. (5a-c, f, g) and the split phase, PO, PmO and PPRT in the 120 seconds cycle as shown in Fig. (6). However, in the protected leading and lagging phase, the simulation results at 70% probability of right-turn traffic show a higher differential of up to 15% in comparison with the results that were obtained at a lower probability of right-turn traffic as illustrated in Figs. (5b, c, and 6b, c). This could be due to the analytical methods limitation in capturing the dynamic interaction between cars [6]. Naturally this dynamic interaction has more impact in high traffic volume.
The simulation results for the PPRT phase, in the 90 s cycle, Figs. (5d, e) show a slight declination in the estimated values when the percentage of the turning traffic was increased; this is justified by the fact that in the PPRT phase, the nature of the problem is due to blockage rather than overflow. When the right-turn traffic percentage increases, the traffic in the through lane decreases and the blockage risk declines, hence, less length is needed, in fact the same trend was obtained by Kickuchi and Kronprasert [5] for the PPRT phase in the 120 s cycle (Figs. 6d, 6e).
The results of the simulation model estimates slightly longer right turn-lane lengths in the PmO and PPRT phases; thus, agreeing with the finding from Kikuchi and Kronprasert [5] in which VISSIM software was used to validate the analytical model as blockage of up to 10% were observed in the PmO and PPRT phases, indicating underestimation of the lengths in these cases.
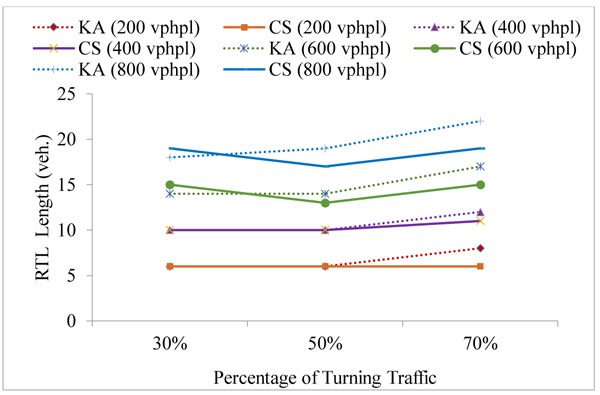
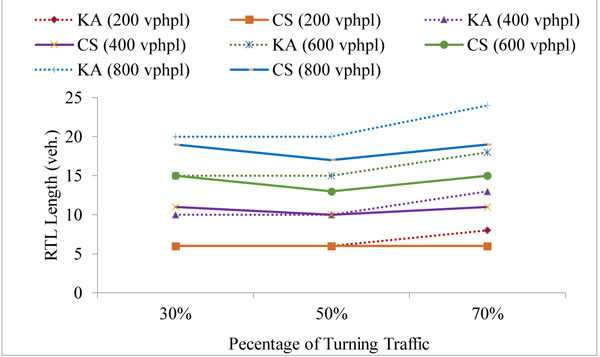
The simulation results agreeing with the finding of Kickuchi and Kronprasert [5], that are the volume of the opposing traffic does not affect the length required for the right-turn lane particularly when the turning traffic volume is small (Table 1).
While the analytical model shows a slightly shorter right-turn lane length in case of the protected leading phase than the one required in case of the lagging phase, the simulation results do not show any significant difference. This is due to the continuity of the simulation model and considering the left-over queue from the previous cycle.
In general, shorter lengths were required for the 90 s cycle compared to the 120 s cycle in agreement with the analytical method (Table 1). This could be due to the more frequent dissipation of the queues as a result of using shorter cycle period.
6. FUTURE WORK
Most of the current guidelines use the split phase system [5]. In the case of fixed time cycle length, the phase timing is the same, regardless of the density of the opposing traffic volume. Moreover, it is common that in urban intersections, the demographic characteristics and the direction of the Central Business District (CBD) affect the relative balance of those traffic volumes throughout the day. For example, in some intersections, the peak-hour occurs for north-bound traffic in the morning while, in the afternoon it occurs at the opposite direction, i.e., south-bound. This situation creates a significant traffic volume differential between approaching and its opposing traffic. It is logical to allocate more green time to the traffic volume which is reaching its peak, thus compromising the green time allocated for the opposing traffic. To optimise such intersections, the effectiveness of change or alternate green times should be investigated. Future study may investigate a method for estimating an optimal green time for each approach in case of split phase based on the traffic volume This method can be viable in case of traffic peak hours.
7. CONCLUDING REMARKS
The design of the RTL storage length should be considered from two equally important viewpoints:
• Minimising the frequency with which cars overflow the RTL causing the blockage of the through lane;
• Minimising the frequency with which queues of through traffic block turning cars from entering the RTL.
The current guidelines such as AASHTO [1] and TxDOT [9] have limitations in addressing both overflow and blockage situations. Specifically, the guidelines only consider problems associated with overflow. Moreover, there are few previous studies which have considered the integration of the signal phase types in the storage length design.
The developed simulation model can be used to estimate the storage length at signalised intersections for different phase types taking into consideration of the left-over queue that may not be dissipated during green time in the previous cycle. It also calculates the storage length to avoid the problems associated with the overflow and/or blockage of the right-turn lane in 95% of cycles for different approach and turn lane traffic volumes. The model considers the opposing traffic volumes in case of PPRT and PmO phases.
The developed model provides a flexible solution to estimate the right-turn lane length under different types and timings of phases. This can be adapted to integrate the signal phase and timings in the design when the right-turn lane length cannot be extended due to physical constraints.
For the purpose of validation against the available analytical model, the developed model uses similar parameters as used in the analytical model. The comparison agrees well in many cases. The storage lengths were slightly higher than the analytical model estimation in most of signal phase types, which is consistent with the limitation of the analytical model not considering leftover queues in the protected leading and lagging phases.
The developed simulation model can be utilised in the future to investigate the most appropriate signal timing in circumstances where the traffic density differs greatly in opposing directions (e.g., at peak hour times).
APPENDIX: PSEUDO-CODE - INITIALISATION OF SYSTEM AND STATE PARAMETERS
Initialise System Parameters
λ = Average time between arriving vehicles (s);
λappose = Average time between arriving vehicles in the opposing through lane (s);
tmax = Simulation duration (s);
p = Probability that an arriving vehicle wants to turn;
tgap = Minimum time gap between opposing vehicles to allow permissive turning (s);
= 4.1 sec. (Kikuchi &Kronprasert, 2010).
Tmax = Maximum vehicle capacity of turning lane;
Tdept = Departure rate of turning vehicles (vehicles/s);
Sdept = Departure rate of straight travelling vehicles (vehicles/s);
Config = Matrix defining traffic light sequence and timing. Each column defines a state in the traffic light sequence. The top row indicates the colour of the straight light in each state (red = 0, green = 1), the second row indicates the colour of the turning light in each state (red = 0, green = 1, permissive = 2), and the third row indicates the time(s) of each state;
Initialise State Parameters
State = Starting traffic light configuration (corresponding to columns of);
S = Number of vehicles in the straight lane;
T = Number of vehicles in the turning lane;
Mtrack = Vector indicating which cars in the straight lane want to go straight (0) and which cars want to turn (1) but cannot get into the turning lane due to a blockage/overflow situation;
Pseudo-Code: Initialise Next event vector (t)
Note: denotes a random number chosen from the uniform distribution on the interval Update next arrival time by generating a random arrival time using the exponential distribution with mean time between arrival lambda (
 );
);
If Straight Light is initially red Then
Set next straight departure to a large number as no cars can depart straight until after the next light change (t (2)= Large);
ElseIf Straight Light is initially green Then
Set next straight departure time to the current time (t (2)= Now);
EndIf
If Turning light is initially red Then
Set next turning departure to a large number as no cars can depart turning until after the next light change (t (3)= Large);
ElseIf Turning light is initially green Then
Set next turning departure time to the current time (t (3)= Now);
ElseIf Turning light is initially permissive Then
Initialise next turning departure time to now (t (3)= Now);
Calculate time until next opposing vehicle arrival (
 );
);
While t (3) < Now +Time until turning light changes to red
If Time unit next opposing arrival > Minimum time gap to cross Then
Next turning departure is can occur before the next opposing vehicle arrives, so update next turning arrival time and exit while loop (t (3)) = t(3)+ 1/tdept); Exit While
ElseIf Next opposing arrival < Minimum time gap to cross Then
Increase earliest time for next turning departure by the time until the next opposing arrival (t (3)) = t(3)+ toppose);
EndIf
EndWhile
EndIf
Update next light change time (t (4) = Now + Config(3, State));
Identify the next event and the time at which it occurs (Next Event = argmin (t), Now = min (t))
Pseudo-Code: Update System in Line With Next Event and Update Next Event Vector
Note:rand denotes a random number chosen from the uniform distribution on the interval [0, 1], ε denotes a small number, denotes a big number.
If Next Event = New Arrival Then
If New Arrival = Turning Arrival Then
If No Blockage Then
Add a vehicle to tuning lane (T = T + 1);
ElseIf Blockage Then
Add a vehicle to the straight lane and record that it wants to move to the turning lane
(S = S + 1, M track (S)= 1);
EndIf
ElseIf New Arrival = Straight Arrival Then
Add a vehicle to the straight lane and record that it wants to go straight
(S = S + 1, M track (S)= 0);
EndIf
Update next arrival time by generating a random arrival time using the exponential distribution with mean time between arrival lambda (t (1) = Now + λ In (1/ (1 - rand));
ElseIf Next Event = Straight Departure Then
If There is a vehicle(s) in the straight lane Then
If The first vehicle in straight lane wants to depart straight Then
Remove a vehicle from the straight lane (S = S -1,
 );
);
Check if the removal of a vehicle from the straight lane frees up a blockage and allows a turning vehicle(s) to move to the turning lane
(

If The turning lane was previously empty Then
Set next turning departure time to the current time in order to force a check if this is feasible at the next iteration (t (3) = Now);
EndIf
Update next straight departure time by increasing the current departure time by the average departure rate (t (2) = Now + 1/Sdept);
ElseIf The first vehicle in straight lane want to turn Then
Update the next straight departure to be considered after the next turning departure has occurred (t (2) = t(3) + ε);
EndIf
ElseIf There are no vehicles in the straight lane Then
Update the next straight departure to be considered after the next new arrival (t (2) = t(1) + ε);
EndIf
ElseIf Next Event = Turning Departure Then
If There is a vehicle(s) in the turning lane Then
Remove a vehicle from the turning lane (T = T -1);
If Turning lane had previously been full Then
Check if there are vehicles in the straight lane that want to turn, and can now move into the turning lane. If so, move then across (T = T + 1, 1, S = S - 1,
 ), where is the position of the first turning car in the straight lane queue);
EndIf
If Turning light is currently permissive Then
Calculate time until next opposing vehicle arrival
(
 );
);
While t(3) < Now + Time until turning light changes to red
If Time unit next opposing arrival > Minimum time gap to cross Then
Next turning departure can occur before the next opposing vehicle arrives, so update next turning arrival time and exit while loop
(t = (3) = t(3) + 1/Tdept); Exit While
ElseIf Next opposing arrival < Minimum time gap to cross Then
Increase earliest time for next turning departure by the time until the next opposing arrival (t = (3) = t(3) + toppose);
EndIf
EndWhile
ElseIf Turning light is currently green Then
Update next turning departure time by increasing the current departure time by the average departure rate (t = (3) = Now + 1/Tdept);
EndIf
ElseIf There are no vehicles in the turning lane Then
Update the next turning departure to be considered after the next new arrival or next straight departure (t = (3) = min(t = (1), t = (2)) + ε);
EndIf
ElseIf Next Event = Traffic Light Change Then
Record the change in the traffic light state (State = modState-1, N of state) + 1;
If Straight light changes from red to green Then
Set next straight departure time to the current time (t(2) = Now);
ElseIf Straight light changes from green to red Then
Set next straight departure to a large number as no cars can depart straight until after the next light change (t(2) = Large);
EndIf
If Turning light changes to green from permissive or red Then
Set next turning departure time to the current time (t(3) = Now);
ElseIf Turning light changes to red from permissive or green Then
Set next turning departure to a large number as no cars can depart turning until after the next light change (t(3) = Large);
ElseIf Turning light changes to permissive from green or red Then
Initialise next turning departure time to now (t(3) = Now);
Calculate time until next opposing vehicle arrival (
 );
);
While (t(3) < Now + time until turning light changes to red)
If Time unit next opposing arrival > Minimum time gap to cross Then
Next turning departure is can occur before the next opposing vehicle arrives, so update next turning arrival time and exit while loop (t(3) = t(3) + 1/Tdept); Exit While
ElseIf Next opposing arrival < Minimum time gap to cross Then
Increase earliest time for next turning departure by the time until the next opposing arrival (t(3) = t(3) + touppose);
EndIf
EndWhile
EndIf
Update next light change time (t(4) = Now + Config (3 State));
EndIf
CONSENT FOR PUBLICATION
Not applicable.
CONFLICT OF INTEREST
The authors declare no conflict of interest, financial or otherwise.
ACKNOWLEDGEMENTS
Declared none.


