All published articles of this journal are available on ScienceDirect.
Behavior of Extended End-Plate Steel Beam to Column Connections
Abstract
Background:
The main objective of this study is to simulate the behaviour of steel beam-to-column connections using the computer package of Finite Element Analysis (FEA) known as “ABAQUS”.
Objective:
This paper presents the investigations of extended End-Plate connections (EP). A one-model segment is examined under the impact of concentrated load and the exclusive boundary conditions were tested. The analysis of the nonlinear behaviour of the connection is a complicated science and needs to use programs to solve this problem. Experimental works are normally conducted for this type of studies which used more of money, time and effort. Therefore, with the availability of simulation applications, these problems can be addressed.
Results and Conclusion:
The results of the evaluation were compared with the experimental data from the available literature. In this case, nonlinearity materials were used. A sample study on EP connections was carried out using both material and geometric nonlinearities. The comparison of FEA results with corresponding experimental results confirms the correlation and convergence between them.
1. INTRODUCTION
Many manufacturers and erectors prefer to use simple connections to highly strengthen bolts as compared to welding, which requires more time, skilled labour and high cost. Therefore, many steel manufacturers use bolted joints. Steel connections are classified into two types: Fully Restrained (FR) and Partially Restrained (PR). It is assumed that the American Institute of Steel Construction (AISC 2005) connections fled have sufficient rigidity to maintain the angles between the transverse elements and AISC 2005 public relations are assumed to have an insufficient hardness to maintain the angles between the intersecting members. These are called connections with simple framing as a result of ignoring communication restriction. Such connections have the ability to rotate and it has sufficient inelastic. To determine the applicable border situations and establish a procedure for the rational design of connections as one of this study, experimental results from available literature reviews have been used. This study aims to understand the steel joints that are exposed to shear loads or moments using the Finite Element Method (FEM). This study also aims to save rotation characteristics moment parameters corresponding to semi-rigid connections of the semi-rigid beam-to-column connections theoretically using ABAQUS package of finite element software. Researchers presented several studies and investigations related to the design and behaviour of steel connections in order to understand better the behaviour of steel connections between beams to columns under the influence of shear loads and moments. In this study, we used a new section with different characteristics which we never worked on it before. This study was conducted using the bacus program to find the behavior of-of extended end-plate connections. In order to find this program suitable for the real simulation.
Abdala, et al. [1] studied the experimental research project on the behaviour of extended end-plate connections subjected to moment. In this study, the behaviour of six full-scale stiffened and unstiffened cantilever connections was considered. Smooth monotonic moment-rotation relations for the all the tested frames were observed. Sherbourne and Bahaari [2] studied the extended end panel of steel bolted connection properties, using the Ansys program, that verified the proposed computer model by comparing its results with the results obtained from model experiments. Kukreti et al. [3] showed the different results of the extended end-plate tests of several end-plate cases. A method for modelling and analysing end plate beam-to-column connections to obtain the quasistatic behaviour using non-linear dynamic explicit integration presented in paper [4]. Gang et al. [5] declared the results of some tests on bolted extended end-plate connections and analyzed the connections by FEM. The design steps of the end-plate moment connections were discussed. Kishi and Chen [6] extended the collection of the steel connection M–θ data to include results from 300 tests and classify them into six connection types. The authors included several M–θ models, of which the Three-Parameter Power model acquired the most interest. A finite element analysis using software such as Abaqus and Ansys was studied the behavior of extended end-plate moment connections by many researchers [7-10].
According to the AISC / LRFD, the effects of the flexibility of connection must be taken into account within the analysis and design procedures. A beam-column connection is generally subjected to axial force, shear force, bending moment and torque. However, for practical purposes only, the effects of the bending moment are considered, since the torsion can be excluded in the plane of study, and the effects of the axial and cutting forces are usually small in comparison with the effects of the bending moment. Fig. (1) shows the relative rotation of the connection when a moment M is applied. The angle θr corresponds to the relative rotation between the beam and the column. This rotational distortion of the connection affects the stiffness of the porch, causing a redistribution of moments between the column and the beam. Studies have shown that when a moment is applied over a flexible connection, the relationship between this moment and the relative rotation is non-linear.
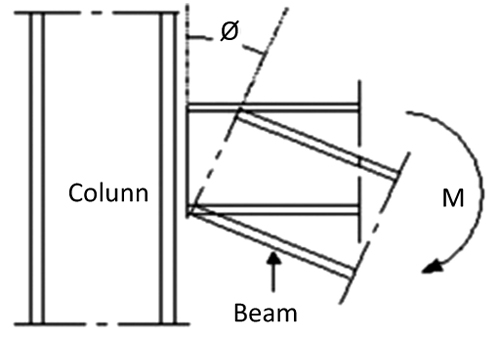
Fig. (2) shows a group of typical moment-rotation curves for different types of connections. Note the difference in non-linear behaviour of pinned, Partially Restricted (PR) and Fully Restricted (FR) connections. The hinged connection has a smaller capacity at the moment. On the contrary, the FR connection presents a great capacity of the moment, whereas the connection PR has a capacity between the capacities of the two types of connections mentioned. In general, the flexibility of connection depends on the geometrical parameters of the elements used in the connection such as the diameter of the bolts used and the dimensions of the connection angles. Semi-rigid connections are normally very ductile if there are no defects during manufacture.
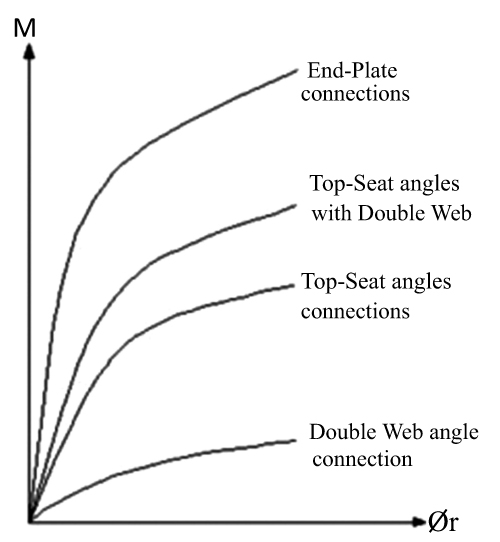
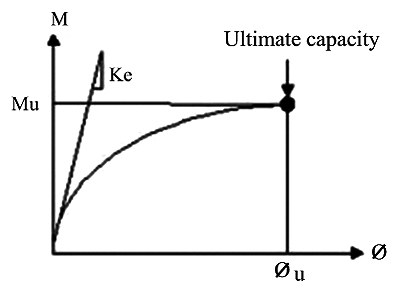
Fig. (3) shows the moment-rotation curves for connections subjected to monotonic (static) loading. As it can be seen in the figure, the main parameters defining the moment-rotation curve are initial stiffness of connection, Ke, ultimate moment carrying capacity, Mu, and corresponding ultimate rotation, Øu. In this study, an attempt is made to evaluate various p forces used to describe the moment-rotation behaviour of EP- connection, which is considered as a partially restrained connection, and modifications are recommended to better predict the capacity of the connection.
Many researchers and those who are interested in the field of steel connections of all types have studied the behaviour of connection beam to the column through laboratory experiments or simulation using computer programs. These studies have been discussed in the researches provided by Hong et al. [11], Abolmaali et al. [12], Xinw et al. [13], and Stelmack et al. [14]. Danesh et al. [15], studied the effect of shear force on initial stiffness of top and seat angle connections with double web angles. Pirmoz et al. [16], studied the moment-rotation behaviour of bolted top–seat angle connections, Elghazouli et al. [17], experimented on monotonic and cyclic behaviour of blind-bolted angle connections, and Drosopoulos et al. [18], studied the three-dimensional (3D) finite element analysis of end- plate steel joints.
2. EXPERIMENTAL SIMULATION PROGRAM
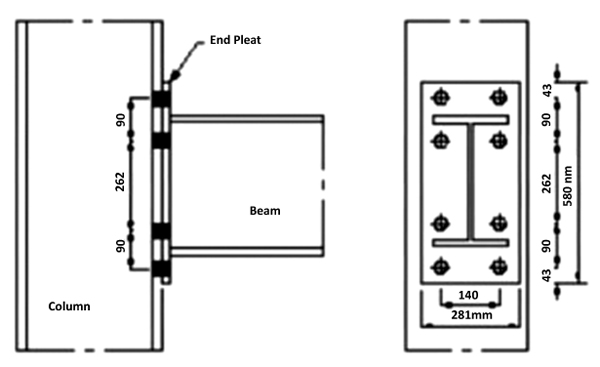
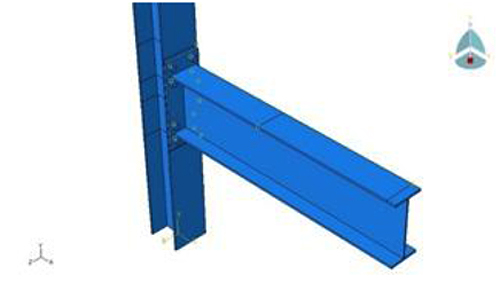
Experimental data that was used for the proposed study were obtained from the studies made by Abdala et al. (2007) for End-Plate connections (EP) [1]. As shown in Fig. (4), the model consists of a typical EP-connection. Comparisons were made with complete test communications characterized by materials and components results (plug components made of IPE-330 steel beams and HEA-220 column and grade-8.8 (20 mm dim)), in order to demonstrate the predictions of communication and to find the degree of convergence between the two results. In this present study, the flexible connection study was conducted by Abdala, et al. (2007) [1]. For EP connection, the connections geometries, material properties, and dimensions details are as indicated in Tables 1 to 3, respectively.
| Test Ref. | Beam Size | Column Size | End-plate Size | Fastener |
|---|---|---|---|---|
| mm*kg/m | mm*kg/m | mm | mm | |
| KGS-6 | IBE-330 | HEA-220 | 528x218x15 | 20 |
3. FINITE ELEMENT MODELING
The ABAQUS software can be used in dynamic structural analyses with temperature changes. This software also can analyse and organize complex structural problems and shapes including three-dimensional structures. The technology used in this program depends on the development of appropriate mesh-arrangement. The selected mesh size must lead to a balance between the need for a fine mesh to give an accurate distribution of tension and a reasonable time for analysis. To obtain this result, a fine mesh must be used in high-pressure areas. Whereas, coarse mesh should be used in the remaining areas. For all connection types, the connection arrangement is symmetrical about a vertical centreline as shown in Fig. (5).
The members used in those models are shown in Tables 1 to 3.
| Test Ref. | d | bf | tw | tf | A | L | F Y |
|---|---|---|---|---|---|---|---|
| mm | mm | mm | mm | mm | mm | MPa | |
| KGS-6 | 213 | 222 | 7 | 10 | 5791 | 1900 | 314 |
3.1. Types of Elements
All component combinations in this investigation were carried out in ABAQUS, which uses a Newton-based method to solve nonlinear FE equations for solid mechanics. The element contains 8 nodes: 8 angular nodes and 8 nodes located in the corner of the element. The construction of hexahedral shape functions and the computation of the stiffness matrix was greatly facilitated by three developments in finite element technology: numerical integration, natural coordinates, and isoparametric mapping. In the finite element model, the three-dimensional (3D) Solid Brick-Element was used, which is available in ABAQUS, as shown in Fig. (6) it comprises of eight nodes, in which each node having three degrees-of-freedom. This element has the capability to model plasticity, has large deflection and strain behavior, and uses reduced integration method.
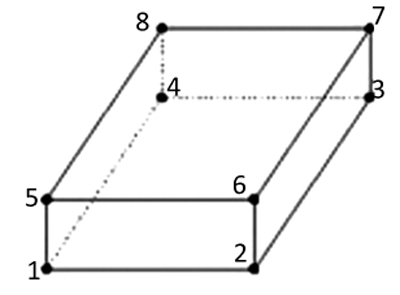
Bolt, beam, column, and end plate-elements were modeled using C3D8 elements for the shank. C3D8 elements are three dimensional solid hexahedral elements comprising eight nodes each with three degrees of freedom x, y and z or 1, 2 and 3, respectively, as shown in Fig. (6).
| Test Ref. | d | bf | tw | tf | A | L | F Y |
|---|---|---|---|---|---|---|---|
| mm | mm | mm | mm | mm | mm | MPa | |
| KGS-6 | 360 | 170 | 8 | 12 | 6768 | 1500 | 314 |
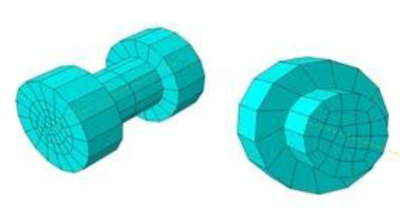
Referring Fig. (7) shows the C3D8 solid elements of 3D iso-parametric solid continuum elements with higher order models are capable of modeling curved boundaries. The elements were numerically integrated, although the C3D8 elements were linear with respect to geometry.
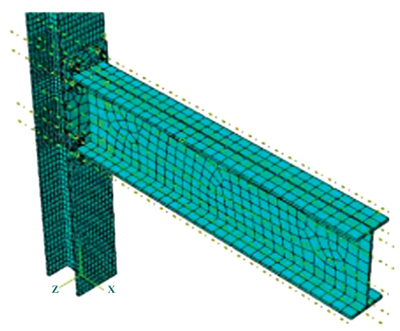
The complete beam model with final arrangement of mesh discretization is shown in Fig. (8).
3.2. Nonlinear Materials Behavior
The characteristics of non-linear materials play an important role in finite element analysis, whereby they must carefully consider each definition of different parts of the connections. In other works, the key elements of connections, such as columns, beams, angles, web-angles, flanges, bolts, and nuts must be simulated the parameters using the appropriate material parameters and models. In this sense, the main dilemma is whether the material simulation represents the actual preparation of the test. Otherwise, through the empirical research that has been discussed in this research, the applied load rate is a specific property, where the loading rate joins the state of load steel. The associated installation takes the minimum creep point and follows almost the exact path of the stress-strain diagram.
Fig. (9) shows the relationship between stress and strain for mild carbon steel. The graph explains the three phases of the mild carbon steel behaviour from the initial loading whit failure.
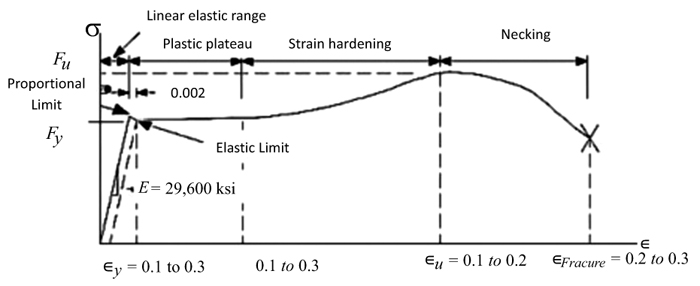
In this study, the experimental material data for all steels were used in the study provided by Abdala, et al. (2007) [1]. The stress/strain curves are based on actual values as compared to theoretical values to be exact.
The plastic, elastic dataset bolts and other members were defined as follow:
- Plat, Column, and Beam.
Modulus of elasticity, E =207 GPa, yield stress of A36 steel; Fy = 248 MPa, and ultimate stress of A36 steel; Fu =483 MPa.
- Nut and Bolt.
Modulus of elasticity, E= 210 GPa, yield stress of A36 steel; Fy= 634 MPa, and ultimate stress of A36 steel; Fu= 827 MPa.
3.3. Boundary Condition
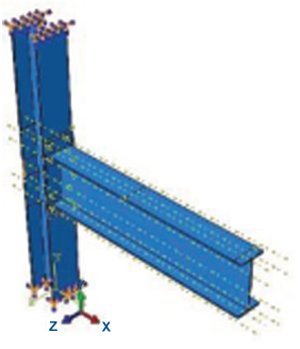
Displacements in the X, Y, Z directions. Fig. (10) shows a beam restrained at the hole’s support at the end of the Column (U1=U2= U3=0). Rotations in the X, Y, Z (UR1=UR2=UR3=0) directions were free along with all surface lines of the model as shown in Fig. (10), respectively.
3.4. Load
The concentrated load was acting at the point located at the top of the long end beam at 1500 mm from the column face to the end free. The load was then loaded into the control file to reach the desired range of moment contact bending. The maximum load factor is set to 100 and the starting load factor step is set to be 1 with the maximum change of load factor in each iteration to be achieved automatically.
4. RESULTS AND DISCUSSION
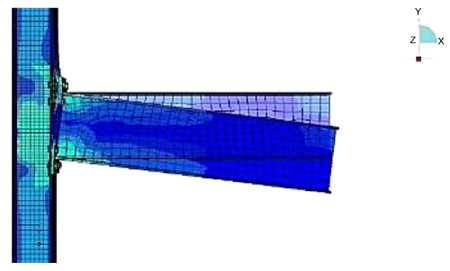
In this section, the results of all plots shown are based on the load factor 1. Figs. (11 and 12) show the deformation shape performed using the scale factor of 1.0 to make the displacement clearly visible.
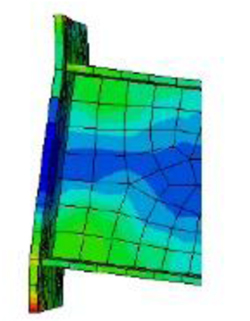
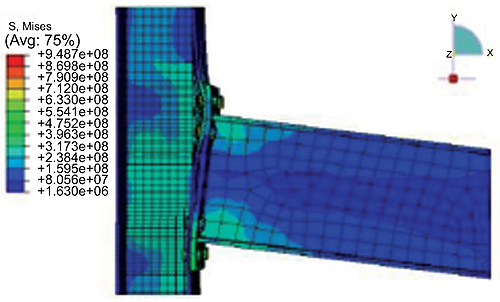
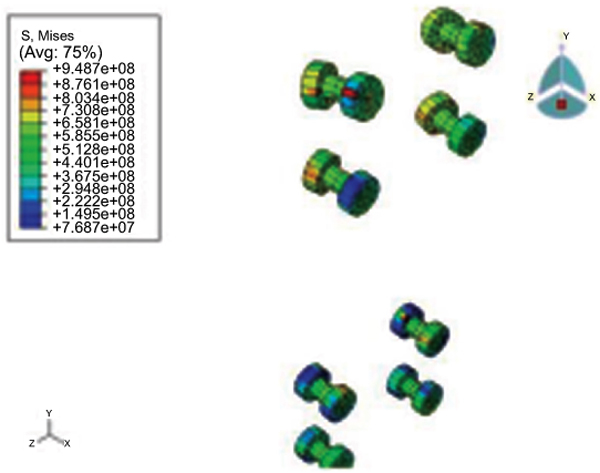
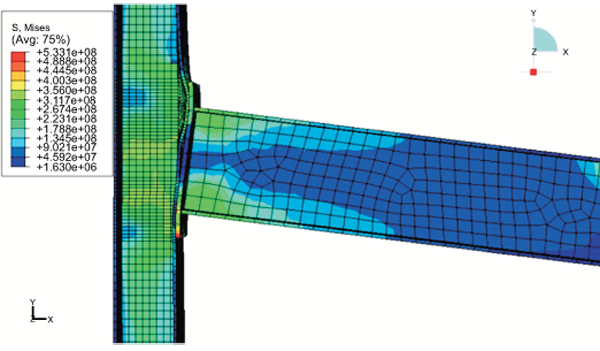
Von-Misses Stress contour plots are shown in Figs. (13 to 15), respectively. Fig. (13) shows stress contours on solid elements such as beam flanges, end-plate, connecting column flanges and bolt head. Fig. (14) shows stress contours on column-web, beam-web, and far-end column flange which were modeled as thick shell elements. The stress contour on solid elements wears off at the bolts as shown in Fig. (15).
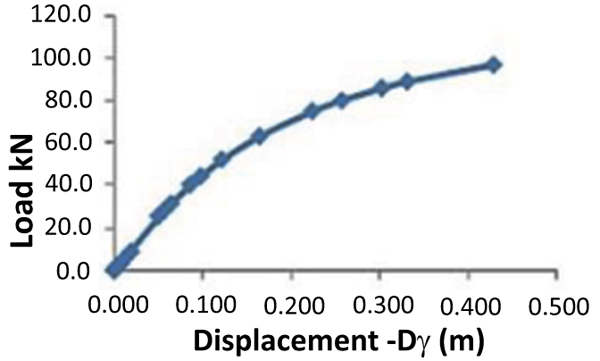
The thick shell element stresses and solid element cannot be in the same plot as they have different degrees of freedom. Fig. (16) shows node 255 and 207 which are selected for displacement analysis. Node 207 is located along with the center line column 250 mm above the intersection between the center line of the beam and column. The node 255 is at the top of the beam at 1500 mm from the face of the column to the end of the free end. Fig. (17) shows the total load factor plot against total vertical displacement for node 255. It also explains how to calculate the beam and column rotation.
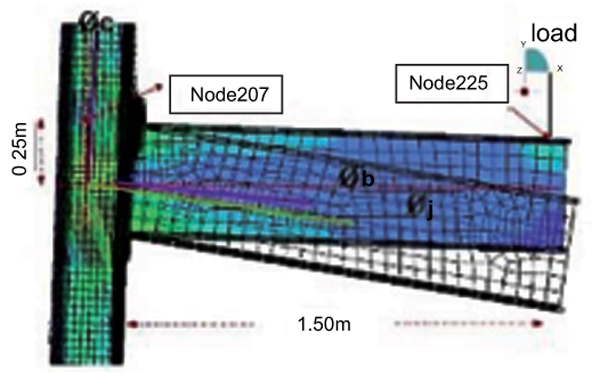
The connection rotates at Øj as shown in Fig. (17).
The connection rotation is defined an Eq. (1) as:
 |
(1) |
Where øb; is beam rotation and øc is column rotation.
The beam rotation øb is calculated using the formula in Eq. (2):
 |
(2) |
Where Dy is the vertical displacement of node 255 and L=1.500 m, where L is the distance of the node from the free end of the beam to the center of rotation. The unit of linear measurements are in millimeter whereas the rotation (Ø) is the radian. ,øc is calculated using the formula in Eq. (3):
 |
(3) |
Where Dx is horizontal displacement of node 207 and h=0.25m, where h is the height of the beam. The applied moment is calculated using the formula below
M = Total load factor × L
Where (M) is the applied moment in kN.m acting L=1.50 m from the column face, where (L) is the length of beam.
The numerical results for the calculated displacements and loads are listed in Table 4.
| Load-Step | Displacement (Dv) (m) | Load (kN) |
|---|---|---|
| 1 | 0.0000000 | 0.000 |
| 2 | 0.0031794 | 1.563 |
| 5 | 0.0062715 | 3.125 |
| 4 | 0.0109062 | 5.469 |
| 5 | 0.0178558 | 8.984 |
| 6 | 0.0500562 | 25.13 |
| 7 | 0.0563573 | 28.10 |
| 8 | 0.0629618 | 31.07 |
| 9 | 0.0851908 | 39.97 |
| 10 | 0.0976357 | 44.42 |
| 11 | 0.1221194 | 52.34 |
| 12 | 0.1651708 | 63.6 |
| 13 | 0.2226322 | 74.87 |
| 14 | 0.2557768 | 80.15 |
| 15 | 0.301993 | 86.09 |
| 16 | 0.3299585 | 89.05 |
| 17 | 0.4272830 | 97.07 |
Table 5 shows the full results of computer analysis, the calculated moment and rotations, Ø.
| Moment kN.m | Dc 10-3 (m) | Øc 10-3 (rad) | Dv 10-3 (m) | Øb 10-3 (rad) | Øi 10-3 (rad) |
|---|---|---|---|---|---|
| 1 | 0.00 | 0.00 | 0.00 | 0.00 | 0.00 |
| 2 | 0.96 | 3.83 | 4.14 | 2.76 | 1.07 |
| 5 | 1.89 | 7.55 | 8.16 | 5.44 | 2.11 |
| 4 | 3.28 | 13.12 | 14.19 | 9.45 | 3.67 |
| 5 | 5.37 | 21.47 | 23.23 | 15.48 | 5.99 |
| 6 | 15.00 | 59.99 | 65.06 | 43.35 | 16.64 |
| 7 | 16.88 | 67.48 | 73.24 | 48.80 | 18.68 |
| 8 | 18.83 | 75.29 | 81.79 | 54.50 | 20.79 |
| 9 | 25.41 | 101.57 | 110.60 | 73.69 | 27.88 |
| 10 | 29.10 | 116.34 | 126.74 | 84.45 | 31.89 |
| 11 | 36.33 | 145.26 | 158.45 | 105.58 | 39.68 |
| 12 | 48.50 | 193.92 | 213.68 | 142.38 | 51.54 |
| 13 | 63.72 | 254.74 | 286.35 | 190.80 | 63.94 |
| 14 | 72.63 | 290.37 | 328.41 | 218.83 | 71.54 |
| 15 | 85.24 | 340.79 | 387.24 | 258.02 | 82.77 |
| 16 | 92.77 | 370.90 | 422.73 | 281.68 | 89.22 |
| 17 | 118.79 | 474.91 | 546.07 | 363.86 | 111.05 |
The experimental data obtained from Abdalla, et al. (2007) is shown in Table 6 below. The graph of the relationship between moment and rotation (M-Ø) for each computer analysis results and experimental results are determined by the intersection of two tangents as shown in Fig. (18).
| Rotation-Ø | Moment-kN.m |
|---|---|
| 0.00 | 0.00 |
| 0.005 | 20 |
| 0.01125 | 40 |
| 0.0175 | 50.7 |
| 0.0215 | 60 |
| 0.0325 | 80 |
| 0.04625 | 91.5 |
| 0.055 | 100 |
| 0.06125 | 102.9 |
| 0.0775 | 114.1 |
| 0.0925 | 120 |
| 0.1137 | 132.45 |
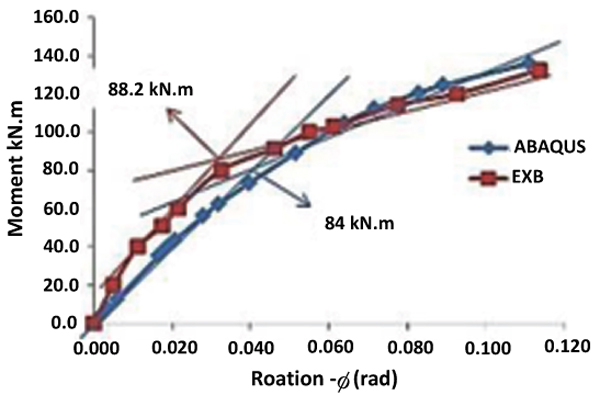
Fig. (18) shows the yield moment of the connection according to the computer analysis, which is 84 kN.m against the experiment, which is 88.2 kN.m with a difference of 5.0%. Equally, the ultimate moment is higher than the experimental result and the yield moment is lower than the experimental result. Moreover, the ultimate moment from the experiment is 132.5 kN.m whereas the computer analysis result was 135.9 kN.m with a difference of 2.5%.
According to the chart (M-Ø) above, from the computer analysis, the displacement is 0.111 m higher than that of the experiment result, which is 0.113 m. On the other hand, it should be noted that the computer model seems to be less stiff than the experimental model at lower loads up to the yield moments. The results of the experimental model show that it is more resistant than the numerical model by a simple margin of only 2.5%. In conclusion, the above analysis could lead to better results when nonlinear materials are used and properly considered. Proper material testing should be carried out to determine the actual stress-strain relationship in order to determine the experimental values of Young’s Modulus, uniaxial yield stress, strain-hardening gradient and plastic strain.
CONCLUSION
In this study, one configuration of beam-column connection experimentally and numerically is tested to study their behavior. Based on the validation results, the following conclusions can be drawn. The findings are based on materials properties and the limited types of materials used in this study. The main conclusions have based on the relationship of pregnancy- displacement. In addition, the relationship of the moment and rotation. 3D finite element analysis model, whereby we can observe that analysis by the ABAQUS program gives that, the bolted connections of the extended end-plate connections can have better behavior with respect to the set of the kinds of connections. Also, analysis by the ABAQUS program gives the results of convergence with experiments and reliable studies. Furthermore, the results of this study are in agreement with former researchers in connection behaviour between pinned connections and fully rigid. Also, possess some rotational stiffness. Moreover, it can have observed that finite element analysis provides advantages in terms of time and cost against a large-scale test. Moreover, the comparative study carried out between the numerical model and the tests showed that the numerical modelling satisfactorily represented the general behavior of rotation at the moment as well as the deformations of the assemblies from beam to the column. Finite element analysis can represent the complete picture of the stress, strain, and force distributions. In general, load-bearing capacity, as well as the rotation capacity of EP connections, is dependent on the thickness of end plat, a strength of bolts, numbers, and diameter of bolts.
CONSENT FOR PUBLICATION
Not applicable.
CONFLICT OF INTEREST
The authors declare no conflict of interest, financial or otherwise.
ACKNOWLEDGEMENTS
The others would like to acknowledge the Ministry of Higher Education in Yemen as well as the Faculty of Civil Engineering & Earth Resources, University Malaysia Pahang, for the financial support in this research.


