All published articles of this journal are available on ScienceDirect.
The Prediction of Buckling Load of Laminated Composite Hat-Stiffened Panels Under Compressive Loading by Using of Neural Networks
Abstract
Background:
Stiffened panels are being used as a lightweight structure in aerospace, marine engineering and retrofitting of building and bridge structure. In this paper, two efficient analytical computational tools, namely, Finite Element Analysis (FEA) and Artificial Neural Network (ANN) are used to analyze and compare the results of the laminated composite 750-hat-stiffened panels.
Objective:
Finite Element (FE) is an efficient and versatile method for the analysis of a complex problem. FE models have been used to generate data set of four different parameters. The four parameters are extensional stiffness ratio of skin in the longitudinal direction to the transverse direction, orthotropy ratio of the panel, the ratio of twisting stiffness to transverse flexural stiffness and smeared extensional stiffness ratio of stiffeners to that of the plate.
Results and Conclusion:
For training of ANN, multilayer feedforward back-propagation has been used as a network function with two-hidden layers in the neural network. The good network architecture is achieved after several iterations to predict the buckling load of the stiffened panel. ANN prediction for unknown new data set is in good agreement with FEA results of different cases, which show that ANN tool can be used for the design of complex structural problems in civil engineering and optimization of the laminated composite stiffened panel.
1. INTRODUCTION
Nowadays, Lightweight structures are being used in various engineering applications. Fiber-Reinforced Polymers (FRP) meet this requirement to a great extent. They are extensively used in defense, aircraft, and automobiles and now they are extensively used in Civil engineering structural applications. FRP stiffened panels are being used as the load shared walls of the compressive member of structures. Composite panels are also used in multi-story building to reduce the dead load of the structure. FRP laminated panels are currently used in heritage building for retrofitting due to their high strength and aesthetic appearance. The design of laminated composite panel should be such that it can achieve better performance with specific strengths. Buckling load capacity of the stiffened structure with the variation in different parameters can be studied separately using the analytical method, Finite Element Method (FEM) and experimental study.
| Terminology | Description |
|---|---|
| A11, A12,A22, A66 | Extensional stiffness component of skin |
| D11, D12,D22, D66 | Bending stiffness component of skin |
| p | Pitch length (center to center spacing of stiffeners) |
| D1/D2 | Panel orthotropy ratio |
Bakis et al. [1] presented detailed studies on buckling of laminated structures and its application in civil engineering. Ni et al. [2] presented a review of recent research based on two aspects application of FEM and experimental work with different loading conditions. Guo et al. [3] presented parametric studies of stiffened panels that were presented for skin thickness to length ratios, ply configuration, stiffener depth to skin thickness ratios and panel aspect ratios. Stroud and Anderson [4] studied numerical formulation to find the buckling load of blade type, hat-stiffeners, and corrugated stiffened panel. Smeared stiffeners technique is used to analyze the laminated composite panel subjected to the various type of in-plane loading with different type of stiffener [5, 6].
Kong et al. [7] studied the panels analytically and experimentally to show the influence of ply orientation and stiffener shaped on buckling strength and failure load of the stiffened panels. Zimmermann et al. [8] conducted an experimental study on the buckling behavior of stiffened panels with different skin thickness and variation of I-shaped stiffeners. Pevzner et al. [9] proposed an extended effective width method to study the torsion, bending and buckling of curved stiffened panels with T-shaped and J-shaped stiffeners. Experimental study of buckling behavior and failure mode of the composite panel with different shapes of stiffeners under compression were conducted by different researchers [10-12]. Borrelli et al. [13] investigated kinematic coupling approaches for FE simulation of the buckling behavior of laminated stiffened structures. Wang et al. [14] presented experimental strain analysis to find the buckling load, and the ultimate carrying capacity of two panels with four equally spaced I-shape stiffeners. Parametrical studies were performed to assess the influence of skin thickness, stiffener spacing and stiffener depth on the buckling strength of grid panels using different FE based software [15-17]. Reliability assessment of the post-buckling compressive strength of different laminated composite structures under axial compression was studied with the application of progressive failure analysis methodology [18-20].
A review work of thoughtfulness showed various philosophies of ANN prediction in the area of laminated composite property, design and optimization [21]. Kadi [22] presented a review on pattern estimation of the mechanical behavior of fiber-reinforced combined materials with the help of ANN tool. Rogers [23] developed a guideline for designing and training an ANN to simulate the structural analysis program. Mallela and Upadhyay [24] used a computational tool (ANN) for predicting the buckling load of the panel subjected to in-plane shear loading. The results of ANN were compared with FEM results of stiffened panels [25]. Alqedra and Ashour [26] performed ANN to study the significant parameters on the concrete shear capacity of anchor bolts. Few researchers have used ANNs for predictions of the behavior of laminated composite materials [27].
Many researchers conducted parametrical studies of buckling of the laminated composite panel with blade type, I-shaped and T-shaped stiffeners due to various types of in-plane loading, but the parametrical studies of buckling response of laminated composite panel with hat-stiffeners under compressive loading have found less consideration. The present paper deals with the optimization of laminated composite hat-stiffened panels under in-plane compressive loading by using ANNs with FEA generated data set. The ANNs have been trained by using a generated database of FE models. The trained network has been tested to predict the buckling load of stiffened panels. Optimum neural network architecture has been established and tested with unknown data set.
2. FE ANALYSIS AND VALIDATION STUDIES OF LAMINATED COMPOSITE PANELS
FE analysis has been performed for the hat-stiffened panel under compressive loading by using ABAQUS software. The laminated composite hat-stiffened panel has been modeled carefully to define the material properties of skin and stiffeners, number of layers, thickness and fiber orientations of the skin. Shell element (S4R) has been taken for FE analysis of panel in ABAQUS [36], which possesses both bending and membrane capabilities. Uniformly distributed edge compression load of 1 kN/m has been applied to the panel in stiffeners direction. The model has been submitted for eigenvalue buckling analysis with application of simply supported boundary conditions on the panel. The buckling load has been obtained by multiplying the edge compressive load and the eigenvalue obtained from the FE analysis.
2.1. Validation Studies
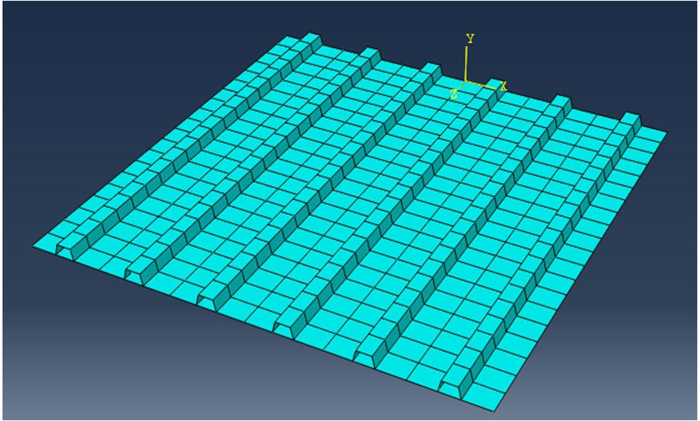
The model of the hat-stiffened panel has been validated with results reported by Stroud et al. [5] which were obtained through the Engineering Analysis Language (EAL) on hat-stiffened panel of dimension 762 mm x 762 mm with six hat stiffeners. In the present studies, 38.1 mm global size of the element has been taken for the analysis of stiffened panel and the eigenvalue from the present studies is in good agreement with EAL results of hat-stiffened panel as reported by Stroud et al. [5]. The hat-stiffened panel has been discretized with shell element (S4R) and 820 elements are generated of the panel as shown in Fig. (1). The results from the present study have been found to be in good agreement with EAL results reported by Stroud et al. [5] for a panel under compression and combination of compression-shear as the results are tabulated in Table 1. It has been found that the buckling mode shapes obtained are symmetrical for compression and combination of compression-shear, which is in good agreement with buckling mode discussed by Stroud et al. [5].
| Applied Load (kN/m) |
FE Analysis (eigen value) | % Difference  *100 *100 |
FE Analysis Mode Shape | |||
|---|---|---|---|---|---|---|
| Stroud et al. [5] (a) |
Present study (b) |
Stroud et al. [5] | Present study | |||
| NX NXY | ||||||
175.1
|
0 | 3.0042 | 3.0158 | 0.38 | Symmetric | Symmetric |
| 175.1 | 175.1 | 2.3268 | 2.2386 | -3.79 | Symmetric | Symmetric |
2.2. Numerical Studies of Panel
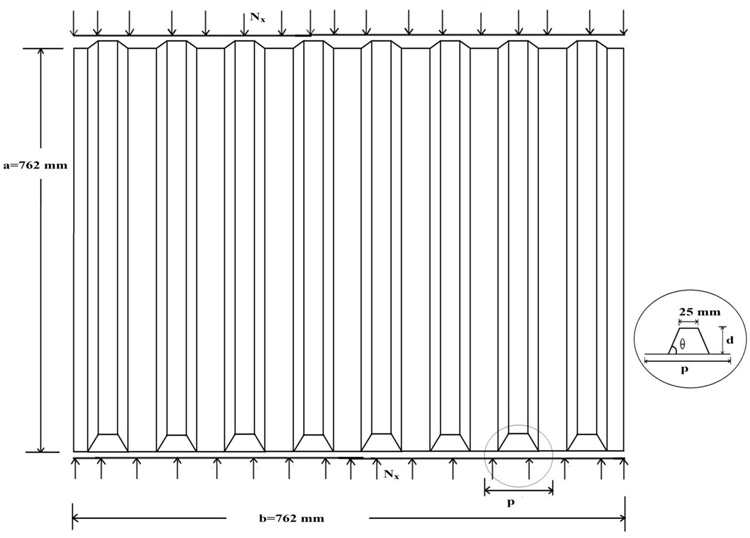
Numerical studies have been carried out by analyzing 750-hat-stiffened panel of dimension 762 mm x 762 mm as shown in Fig. (2) with a variation of pitch length (84.67 mm to 381 mm) and depth (25 mm to 55 mm) of the stiffener with a fixed top width of 25 mm. The Carbon Fiber Composite (CFC) material property of each ply of thickness 0.125 mm is given in Table 2. Three types of plies configuration of skin are used for plate element and stiffener component of the panel, which is illustrated in Table 3. A program was developed on the basis of smeared stiffness approach by using formulae given below for different pre-decided orthotropy ratio with a variation of pitch length of stiffener for finding the corresponding hat-stiffener depth by trial and error for three different skin considered separately. The obtained depth of stiffener has been used for FE modeling of the panel. The buckling analysis has been done on the stiffened panel subjected to uniformly distributed edge compressive load with simply supported boundary condition on all edges.
| Quantity | Symbol | Units | CFC materials |
|---|---|---|---|
|
Young’s modulus 00 |
E11 |
GPa |
164 |
| Young’s modulus 900 |
E22 |
GPa |
12.8 |
| Shear modulus in plane 12 and 13 |
G12= G13 | GPa |
4.5 |
| Shear modulus in plane 23 | G23 | GPa |
2.5 |
| Poisson ratio in plane 12 |
υ12 |
- |
0.32 |
| Ultimate tensile strength 00 | X1t |
MPa |
2724 |
| Ultimate compressive strength 00 | X1c | MPa | 111 |
| Ultimate tensile strength 900 | X2t |
MPa | 50 |
| Ultimate compressive strength 900 |
X2c |
MPa | 1690 |
| Ultimate shear strength in plane 12 |
S12 | MPa | 120 |
| Ultimate shear strength in plane 13 | S13 |
MPa | 137 |
|
Ultimate shear strength in plane 23 |
S23 | MPa |
60 |
| Density | ρ | Kg/m3 | 1800 |
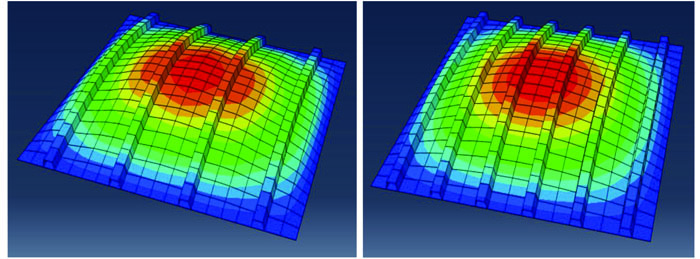
Parameters have been identified by generated data, which influence the buckling load of the stiffened panel. The parameters A11/A22 are extensional stiffness ratio of the skin in the longitudinal direction to the transverse direction, D1/D2 gives the global flexural properties of the panel, D3/D2 gives the idea of the torsional rigidity of panel and (EA)S/(EA)P gives the knowledge about the material strength of stiffener to that plate. For a given skin of the panel, the ratios D1/D2 and (EA)S/(EA)P of the stiffened panel increase only by increasing pitch length and depth of stiffener. Local buckling of the panel is increased with increasing the depth of stiffener. Less depth of hat-stiffener of the panel is required to be used to reduce the local bucking of the stiffened panel. Fig. (3a and 3b) shows the global buckling mode of the 750-hat-stiffened panel under compressive loading for different pitch length and D1/D2. Stroud and Anderson [4] gave the formulae for input parameters using ANN as listed below.
Flexural stiffness of the panel (D1) in the direction of the stiffener (Eq. 1)
 |
(1) |
Flexural stiffness of panel (D2) in the direction transverse to stiffener (Eq. 2)
 |
(2) |
The smeared extensional stiffness of element per pitch (Eq. 3)
 |
(3) |
 = smeared extensional stiffness ratio of the stiffener to that plate per pitch
Twisting stiffness of panel (D3) per pitch (Eq. 4)
 |
(4) |
For open-section panels is given by (Eq. 5)
 |
(5) |
For closed-section panels is given by (Eq. 6)
 |
(6) |
Where i = type of element of the panel (plate or stiffener)
bi = width of the element
p = pitch length of the panel
Zi = distance from the neutral axis of the cross-section to the centroid of the element.
ϴ = inclination of the element with the horizontal direction.
Ā = area enclosed by closed-section in one period.
3. PREDICTION OF BUCKLING LOAD BY ANN
The neural network is a computational technique, which was inspired by the working pattern of human biological brains [28, 29]. The neural network is a combination of an input layer, hidden layer and output layer. Further hidden layer can be more than one layer, which is problem-specific. All three layers are connected with different nodes and node connection with specific weight and a bias value. There are different types of networks available for prediction, but the problem defines which network is more suitable for best output. Multilayer feedforward networks are universally accepted and result in the desired accuracy with a specific sense [30, 31]. For prediction of Civil engineering problems, the most widely used network is feed-forward backpropagation. The present work is divided into four steps as follows:
- Selection of training and testing data from the main datasheet.
- Deciding the network type and another required parameter.
- Training the network and simulation.
- Evaluation of the performance of ANN network.
3.1. Selection of Training and Testing Data from the Main Data-sheet
102 number of FE model of simulated data-set has been divided into two parts: training data set and test data set. The data have considered the combination of 75% data for training purpose and 25% data for testing purpose. Four different input variables A11/A22, D1/D2, D3/D2 and (EA)S/(EA)P have been taken, which influence the buckling problem of the hat-stiffened panel under compressive loading and buckling load per unit Area is taken as output for preparation of networks. The parameter A11/A22 is varied as 0.59 (for skin-3) and 1.68 (for skin-1) as shown in Table 3. D1/D2 is taken in the range 100-500 with a variation of depth of 750-hat-stiffener for pitch length of 84.67 to 381 mm. D3/D2 varied in the range of 7.4 - 68.1 for variation of the shaped of hat-stiffener. The parameter (EA)S /(EA)P varied as 0.14 to 1.01 with a variation of depth of stiffener for different skins.
| Panel component ( plate and stiffener of same skin) |
Plies configuration | Each ply thickness (mm) |
A11/A22 | D11/D22 |
|---|---|---|---|---|
| Skin – 1 | [[300/-300/900/00]s]s | 0.125 | 1.68 | 1.81 |
| Skin – 2 |
[[450/-450/900/00]s]s | 0.125 | 1.00 | 0.95 |
| Skin – 3 | [[600/-600/900/00]s]s | 0.125 | 0.59 | 0.49 |
3.2. Deciding the Network Type and Another Required Parameter
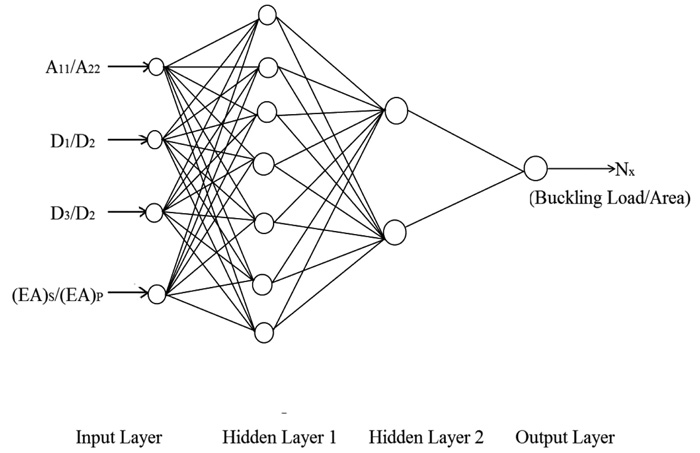
Development of perfect network with a proper combination of the input layer, hidden layer and the output layer is necessary for good prediction of results. The input node is the combination of four different parameters A11/A22, D1/D2, D3/D2 and (EA)S /(EA)P to obtain the desired output. Once after deciding the input and output parameter, the next step is to find the architecture of hidden layers. For finding the best suitable hidden layer, different types of combination of layers have been taken as shown in Table 4. Results from one hidden layer were given the desired output with different weight value connection for continuous function but the selection of the second layer for the discontinuous function [32]. The hidden layer can be one or more than one, but there is no fixed theory for the selection of hidden layers. Some cases in the hidden layer selection were based on the quality and quantity of the training data [33]. Some situation in the multi-hidden layer was given better result over the single hidden layer [34-36]. The hidden layer should contain a total number of neurons equal to the one greater than twice the number of input parameters [33]. It is not easy to select any fixed pattern for a selection of hidden layer; normally, it is based on the trial and error method. Table 4 shows a reflection of the different types of hidden layer combination and plot R square after testing and validation with the help of observed and actual data. Network performance has been considered on the basis of a mean square error at the time of training and testing, where mean square error is found to be 0.0140 and 0.8091 at the time of training and testing, respectively for the best network. Finally, a neural network architecture 4-7-2-1 has been obtained as shown in Fig. (4), which gives the desired output for the prediction of buckling load per unit area of the hat-stiffened panel.
| Input Nodes | Hidden Nodes | Output Nodes | R2 | |
|---|---|---|---|---|
| 1st Layer | 2nd Layer | |||
| 4 | 5 | 0 | 1 | 0.8896 |
| 4 | 13 | 0 | 1 | 0.9167 |
| 4 | 15 | 0 | 1 | 0.9181 |
| 4 | 9 | 0 | 1 | 0.9334 |
| 4 | 7 | 3 | 1 | 0.9451 |
| 4 | 8 | 4 | 1 | 0.9574 |
| 4 | 5 | 4 | 1 | 0.9590 |
| 4 | 6 | 3 | 1 | 0.9692 |
| 4 | 11 | 0 | 1 | 0.9848 |
| 4 | 6 | 0 | 1 | 0.9848 |
| 4 | 4 | 3 | 1 | 0.9850 |
| 4 | 10 | 0 | 1 | 0.9871 |
| 4 | 8 | 0 | 1 | 0.9883 |
| 4 | 7 | 4 | 1 | 0.9896 |
| 4 | 8 | 2 | 1 | 0.9898 |
| 4 | 7 | 0 | 1 | 0.9905 |
| 4 | 8 | 3 | 1 | 0.9952 |
| 4 | 7 | 2 | 1 | 0.9983 |
3.3. Training the Network and Simulation
It is observed that ANN is the best tool for predicting the buckling load per unit area based on good training and testing data. A neural network architecture 4-7-2-1 has been selected which is best suitable for this problem. Fig. (5) shows the process of multilayer feedforward back-propagation as a network function in this work. There have some working steps of this network as follows:
- Feed forward in training pattern.
- Comparison and calculation of error.
- If the result is good, then draw output; otherwise, back propagation starts and weights are adjusted.
- Back-propagation works in a loop till the desired output is not received.
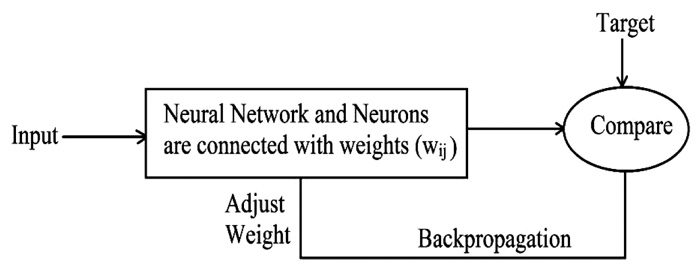
There is a very high range of training function available in Matlab where TrainLM is used for training function which has given better results. Also, LearnGDM has been used for adaptive learning function. Two hidden layers have been used for the network creation. The tan-sigmoid transfer function has been used for the hidden layer, where the range of tan-sigmoid is -1 to 1. The pure linear transfer function has been used for the plot, the output result, and this combination gives a better result.
R-squared is a statistical measurement of data, which checks the data closeness to the best-fitted regression line. R-squared is also known as the coefficient of determination. R-squared value varies from 0 to 100 percent, where ‘0’ percent shows worst fit to the regression line and 100 percent shows best fit to the regression line.
Suitable network was found after many iterations of training of the network for satisfactory prediction of the buckling load. R-squared value has been estimated for every network and the best network was found for the prediction of buckling load per unit area of the panel. Also, a continuous checking of the performance based on mean square error has been calculated for training and testing. Continuously training and testing work was done until the best-trained network was not found. After the selection of the best network, the next step is to note the weight value and bais value of that network for future prediction.
3.4. Evaluate the Performance of ANN Network
The performance of the neural network has been verified using new data set and the result of the new data set reflects the accuracy of the trained network. The best prediction of results has been obtained for the new data from the selected neural network model. Finally, the error between the actual data and predicted output data has been found which shows good performance of the neural network.
4. RESULTS AND DISCUSSION
In this paper, the multilayer feedforward back-propagation process has been used as a network function with neural network architecture 4-7-2-1 as shown in Fig (4). The neural network has been trained to get suitable value of the buckling load per unit area of the panel. Weight value matrix (W1), which is connected to four input nodes to seven 1st hidden layer nodes is obtained as:
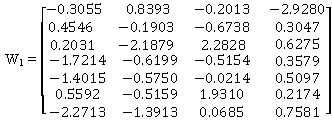
Weight value matrix (W2), which is connected to seven 1st hidden layer nodes to two 2nd hidden layer nodes:

Weight value matrix (W3), which is connected to two nodes of 2nd hidden layers to one node of output layer:

Bais for different hidden layers are given below:
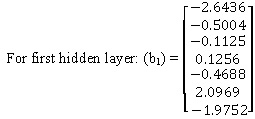

For output layer: (b3) = [-0.6399]
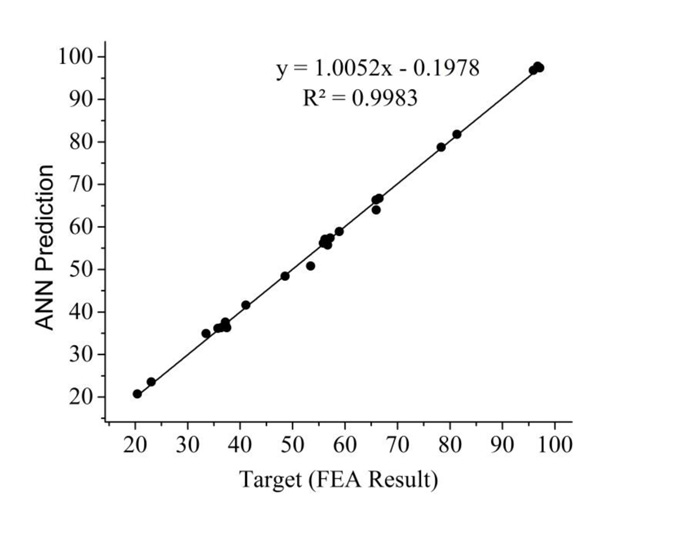
Fig. (6) shows the linear regression graph between the target of FEM result and ANN prediction. The regression line is obtained as Y = Slope *X + Intercept, where the slope is 1.0052 and the intercept is -0.1978. The standard error of slope and intercept are 0.00881and 0.52658, respectively. R-Square value is 0.9983, which is nearer to 1:1 line. This result shows that the regression line is a very good fit.
For different D1/D2 and skin, a variation of buckling load per unit area of the panels with (EA)S/(EA)P is shown in Fig. (7a and 7b), which is obtained by FEA and ANN. It is observed that with the increase in (EA)S/(EA)P, buckling load per unit area increases up to certain values of (EA)S/(EA)P for all D1/D2 in a different skin; after that, the buckling load per unit area is approximately constant. The minimum value of (EA)S/(EA)P is obtained for all D1/D2 of the different skins from Fig. (7a and 7b) at which the hat-stiffened panel has the maximum buckling load per unit area. Therefore, this minimum value is defined as optimum (EA)S/(EA)P of the hat-stiffened panel and hence the number of the stiffener and depth of the hat-stiffened panel are increased to a certain limit for efficient bucking performance of the panel without unnecessary increase in the weight of panel and the local buckling. The pitch length and depth of the hat-stiffener of the efficient bucking performance of the panel can be found on the basis of obtained optimum (EA)S/(EA)P of the hat-stiffened panel for different orthotropy ratio D1/D2. It is observed that the curve obtained from ANN results is similar to the pattern obtained by FEA. It is also observed that ANN prediction curve for D1/D2 = 150 and 250 is in-between the FEA curve for D1/D2 = 100 to 200 and D1/D2 = 200 to 300 respectively.
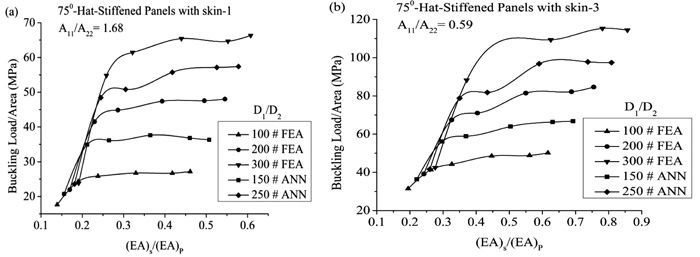
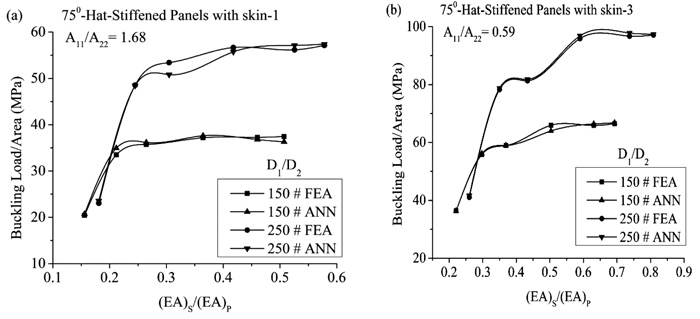
Fig. (8a and 8b) shows the comparison of the FEA results with ANN predicted results with a variation of (EA)S/(EA)P for skin-1 and skin-3. It is observed that the results obtained from ANN are similar to the results of FEA data and sometimes it overlaps with each other for D1/D2 = 150 and 250 with both skin-1 and skin-2. Also, Table 5 shows the comparison the FEA results with ANN predicted of new data with percentage difference. The maximum and minimum percentage difference of ANN predicted with FEA results is found in about 2.193% and 0.064%, respectively.
In the above discussion, it has been found that prediction of the buckling load of the stiffened panel by ANN is in good agreement with FEA results for different cases. Therefore, ANN is a good analytical computation tool for prediction of buckling capacity of the simply supported hat-stiffened panel under compressive loading. Hence, ANN the tool can be used to design complex problems of structural application in civil engineering and optimization of laminated composite structural.
| A11/ A22 | D1/ D2 | D3/ D2 |

|
Buckling Load/Area (MPa) | % Difference
|
|
|---|---|---|---|---|---|---|
| FEA results (x) |
ANN results (y) |
|||||
| 1.68 0.59 |
150 250 150 250 |
10.02 13.84 14.76 21.01 12.80 21.03 18.94 31.89 |
0.16 0.36 0.18 0.42 0.22 0.63 0.26 0.74 |
20.403 37.190 23.050 56.655 36.360 65.875 41.079 96.720 |
20.73 37.626 23.556 55.749 36.337 66.364 41.619 97.810 |
1.602 1.173 2.193 -1.599 -0.064 0.743 1.315 1.126 |
CONCLUSION
Buckling of the laminated composite 750-hat-stiffened panels has been analyzed by the artificial neural network with FEA generated data. Numerical studies are carried out with a variation of four different parameters A11/A22, D1/D2, D3/D2 and (EA)S /(EA)P with 750-hat-stiffeners. From the above results and discussion, it is observed that ANN can be used efficiently for predicting the buckling load with different types of loading condition for better design of the stiffened panel. The following conclusions are drawn:
- The well trained Neural network gives the best result with the help of network architecture 4-7-2-1.
- The optimum (EA)S/(EA)P increases with the decreasing A11/A22 of the skin for all D1/D2.
- The optimum (EA)S/(EA)P increases with the increasing D1/D2 for the same skin.
- For better design of the hat-stiffened panel, the pitch length and depth of the hat-stiffener can be obtained with the help of optimum (EA)S/(EA)P of different orthotropy ratio D1/D2.
- The maximum and minimum percentage difference of ANN predicted and FEA results are obtained 2.193% and 0.064% respectively.
CONSENT FOR PUBLICATION
Not applicable.
CONFLICT OF INTEREST
The authors declare no conflict of interest, financial or otherwise.
ACKNOWLEDGEMENTS
Declared none.


