All published articles of this journal are available on ScienceDirect.
Hydrological Modeling of Green Roofs Runoff by Nash Cascade Model
Abstract
Background:
Green roofs (GRs) technology has gained increasing interest in recent years since it offers multiple benefits to urban environments, citizens and buildings. Eco-covers can capture some water nutrient pollutants, filter air pollutants and moderate the urban heat island effect. Beyond these benefits, abundant literature stresses the role played by the GRs from the hydrological perspective. They allow to face the increasing stress on the traditional urban drainage systems by reducing the annual stormwater runoff. In light of this, the hydrological behavior prediction of a vegetated cover is essential for urban planners, policy makers and engineers in order to quantify runoff mitigation potential so as to optimize their application.
Objective:
The aim of the present research is to meet this need by testing the accuracy of Nash cascade model in predicting the stormwater production of GR systems.
Materials and Methods:
The proposed model has been calibrated against hourly data of thirteen rainfall-runoff events observed at two experimental sites, both located within the campus of the University of Salerno, southern Italy. Event scale model calibration, aimed at the identification of the storage coefficient parameter, has been based on the optimization of a number of error statistics.
Results and Conclusion:
Despite its simplicity, the investigated model appears adequately to be able to predict the runoff production from the experimental green roofs with a good degree of accuracy, as described by the Nash-Sutcliffe Efficiency index, which ranges between 0.54 and 0.94.
1. INTRODUCTION
In the last decades, there has been a widespread implementation of green roofs worldwide since they provide many benefits at economic, ecological and societal levels. Green roofs can potentially mitigate the urban heat island, reduce noise and air pollution, encourage biodiversity in the city by providing habitat for wildlife, save energy and lend a more aesthetically pleasing appearance to the buildings [1, 2]. From the hydrological perspective, GRs retain, treat and reduce stormwater, contributing to stormwater management in urban environments. This aspect is particularly relevant as the increasing urbanization of residential areas has resulted in less green space and more impervious surface. This has caused thereduction of infiltration rates with an increase in surface runoff and more frequent flash floods in densely built cities [3-5]. The potential of green roofs to manage urban stormwater is linked to the ability of this technology to store stormwater within the vegetation and support layers, at extremely variable extent, 40 to 90% of total precipitation depending on the soil media depth, roof configuration and climate conditions [6-9]. As a result of the storage capacity, the GRs can reduce the stormwater peak flow and additionally delay the outflow. In light of these potential benefits, modeling the hydrological behavior of vegetated covers appears a crucial issue for urban planners, policymakers and developers so as to quantify the retention and detention effects of the green infrastructures before retrofitting existing buildings or planning new settlements. Consequently, the strategic planning and application of eco-covers require the implementation of an accurate model able to correctly reproduce the hydrological response of this technology.
In order to predict the hydrological performances of a green roof, in time many authors have proposed different models with different level of complexity in the integrated processes description. Among others, the Stormwater Management Model (SWMM), a dynamic hydrology-hydraulic simulation model used for a single event or long-term simulations of runoff quantity and quality from urban areas, has appeared to be particularly effective for this purpose and attractive for practical applications [10-12]. Additionally, frequently used models include HYDRUS-1D [13], a finite element model which numerically solves the Richards' equation for saturated-unsaturated water flow and the Soil Water Atmosphere and Plant (SWAP) model [14] which simulates transport of water, solutes and heat in unsaturated/saturated soils. More complex models are SWMS_2D [15] for water movement in two-dimensional variably saturated media and storage-routing models [16, 17] and Long-Term Hydrologic Impact Assessment-Low Impact Development 2.1 or simply L-THIA-LID 2.1 [18]. Despite these methods produce very accurate results, they require intensive computational efforts, data availability and technical expertise. Parsimonious hydrological models that run on a base of little input information and few parameters are of much interest for urban landscape planner intended to explore the impact of green technologies in a particular environment. From this perspective, methods for simulating the hydrologic and hydraulic behaviors of green roofs assuming they can act as simple reservoir could be advisable [19, 20]. The storage cascade models among many other hydrologic approaches are among the simplest but practical methods, which only require basic meteorological input data readily derived by publicly and widely available databases. Although typically used to predict the hydrological behavior of natural river basins, they have proved to reproduce the performances of green roof systems with good accuracy [21-23]. The Nash cascade model can be listed within this group [24]. It further represents a simplification of storage models as its peculiarity is represented by the fact that the storage delay parameter is considered the same for each reservoir of the cascade. The literature and application in this field appear to be limited but promising, thus, the research in this area is still challenging and practical and scientific interest and continuation in this direction are encouraged [25, 26].
Within this framework, the present research is aimed to test the ability and accuracy of the Nash cascade model in modeling the GR hydrological response. To the purpose, data from an experimental site located at the University of Salerno, Southern Italy, have been used. It includes two GR test-beds, differing for the composition of the drainage layer, made up of expanded clay in one case and of commercial plastic trays filled with expanded clay on the other case. Thirteen rainfall-runoff events, recorded from July 2017 to November 2018, have been selected and hourly data used for the modeling process. Being the climate, a typical Mediterranean one, a wide range of rainfall type has been accounted for, covering a wide range of precipitation properties. The applied Nash cascade model is described by two reservoirs, featured by a storage parameter k, subject to calibration, since it cannot be directly and easily assessed from field data. The input to the Nash model is provided by a GR retention model illustrated in a previous study [27]. The goodness-of-fit is evaluated by using different error statistics, such as the Nash-Sutcliffe efficiency (NSE) index, the root mean square error (RMSE), the mean absolute error (MAE) and the volume error (VE).
The presented results would help to understand the role of building practices and climate properties on the GR hydrological behavior.
2. MATERIALS AND METHODS
2.1. Site Description and Events Selection
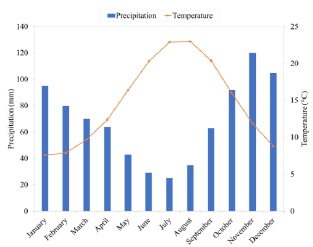
The experimental site is located in Fisciano, within the campus of the University of Salerno (40° 46’ 14” N, 14° 47’ 22”E, 282 ma.s.l.), Southern Italy. Fisciano is characterized by a Mediterranean climate with hot and dry summers and mild wet winters. The mean annual temperature is of 14.8 °C while the mean annual precipitation of about 821 mm [28]. Fig. (1) illustrates the site climate characterization, with the temporal patterns of the monthly average precipitation and air temperature.
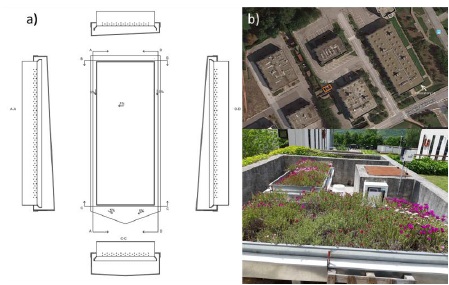
The site includes two test benches placed on steel backing with an area of 2.5 m2 (1 x 2.5 m) and a pitch slope of 1%. In Fig. (2) some details about plans and sections of the benches are provided.
During rainfall events, water flowing from holes placed 1 cm above the bottom of the roofs, is routed to a tank placed below the benches. The weight of the tank is measured by a digital scale which stores information in a database with a 5-minutes time step. The extensive green roofs design includes three layers: the vegetation layer with succulent plants, a growing substrate medium made up of vegetal fibers, organic matter and inert materials, a filter fleece, interposed between the substrate and the drainage layer, and a drainage layer. Different drainage layer technologies make distinction between the two test beds. Indeed, the drainage layer of GR1 consists of traditional expanded clay, while GR2 is provided with a commercial modular plastic trays filled with expanded clay. The main roofs’ characteristics are listed in Table 1.
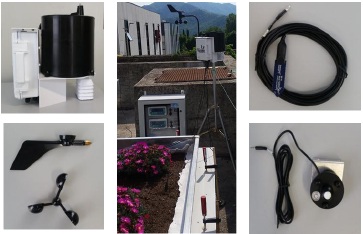
The experimental platform is equipped with a complete meteorological station (Fig. 3). The weather station includes hygrometer, anemometer, wind vane, pyranometer, rain gauge and allows to measure temperature, atmospheric pressure, humidity, wind speed, wind direction, precipitation amounts. Additionally, four soil moisture capacitance sensors, two for each bench, are connected to the meteorological station to record substrate soil water content. The meteorological and runoff data collection started in 2017. Additional details of the experimental roof and the measurement facilities are given in a study [29].
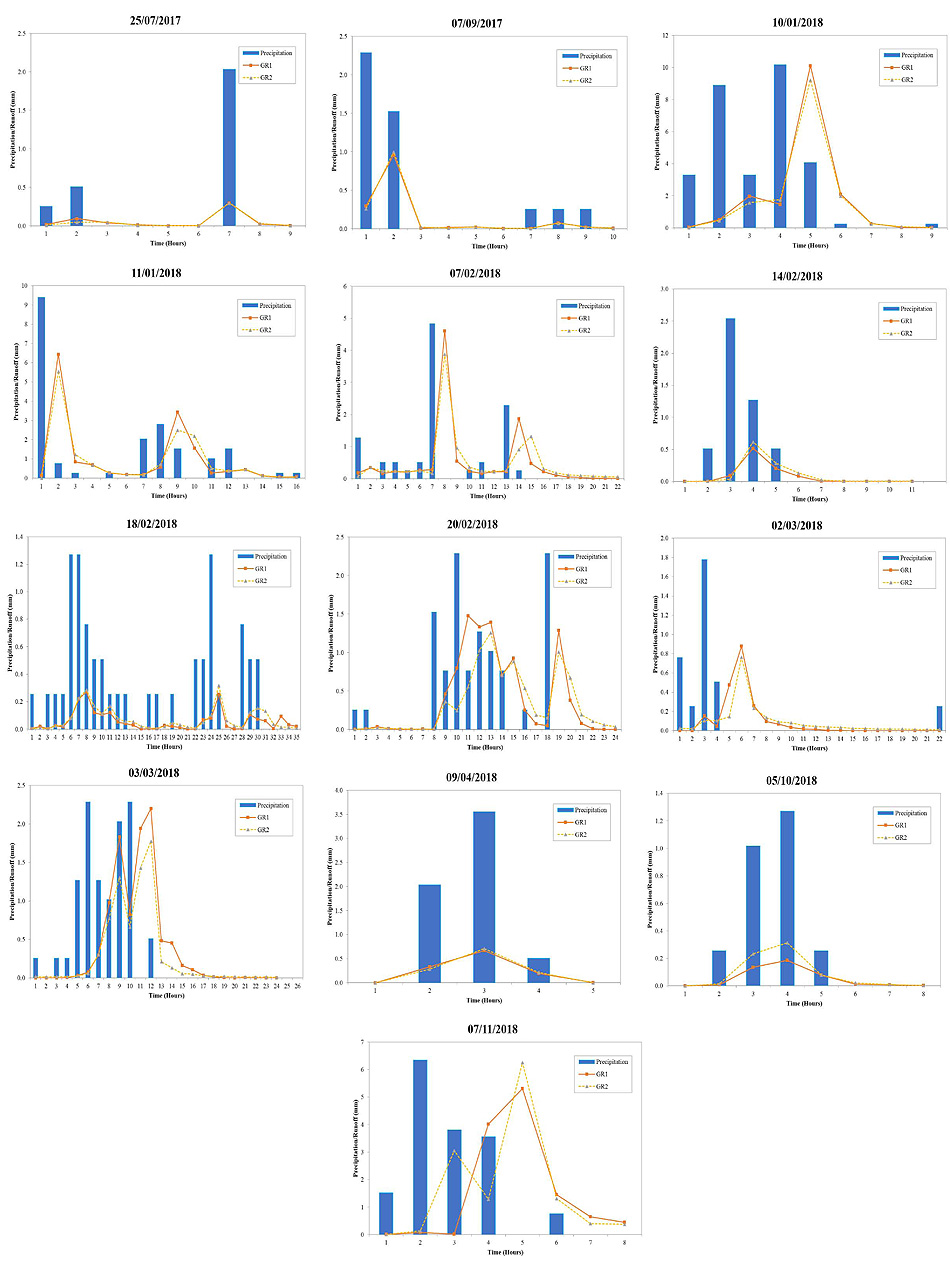
Thirteen rainfall/runoff events measured by the on-site equipment have been considered in the current study (Fig. 4). The events occurred between July 2017 and November 2018 and at least one event for each season has been selected to consider the seasonal variability in the retention behavior. A larger number of events occurred during the monitored period but only high quality data have been selected. In particular, the selection procedure has discarded events with source of uncertainty mainly attributable to a temporary failure of:
| Characteristics | GR1 | GR2 |
|---|---|---|
| Location (Latitude, Longitude) | 40.770425, 14.789443 | |
| Area (m2) | 2.5 | |
| Slope (°) | 1 | |
| Overall thickness (mm) | 150 | |
| Vegetation type | Mesembryanthemum | |
| Substrate depth (mm) | 100 | |
| Substrate material | Peat and zeolite | |
| Porosity (%) | 94 | |
| Drainage (mm) | 50 | |
| Drainage material | Expanded clay | Commercial plastic trays with exclay |
| Retention capacity (l/m2) Drainage |
6.7 | 8.1 |
- The soil moisture sensors, reporting, during some events, very different volumetric water “VW” contents within the substrate layers of the two roofs. Except the above cases, the VW values are constantly similar for the two test benches during the entire monitoring period.
- The rain gauge which measures precipitation value inconsistent with the occurred runoff volume.
- The digital scale that weighs the cumulative runoff volume at the end of the rainfall event without recording its temporal pattern with the fixed time step.
- The tanks presenting sometimes leaks due to the signs of wear, through time and usage.
For the analysis, five minutes data have been processed and aggregated to one-hour intervals. The considered precipitation events significantly differ in duration, maximum intensity and total precipitation (Table 2). It can be observed that the duration of these thirteen storm events is less than 1800 minutes and three events last more than 1000 minutes. The cumulative rainfall ranges from about 2 mm to 30 mm, while the 5-minutes peak intensity is between 0.254 mm/t (t=5 minutes) and 2.54 mm/t (t=5 minutes). Under the same rainfall conditions, the two roofs produce similar volume of runoff, indeed the total runoff differs at the most of 1.2 mm between GR1 and GR2.
2.2. Description of Nash Cascade Model
The Nash cascade model has been applied in this study to model the behavior of the two experimental GRs in terms of runoff production at the event scale. It is a transfer function approach introducing a cascade of successive linear reservoirs to derive the flow at the outlet of the considered hydrological system. Nash [24] proposed to define the instantaneous unit hydrograph by routing instantaneous unit inflow through a cascade of “n” linear reservoirs with storage coefficient “k”. The outflow from the first reservoirs represents the inflow into the second reservoir and so on. This concept can be expressed by the following Eq. (1):
 |
(1) |
According to the convolution integral, the transfer function h(t) is used to transform the net rainfall input p(t) into runoff q(t) Eq. (2):
 |
(2) |
where the net rainfall input p is computed as a fraction
 |
(3) |
As previously said, the hydrological parameters of the model governing the shape of the outflow response are then the number of stores “n”, their storage parameter “k” and the loss coefficient φ.
While the number of two stores has been a-priori fixed, based on an analysis of hydrograph patterns, the storage coefficient “k” cannot be physically measured [30] because an indirect estimation is required [31]. The most commonly used approach for definition of “k” parameter is the calibration of the model. This method contemplates that the model parameter values are adjusted until the simulated runoff matches with the observed one.
The loss coefficient φ has also been set a-priori based on the results of a previous empirical analysis of the retention capacity RC variability undertaken for the same test plots. The GR retention capacity has been found to mainly depend on rainfall properties, in particular on the cumulative rainfall, with larger retention associated with minor rainfall events. However, the quantitative assessment of the empirical relationships between RC and rainfall properties are affected by the substrate soil water content prior to the rainfall event, with prior low moisture content events generally associated with the larger retention capacities.
Provided the knowledge of the volumetric water content at the starting point of the precipitation event and computing the rainfall event properties (Table 2), it is possible to compute the RC and from this, the loss coefficient which has been estimated as Eq. (4):
 |
(4) |
| Events | Duration (min) | Cumulative Rainfall (mm) | 5-minutes Peak Intensity mm/t (t=5 min) | Total Runoff GR1 (mm) | Total Runoff GR2 (mm) |
|---|---|---|---|---|---|
| 25.07.2017 | 420 | 2.794 | 1.52 | 0.49 | 0.44 |
| 07.09.2017 | 540 | 4.572 | 1.52 | 1.42 | 1.42 |
| 10.01.2018 | 540 | 30.226 | 2.54 | 16.56 | 15.40 |
| 11.01.2018 | 960 | 20.066 | 1.52 | 15.57 | 15.05 |
| 07.02.2018 | 840 | 11.176 | 1.27 | 10.39 | 10.54 |
| 14.02.2018 | 1140 | 5.08 | 0.25 | 0.89 | 1.12 |
| 18.02.2018 | 1800 | 11.176 | 0.25 | 1.96 | 2.50 |
| 20.02.2018 | 1080 | 11.43 | 0.50 | 9.27 | 8.06 |
| 02.03.2018 | 240 | 3.556 | 1.01 | 2.04 | 2.00 |
| 03.03.2018 | 720 | 11.43 | 0.50 | 9.40 | 6.96 |
| 09.04.2018 | 180 | 6.096 | 0.76 | 1.19 | 1.20 |
| 05.10.2018 | 240 | 2.794 | 0.25 | 0.42 | 0.67 |
| 07.11.2018 | 360 | 16.002 | 1.27 | 11.96 | 12.79 |
2.3. Model Calibration
The NASH model application requires a calibration phase which ensures to simulate the behavior of the hydrological system with a reasonable level of accuracy. The model has been calibrated using 13 selected rainfall-runoff events. The calibration involves the storage coefficient k since it cannot be directly assessed from field data. An accurate calibration has been achieved through an iterative adjustment process of the k-parameter until a good match is reached between the observed and simulated runoff. Different goodness of fit indices have been used in this respect, the Nash-Sutcliffe efficiency (NSE) index, the root mean square error (RMSE), the mean absolute error (MAE) and the volume error (VE). They are defined as Eqs. (5-8):
 |
(5) |
 |
(6) |
 |
(7) |
 |
(8) |
where n represents the length of the sample, Rmod.i and Robs.i respectively represent the modeled and the observed runoff, and Vmod, Vobs are the modeled and the observed runoff volume.
3. RESULTS AND DISCUSSION
The goodness-of-fit indices reported in the previous section allow defining how good the calibrated Nash cascade model is in predicting GR runoff. Table 3 summarizes the performance statistics revealing that the considered approach provides an accurate estimation of the behavior of both vegetated roofs. In particular, NSE ranges between 0.58 and 0.94 for GR1, while in GR2 the lowest and the highest values are 0.56 and 0.94, respectively . The RMSE reaches maximum values of 2.19 mm for the two eco-covers and minimum values of 0.03 mm. The MAE ranges from 0.02 mm to 1.33 mm for GR1 and from 0.02 to 1.25 for GR2. VE exhibits mean value of 13.7% for GR1 and 8.8 for GR2. According to these results, the model appears to slightly overestimate the runoff production, but overall, it is very promising.
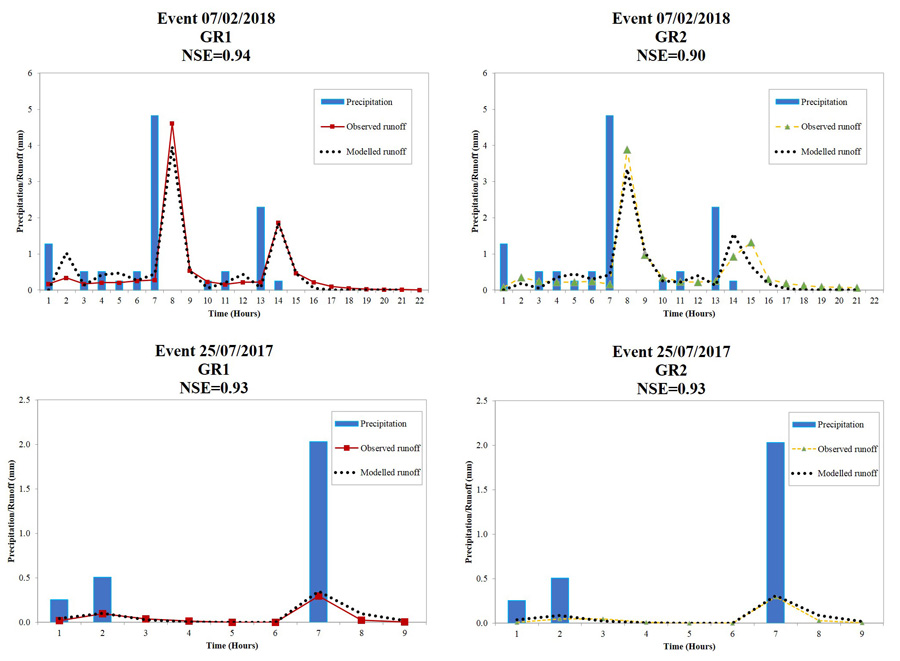
Despite the previous findings that the Nash model is quite accurate in predicting stormwater runoff for both the considered green infrastructures, minor differences exist. In particular, the average values of NSE, RMSE, MAE, VE indices are respectively of 80%, 0.47 mm, 0.29 mm and 13.76% for GR1 and 76%, 0.50 mm, 0.30 mm and 8.81% for GR2 (Table 3) that implies a very moderate better fitting of the model to the runoff values measured from the green roof with the drainage layer made up of expanded clay than from the one consisting of artificial water storage element. For illustrative purpose and in order to further highlight the minimal discrepancies in the hydrological behavior of GR1 and GR2, in Fig. (5), two rainfall/runoff events have been compared. Indeed, the event with the best fit in terms of NSE, between simulated and observed runoff for GR1 and GR2 has been selected and compared with the corresponding in the other roof. The event with the highest model adaptation for GR1 (occurred on 07/02/2018) has an NSE of 0.94 corresponding to a likewise good NSE (0.90) for the same event for GR2. For GR2, the event with the best match between observed and modeled runoff (occurred on 25/07/2017) reaches an NSE of 0.93 which is equivalent to the value of NSE for GR1 during the same rainfall occurrence. Once again, moderate better performances of GR1 than GR2 appears from the modelled patterns.
| Events | NSE (%) | RMSE (mm) | MAE (mm) | VE (%) | ||||
|---|---|---|---|---|---|---|---|---|
| GR1 | GR2 | GR1 | GR2 | GR1 | GR2 | GR1 | GR2 | |
| 25.07.2017 | 93% | 94% | 0.03 | 0.03 | 0.02 | 0.02 | -29.74 | -26.37 |
| 07.09.2017 | 58% | 65% | 0.22 | 0.21 | 0.13 | 0.12 | 45.35 | 29.28 |
| 10.01.2018 | 78% | 75% | 1.84 | 1.71 | 1.07 | 1.04 | -4.01 | -16.75 |
| 11.01.2018 | 93% | 56% | 0.48 | 1.04 | 0.32 | 0.59 | 3.36 | 37.21 |
| 07.02.2018 | 94% | 89% | 0.24 | 0.26 | 0.15 | 0.19 | 0.00 | 8.96 |
| 14.02.2018 | 87% | 91% | 0.04 | 0.04 | 0.01 | 0.02 | 26.29 | 18.79 |
| 18.02.2018 | 77% | 85% | 0.03 | 0.03 | 0.02 | 0.02 | 25.87 | 19.62 |
| 20.02.2018 | 91% | 87% | 0.18 | 0.17 | 0.11 | 0.11 | 7.56 | 5.10 |
| 02.03.2018 | 62% | 59% | 0.13 | 0.11 | 0.06 | 0.05 | -21.85 | -9.26 |
| 03.03.2018 | 80% | 70% | 0.35 | 0.30 | 0.25 | 0.20 | -17.92 | -50.99 |
| 09.04.2018 | 84% | 83% | 0.26 | 0.28 | 0.21 | 0.23 | 33.85 | 9.01 |
| 05.10.2018 | 83% | 75% | 0.05 | 0.10 | 0.03 | 0.07 | 27.51 | 12.43 |
| 07.11.2018 | 61% | 65% | 2.19 | 2.19 | 1.33 | 1.25 | 82.62 | 77.49 |
| mean | 80% | 76% | 0.47 | 0.50 | 0.29 | 0.30 | 13.76 | 8.81 |

Further consideration concerns the relationship emerged between the model errors and the rainfall characteristics. The results in Table 3 coupled to the events description in Table 2, reveal a direct relationship between the RMSE and MAE and the cumulative rainfall of the events for both GR1 and GR2. Specifically, the errors increase as cumulative rainfall increases (Fig. 6). The lowest values of RMSE and MAE for GR1 and GR2, respectively of 0.03 mm and 0.02 mm, correspond to the lowest value of the cumulative rainfall (2.794 mm). Congruently, the worst model performance occurred for the event of November 7th, corresponding to one of the highest values of cumulative rainfall recorded during the observation period (16 mm).
Retention model errors are actually described by the VE index in Table 3. They do not appear to be related to the rainfall properties: the event featured by the largest cumulative rainfall depth has VE errors amounting about 4% and 16%, respectively for GR1 e GR2, whereas the event featured by the smallest cumulative rainfall depth has VE errors amounting about 29% and 26%, respectively for GR1 e GR2. The increase in Nash model simulation errors reported in Fig. (6) for increasing cumulative rainfall depth, it is thus likely to be related to the linearity of the Nash model structure itself, which might not be adequate enough to simulate severe rainfall events.
| Events | k (hours) | |
|---|---|---|
| GR1 | GR2 | |
| 25.07.2017 | 0.50 | 0.53 |
| 07.09.2017 | 0.10 | 0.10 |
| 10.01.2018 | 0.09 | 0.25 |
| 11.01.2018 | 0.32 | 0.03 |
| 07.02.2018 | 0.37 | 0.54 |
| 14.02.2018 | 0.02 | 0.03 |
| 18.02.2018 | 0.01 | 0.35 |
| 20.02.2018 | 0.54 | 1.08 |
| 02.03.2018 | 1.83 | 2.20 |
| 03.03.2018 | 1.44 | 1.58 |
| 9.04.2018 | 0.01 | 0.01 |
| 05.10.2018 | 0.01 | 0.01 |
| 07.11.2018 | 1.28 | 0.84 |
| Mean | 0.50 | 0.58 |
Table 4 shows the values of the storage coefficient resulting from the calibration process. The average values of k are respectively of 0.50 hours for GR1 and 0.58 hours for GR2. This result shows that GR2 has a slightly higher detention capacity than GR1. The larger delay corresponding to the GR2 system could be likely related to the existence of the plastic trays system which stores, retains and delays water until the maximum capacity of the trays is filled.
CONCLUSION
The aim of this paper was to evaluate the ability of Nash cascade linear model to replicate monitored runoff from two green roof test beds in the campus of the University of Salerno, southern Italy. The green roofs differ for the composition of the drainage layer: expanded clay for GR1 and commercial plastic trays filled with expanded clay for GR2. The model has been calibrated using thirteen rainfall-runoff events collected during a monitoring campaign over two years (from July 2017 to November 2018). The parameter optimized in the model calibration is the storage coefficient “k”, as it cannot be measured in the field, while the number of storages n results from an analysis of hydrograph patterns and the loss coefficient φ derives from the results of an empirical analysis of GR retention properties which has been found to depend on the volumetric water contents of the layers and on the characteristics of the precipitation. Event scale model calibration has been based on the comparison between the observed and modeled runoff data using NSE, RMSE, MAE and VE indices. The value of the calibrated storage coefficient k appears consistently similar for both GRs with a very moderately larger delay in the case of the GR2 system, likely related to the existence of the plastic trays system which stores, retains and delays water until the maximum capacity of the trays is filled. In terms of model performance, it has appeared that despite its simplicity, the investigated model is adequately able to predict the runoff generation from the observed green roofs with a good degree of accuracy with NSE, RMSE, MAE and VE values approaching, on average, 80%, 0.47 mm, 0.29 mm and 13.76% for GR1 and 76%, 0.50 mm, 0.30 mm and 8.81% for GR2. The model performances are slightly higher for GR1 than GR2. The analysis revealed a relationship between the cumulative rainfall and the errors indeed. RMSE and MAE seem to increase with increasing precipitation amount and to better understand this point, further investigation is required to quantify the source of the Nash model uncertainty.
CONSENT FOR PUBLICATION
Not applicable.
AVAILABILITY OF DATA AND MATERIALS
The data supporting the findings of the article is available in the [database of Environmental and Maritime Hydraulics Laboratory (LIDAM)] and from the corresponding author on request.
FUNDING
None.
CONFLICT OF INTEREST
The authors declare no conflict of interest, financial or otherwise.
ACKNOWLEDGEMENTS
Declared none.


