All published articles of this journal are available on ScienceDirect.
Application of ANN Predictive Model for the Design of Batch Adsorbers - Equilibrium Simulation of Cr(VI) Adsorption onto Activated Carbon
Abstract
Background:
Escalation of industrial processes continues to increase the concentrations of Cr(VI) in wastewater above permissible discharge limits. Persistent exposure to Cr(VI)may result in deleterious effects on human health, aquatic life, and the environment. Laboratory-scale adsorption studies have proven effective in achieving the low treatment levels demanded by statutory authorities. The eventual design of the pilot and full-scale systems hinges on the ability to predict adsorption behavior mathematically.
Objective:
The objective of this study is to elucidate the mechanism of Cr(VI) adsorption and to develop an Artificial Neural Network (ANN) model capable of accurately simulating complex multi-layered adsorption processes.
Methods:
Batch equilibrium experiments were conducted for the removal of Cr(VI) by activated carbon. Conventional two and three-parameter equilibrium models such as the Langmuir, Freundlich, Sips, original BET and modified BET were used to simulate the data and expound the mechanism of adsorption. An ANN model was constructed with the built-in effect of the residual Cr(VI) concentration for the prediction of the equilibrium sorption capacity.
Results:
The modified BET model was most successful at predicting the monolayer coverage. However, the model failed to capture the complex shape of the isotherm at higher initial concentrations. The highest correlation to the equilibrium data was revealed by the ANN model (R2 = 0.9984).
Conclusion:
A batch adsorber was successfully designed using mass balance, and incorporating the predictive ability of the ANN model. In spite of the ANN’s ability to simulate the adsorption process, it provides little insight into the mechanism of adsorption. However, its ability to accurately predict Cr(VI) removal enables the up-scaling of the adsorption processes to pilot and full-scale design.
1. INTRODUCTION
Chromium is a priority pollutant and exists in various oxidative forms. However, from an environmental pollution point of view, the hexavalent state, Cr(VI), in the forms of chromate (CrO42 −), dichromate (CrO72 −), and chromium oxide (CrO3) is considered the most toxic state of chromium, due to its high oxidizing potential, high solubility, and mobility across the membranes in living organisms and in the environment [1]. According to Thambavani and Kavitha [2], persistent exposure to Cr(VI) affects human health by causing cancer in the digestive tract and lungs, and other health problems such as skin dermatitis, bronchitis, perforation of the nasal septum, severe diarrhea, and hemorrhaging. Additionally, Cr(VI) is toxic to many plants, animals, and microorganisms in the aquatic environment [3]. The extensive use of Cr(VI)in industrial processes such as electroplating, tanning, textile dyeing, and wood preserving invariably results in the discharge of effluents containing soluble Cr(VI) in concentrations above permissible levels [4, 5]. Mubeena and Muthuraman [6] reported Cr(VI)concentrations of 10.0 mg/L in industrial electroplating effluents while Mishra and Soni [7] reported Cr(VI)concentrations as high as 6.7 mg/L in effluents from dyeing and printing industries functioning in Balotara, India. Tara et al. [8] reported 9.67 mg/L of Cr(VI)in textile effluent obtained from industry in Faisalabad, Pakistan. World Health Organization (WHO) recommends that the level of Cr(VI) in wastewater be regulated below 0.05 mg/L [9]. Thus, research into the removal of Cr(VI)from wastewater is critical to protecting human health and the environment.
Some of the primary treatment methods adopted for industrial-scaled remediation of such metal ions are ion exchange, chemical precipitation, and adsorption [10]. Due to its ability to attain low concentration levels, insensitivity to toxic pollutants and simplicity of design and operation, adsorption research has become a major topic of academic focus. Researchers have studied various natural and synthetic adsorbents with each shown to possess a varying affinity for Cr(VI) ions. Goswami and Ghosh [11], reported a monolayer sorption capacity of 3.48 mg Cr(VI) ions per g of synthetic hydrous stannic oxide. Alemu et al. [12] investigated the potential of vesicular basalt for Cr(VI) sorption. The maximum sorption capacity was 79.20 mg/kg of the adsorbent. Agroindustrial waste such as grape and olive waste attained capacities for Cr(VI) of 108.12 mg/g and 100.47 mg/g, respectively [13]. Reddy et al. [14] studied the removal of Cr(VI) using mustard oil cake. The authors reported a total chromium removal of 29 mg/g. Living and dead cells of Bacillus coagulans successfully biosorbed 23.8 and 39.9 mg Cr/g dry weight, respectively of Cr(VI) ions [15]. While biomass waste material-derived activated carbon successfully removed 73.1 mg/g Cr(VI) [16].
The fitting of experimental data to equilibrium models can provide valuable insights into the mechanisms of adsorption and the economic feasibility of the sorbent’s commercial application to enable optimization of the design and up-scale of adsorption units [17, 18]. However, the accuracy of the simulation cannot be overemphasized, as an accurate prediction of the sorption process is critical to enable advancement to pilot and full-scale design. However, in many reported instances, isotherms produced by Cr(VI) adsorption exhibits the BET Type II and Type IV [19] or the Giles L-shape [20] isotherm. Such observations have been reported by Netzahuatl-Muñoz et al. [21] for the sorption of Cr(VI) onto Cupressus lusitanica bark; Terangpi et al. [22] for the removal of Cr(VI) by a modified aniline formaldehyde condensate polymer; Sfaksi et al. [23] for the removal of Cr(VI) by cork waste; Rossi et al. [24] for the removal of Cr(VI) by chemically treated Saccharomyces cerevisiae biomass. Similar complex isotherms have been reported for other adsorbates and adsorbents as methylene blue removal by activated sunflowers seeds shell carbon [25], dazomet adsorption by zoelite [26], and p-nitrophenol adsorption through N2-thermal-based treatment of activated carbons [27].
Zhang et al. [28] studied the adsorption of Cr(VI) onto carbon-microsilica composites. The authors concluded that their complex shaped isotherm belongs to subgroup 3 of L-shape isotherm which corresponds to the classification of Giles et al. [20]. They went on to explain that this shape indicates the formation of a second layer due to an abound of oxygen functional groups, such as hydroxyl, carboxyl and sulfonic groups being introduced into the surface which form H-bond with HCrO4- radical at an acid aqueous solution and remove Cr(VI) from the aqueous solution. When all of the available monolayer sites are occupied, the HCrO4- radical in solution could also be adsorbed by H-bond between the HCrO4- radical in solution and the HCrO4- radical adsorbed on the adsorbent. Ramadoss and Subramaniam [29] reported on the adsorption of Cr(VI) onto blue-green algae. The authors conducted a critical review of isotherm models to simulate the obtained L-shape isotherm. The study considered 12 two-parameter isotherm models including Langmuir [30], Freundlich [31], Jossens [32], Fowler-Guggenheim [33], and Temkin [34]; 18 three-parameter models including the Redlich-Peterson isotherm [35], Radke-prausnitz [36], Koble-Corrigan [37], Toth [38], Sips [39], and Khan [40]; 4 four-parameter models, namely the Baudu Isotherm Model [41] and the Weber-van Vliet Isotherm Model [42]; and the Fritz-Schlunder [43] five-parameter model. The highest R2 (0.9919) to the experimental data was produced by the three-parameter Koble-Corrigan isotherm model, however, the authors concluded that the model was incapable of defining the experimental data. Pedroza et al. [44] also studied the adsorption of Cr(VI) from synthetic solution. In their findings for adsorption using blast furnace dust, the resulting experimental isotherm exhibited a similar complex shape, i.e. an initial plateau followed by a sudden rise in the curve at higher aqueous concentration. The Freundlich isotherm produced the highest R2 (0.96), however, in this instance, the non-linear plot revealed that the correlation falls off as the curve transitions from monolayer to multilayer adsorption. In the study by Schneider et al. [45] of phosphate removal using nanostructured ZnFeZr oxyhydroxide precipitate, the BET model represented the reaction well at higher initial concentrations however, the correlation fell off at lower concentrations. A similar shortfall in the use of conventional models was also observed in work by Al-Qodah and Shawabkah [46] for the adsorption of triadimenol pesticide using activated carbon.
ANN is a computational technique derived from the biological counterparts and based on the concept that a highly interconnected system of simple processing elements known as nodes or neurons enables the learning of highly complex nonlinear interrelationships existing between input and output variables of the data-set [47]. The first artificial neuron was produced in 1943 by McCulloch and Pits [48]. This technique has since gained considerable applications primarily towards the development of predictive models to forecast future values of a particular response variable from a given set of independent variables [49]. Such predictive models are information-driven models and do not require assumptions about the input distribution [50]. Further, it benefits not only in saving cost and time required for experimental studies but also in improving the efficient application of full-scale adsorption systems [51]. Over the years, ANN has also been successfully used to model foundation settlement [52], analysis of airfield pavement heavy-weight deflectometer data [53], batch and column adsorption processes [54-58], fermentation [59] and air drying [60].
The need to attain an accurate mathematical simulation of complex adsorption isotherms provides sufficient interest to undertake this study. Activated carbon remains the most popular adsorbent and has been used with great industrial success [61]. Consequently, research into the removal of Cr(VI) by activated carbon continues unabated. Batch equilibrium studies were conducted using commercial activated carbon to adsorb Cr(VI) ions from aqueous solution. The intent is to subsequently incorporate the operational parameters of the adsorption isotherm into an ANN and develop a predictive model. Using mass transfer, the predictive model may be used to overcome isotherm complexities and facilitate accurate process design and up-scaling. The use of ANN to overcome the shortcomings of conventional fundamental models have been successfully applied by researchers such as Gomez et al. [62] for the simulation of column breakthrough curves; Lee et al. [63] for the design of full-scale coke-plant wastewater treatment process; and Hussain et al. [64] for the prediction of porosity in foods during drying.
The objectives of this work are: (1) to describe the process of Cr(VI)adsorption onto activated carbon through batch equilibrium studies; (2) to elucidate the mechanisms of adsorption aided by simulation using isotherm models; (3) to develop a predictive model using a back-propagation artificial neural network to accurately simulate Cr(VI) adsorption onto activated carbon; and (4) to use the ANN predicted adsorption capacity to design batch adsorbers.
2. EXPERIMENTAL
2.1. Adsorbent
The granular activated carbon used in these experiments was Calgon Filtrasorb 300. According to the manufacturer Calgon Corp. Canada, this carbon has an iodine number of 900 mg/g, an intrinsic pore volume of 0.85 and a BET surface area of 950-1050 m2/g. The carbon was crushed and sieved to produce a Geometric Mean Size (GMS) of 0.21 mm. The (GMS) is expressed as (diameter of upper sieve × diameter of lower sieve)0.5 [65].
2.2. Adsorbate
Reaction solutions were prepared using potassium chromate diluted in distilled water (prepared by a Corning Mega-Pure System MP-1) of pH approximately 7 and conductivity < 5 μmhos/cm. Solution pH was then adjusted to 2.5 using appropriate solutions of HCl which was previously determined to be optimum [66]. Solution pH was measured by a pH meter (Accumet Research-AR10, Fisher Scientific). Cr(VI) concentrations were determined by an Atomic Adsorption Spectrophotometer (Perkin-Elmer 3030B).
2.3. Experimental Procedure
2.3.1. Equilibrium Studies
Batch adsorption studies were conducted using the parallel method according to EPA OPPTS method 835.1230 [67]. The equilibrium experiments were conducted with the initial Cr(VI) metal ion concentration of 66 mg/L held constant while the adsorbent concentration was varied. Adsorbent dose was varied from 0.5 to 5 g/L for contact times of 60 minutes. The adsorbent was then separated by using Whatman No. 2 qualitative filter paper. The concentration of metal ions on activated carbon at the corresponding equilibrium conditions was determined using the mass balance equation expressed as follows:
 |
(1) |
Where, qe (mg/g) is the mass of the adsorbate adsorbed per mass of adsorbent, Co (mg/L) is the initial adsorbate concentration in solution, Ce (mg/L) is the final adsorbate concentration in solution, V is the volume of synthetic adsorbate solution, and M (g) is the mass of the adsorbent.
2.3.2. Equilibrium Models
2.3.2.1. Langmuir Isotherm
The Langmuir isotherm assumes that adsorption sites on the adsorbent possess an equal affinity for molecules and that each site is capable of adsorbing one molecule thus forming a monolayer [30]. The model is represented as follows:
 |
(2) |
Where, qm (mg/g) is the maximum specific uptake, KL (L/mg) is the Langmuir’s constant related to the apparent heat change.
2.3.2.2. Freundlich Isotherm
Firth as cited in [68], explained that the equation of the form x = kc1/n was first applied to adsorption of gases by De Saussure in 1814. Its application was further extended to solutions by Boedecker in 1859 [68]. In 1906, Freundlich described the adsorption isotherm mathematically as a special case for non-ideal and reversible adsorption [31]. This equation is presented as:
 |
(3) |
Where, KF is the Freundlich constant, and n is the Freundlich exponent.
2.3.2.3. Sips Isotherm
Sips [39] developed an empirical sorption isotherm which assumes a molecule can occupy two sites also called the Langmuir-Freundlich isotherm:
 |
(4) |
Where, Ce (mg/L) is the final concentration of ions in solution, qs (mg/g) is the equilibrium sorption capacity, αs is the affinity constant for adsorption, and ns is the index of heterogeneity.
2.3.2.4. Original BET Isotherm (Type 1)
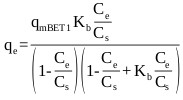
The BET isotherm is an S-shape isotherm originally developed for gas adsorption [69]. According to Ebadi et al. [70], the model allows the determination of multilayer adsorption behavior, monolayer adsorption capacity and heat of adsorption at various adsorption layers. When applying the BET equation to liquid phase adsorption the liquid phase concentration, C is simply substituted for the partial pressure. However, difficulty arises in replacing the saturation partial pressure with the corresponding term in the liquid phase. The application of the model has varied among researchers, where a number of researchers have used CS, as an adjustable parameter and have calculated it by fitting the BET isotherm equation to the experimental data [70]. This form of the model referred to here as BET Type 1 has three degrees of freedom which can be solved by non-linear regression and is given by:
 |
(5) |
Where, qe (mg/g) is the amount of adsorbate sorbed on the solid surface, qm (mg/g) is the amount of adsorbate corresponding to complete monolayer adsorption, Kb is the constant expressive of energy of interaction with the surface, Ce (mg/L) is the equilibrium liquid phase concentration, and CS (mg/L) is an adjustable parameter related to the liquid phase saturated concentration.
2.3.2.5. Modified BET Isotherm (Type 2)
Ebadi et al. [70] presented an adjusted form of the BET isotherm (BET Type 2) for liquid phase where the saturation concentration of the adsorbate was eliminated from the classical BET isotherm equation, and the equilibrium constant of adsorption of upper layers (KL) was reinstated in the equation. The adjusted form of the model is given by:
 |
(6) |
Where, qmBET2 (mg/g) is the amount of adsorbate corresponding to complete monolayer adsorption, KL (mg/L)-1 is the equilibrium constant of adsorption for upper layers in BET isotherm, KS (mg/L)-1 is the equilibrium constant of adsorption for the first layer in Langmuir and BET isotherms and Ceq (mg/L) is the equilibrium liquid phase concentration.
2.3.3. Theory of Artificial Neural Network
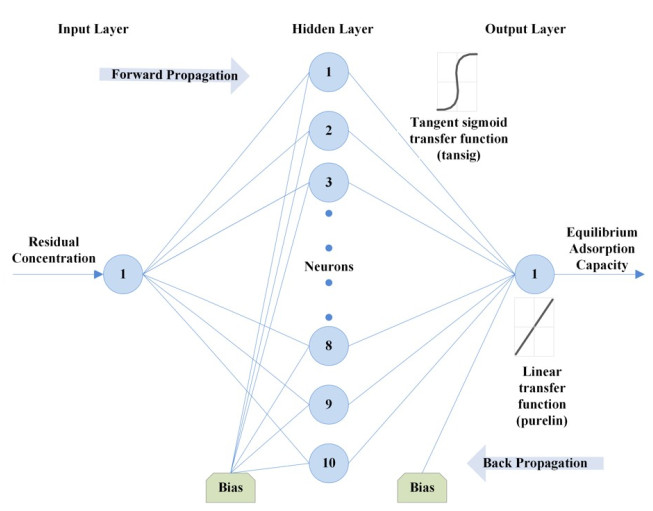
An artificial neural network (ANN) attempts to mimic how a biological system functions and how they can be utilized for their novel architecture to solve highly complex, undefined and nonlinear mathematical problems [71]. In this study, the multilayer feed-forward neural network trained by backpropagation is adopted. This ANN architecture is formed by the number of layers, number of neurons in different layers, transfer function and initial weights which interconnect each layer. According to Lek and Guegan [72], the non-linear elements (neurons) are arranged in successive layers and the information flows unidirectional, from input layer to output layer, through the hidden layers (Fig. 1). The input values (Ce within the range of 5.6 to 52.8 mg/L) are weighted before entering the hidden layer while the bias units add a constant term in the weighted sum, which improves convergence. The output is based on the sum of the weighted values from the input layer and modified by a transfer function [66]. After the network's output is compared with the target vector (qe within the range of 5 to 23.8 mg/g), error values for the hidden units are calculated, and their weights are changed. The backward propagation starts at the output layer and moves backward through the hidden layers until it reaches the input layer [73]. Table 1 presents the transfer functions at both the hidden and output layer used to optimize the model.
2.4. Error Analysis
The goodness of fit of the isotherm models to the experimental data was evaluated using the coefficient of determination, (R2), as well as the Marquardt’s Percent Standard Deviation (MPSD), Hybrid Error Function (HYBRID), Relative Percent Error (RPE) and Mean Square Error (MSE) which are presented in Table 2.
3. RESULTS AND DISCUSSION
3.1. Equilibrium Analysis
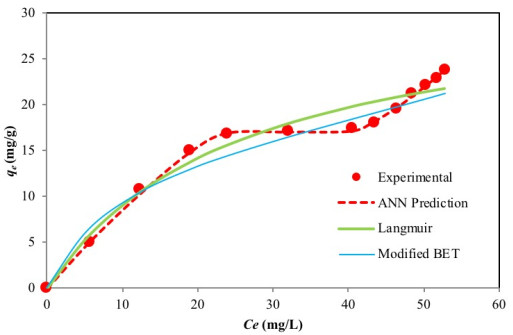
The experimental equilibrium data which describes the adsorption of Cr(VI) by activated carbon was fitted to the two-parameter Langmuir [30] and Freundlich isotherms [31] as well as the three-parameter Sips isotherm [39], the original BET (Type 1) isotherm [69] and the modified BET (Type 2) isotherm [70]. Non-linear regression was used to simulate the experimental data, and the goodness of fit was assessed using error function the results of which are presented in Table 3. Among these isotherm models, the Langmuir model produced the lowest error value.
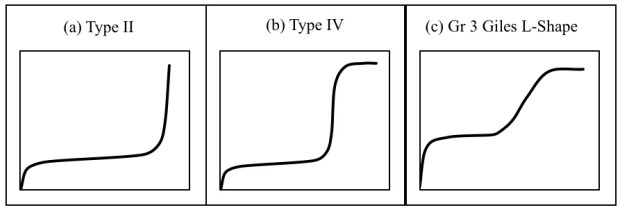
The shape of the experimental curve (Fig. 2) reveals similar characteristics as the classical Type II and Type IV BET isotherms and class 3 Giles L-shape isotherm (Fig. 3a-c), where the flat region of the curve corresponds to the possible formation of a monolayer. Beyond this plateau, the curve begins to climb indicating the possible formation of multi-layers. A plot of the experimental isotherm data together with both Langmuir and modified BET model simulation are shown in Fig. (2). The Langmuir model produced the lowest error values; however, observations of the figure show that the model fails to properly capture the essence of the curve. Although the modified BET also failed to capture the shape of the experimental isotherm, a study of (Fig. 2) reveals the modified BET sorption capacity, qmBET2 from Table 3 was successful in predicting the monolayer coverage of 18.08 mg/g. Though this can prove useful in comparing the performance of adsorbent in terms of monolayer coverage, the model cannot be used for performance and design predictions.
| Name of Transfer Function | Algorithm |
|---|---|
| logsig | f(n) = 1/ (1 + exp(-n)) |
| tansig | f(n) = [2/ (1 + exp(- 2*n))] -1 |
| purelin | f (n) = n |
| Error Functions | Expression | Equation Number | ||
|---|---|---|---|---|
| Relative Percent Error (RPE) | where, N is the number of experimental points. |
|
||
| Marquardt’s Percent Standard Deviation (MPSD) | where, N is the number of experimental points and P is the number of parameters in the regression model. |
|
||
| The Hybrid Error Function (HYBRID) | where, N is the number of experimental points and P is the number of parameters in the regression model. |
|
||
| R2 | where, N is the number of experimental points. |
|
||
| MSE | where, N is the number of experimental points. |
|
| Model | Parameters | Error Functions | ||
|---|---|---|---|---|
| RPE | MPSD | HYBRID | ||
| Langmuir | qe = 32.3; KL = 0.039 | 10.991 | 12.098 | 21.441 |
| Freundlich | KF = 2.874; n = 1.94 | 13.446 | 19.325 | 32.299 |
| Sips | qs = 35.15; αs = 0.032; ns = 0.924 | 11.419 | 14.250 | 26.836 |
| Original BET | qmBET1 = -18.05; Kb = 1.0628; Cs = -11.34 | 11.480 | 17.320 | 28.892 |
| Modified BET | qmBET2 = 18.08; Ks = 0.0937; KL = 0.0055 | 13.221 | 17.608 | 34.570 |
| ANN | 1.688 | 2.061 | 0.603 | |
| Backpropagation (BP) Algorithms | Function | MSE | IN | R2 | Best Linear Eq. |
|---|---|---|---|---|---|
| BFGS quasi-Newton backpropagation | trainbfg | 0.1098 | 2 | 0.7007 | y=0.96x-0.51 |
| Bayesian regularization BP | trainbr | 0.0003 | 28 | - | - |
| Powell–Beale conjugate gradient backpropagation | traincgb | 0.0035 | 15 | 0.9853 | y=1.0x-0.05 |
| Fletcher–Reeves conjugate gradient backpropagation | traincgf | 0.5197 | 69 | 0.8834 | y=0.93x+0.17 |
| Polak-Ribiere conjugate gradient BP | traincgp | 0.0604 | 1 | 0.5004 | y=0.98x+0.11 |
| Gradient descent | traingd | 0.0949 | 1000 | 0.9525 | y=1.1x-0.13 |
| Gradient descent with momentum | traingdm | 0.1909 | 9 | 0.6791 | y=0.84x-0.35 |
| Gradient descent with adaptive learning rate | traingda | 0.0020 | 39 | 0.8731 | y=1.0x-0.077 |
| Gradient descent with momentum & Adaptive Learning | traingdx | 0.8794 | 24 | 0.7412 | y=1.0x-0.03 |
| Levenberg–Marquardt backpropagation | trainlm | 0.0367 | 5 | 0.8626 | y=1.1x-0.14 |
| One step secant backpropagation | trainoss | 0.2171 | 6 | 0.8542 | y=0.8x+0.064 |
| Random weight/Bias | trainr | 0.1585 | 5 | 0.8044 | y=0.82x+0.18 |
| Resilient backpropagation | trainrp | 0.0040 | 5 | 0.8991 | y=0.81x-0.1 |
| Scaled conjugate gradient backpropagation | trainscg | 0.1957 | 2 | 0.8092 | y=0.79x+0.24 |
3.2. Artificial Neural Network Model
An ANN model was developed and optimized in this study [using the neural network toolbox of MATLAB 7.14.0 (R2012a)® ] to predict and simulate the equilibrium manner of Cr(VI) adsorption by activated carbon. A three layer feed-forward back propagation ANN model was adopted with an input layer comprising one neuron as residual concentration (Ce), while the output layer is the adsorbed solid concentration (qe) (Table 6). Critical to the performance of an ANN model is the design of its structure. Thus a protocol was developed for its optimization and is presented.
The data were first normalized in the range -1 to 1 using Eq. (12). The dataset was then divided whereby 85% of the data was applied to training the network and 15% for testing the accuracy of the model and its prediction.
 |
(12) |
Where:
Xi =input or output variable X
Xmin = minimum value of variable X
The impact of training function on the network was first examined Table 4. Using the tansig and purelin transfer functions at the hidden and output layer, respectively and 10 neurons at the hidden layer, the Bayesian regularization back-propagation algorithm produced the lowest MSE of 0.0003. Using the Bayesian regularization back-propagation algorithm, transfer functions from Table 1 were then varied to determine the impact on the network. The performance of these transfer functions at the hidden and output layers was assessed using the MSE and coefficient of determination. Using the first two training, the optimum functions were found to be a tangent sigmoid transfer function (tansig) at the hidden layer and a linear transfer function (purelin) at the output layer (Table 5).
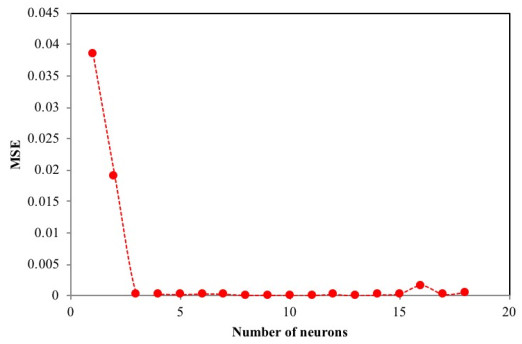
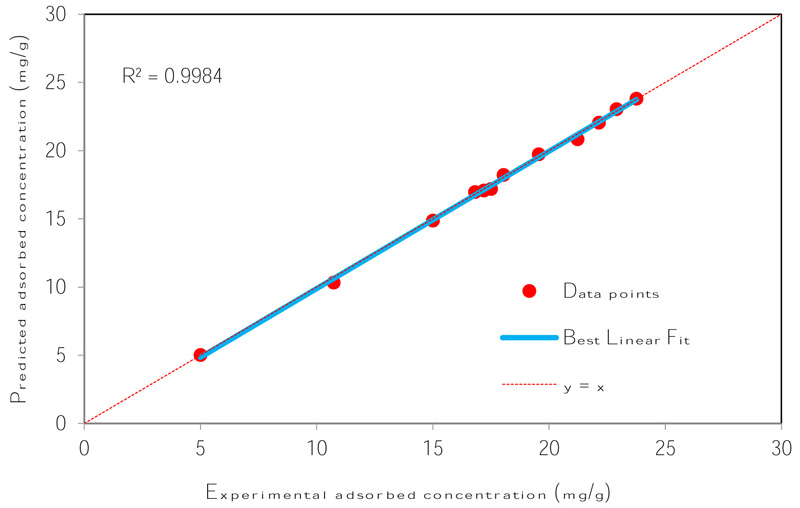
The number of nodes in the hidden layer is critical to the performance of the ANN model. Too few neurons can lead to under-fitting while too many neurons may result in over-fitting [74]. In this protocol, the number of nodes was varied up to 18 and its impact on performance assessed using the MSE. Fig. (4) presents the relationship between MSE value and the number of nodes in the hidden layer. The minimum MSE was found to be 0.00004 at neuron 10. Using this optimized network, the output is compared to the target value and presented in Fig. (5). The plot reveals a coefficient of determination of 0.9984 which is greater than 0.95 and as such, is acceptable. The optimum ANN structure is presented in Table 6. Using the error functions presented in Table 2, the precision of the simulation was assessed as shown in Table 3. The prediction produced the lowest RPE, HYBRID, and MPSD as compared to the other standard equilibrium models. Though the model gives no insight into the mechanisms of adsorption, it does provide a useful tool for the prediction of sorption performance.
| Activation Function Layer 1 | Activation Function Layer 2 | MSE (First Training) | MSE (Second Training) | R2 (First Training) | R2 (Second Training) |
|---|---|---|---|---|---|
| Logsig | Logsig | 0.1009 | 0.1190 | - | - |
| Logsig | Purelin | 0.0004 | 0.0004 | 0.9449 | 0.9449 |
| Logsig | Tansig | 0.0007 | 0.0057 | 0.993 | 0.993 |
| Purelin | Logsig | 0.3575 | 0.1661 | 0.9429 | 0.9429 |
| Purelin | Purelin | 0.0536 | 0.0506 | 0.9429 | 0.9429 |
| Purelin | Tansig | 0.1187 | 0.083 | 0.9411 | 0.9411 |
| Tansig | Logsig | 0.1307 | 0.1287 | 0.8487 | 0.8487 |
| Tansig | Purelin | 0.0003 | 0.0003 | 0.9995 | 0.9995 |
| Tansig | Tansig | 0.0403 | 0.0496 | 0.9296 | 0.9296 |
| Type | Details |
|---|---|
| Network type | Feed-forward backpropagation |
| Transfer function (Hidden Layer) | Tansig |
| Transfer function (Output Layer) | Purelin |
| Training function | Bayesian Regulation |
| Performance function | Mean Square Error (MSE) |
| Neurons in input layer | 1 |
| Neurons in hidden layer | 10 |
| Neurons in output layer | 1 |
| Data used for training | 85% |
| Data for testing | 15% |
| R2 | 0.9984 |
| Adsorbents | Monolayer Adsorption Capacity (mg/g) | pH | Reference |
|---|---|---|---|
| ZeoliteNaX | 6.414 | 4 | [75] |
| Jordanian pottery materials | 28.8 | 3 | [76] |
| Olive stone activated carbon | 25.6 | 1.5 | [77] |
| Pine needles | 40 | 3 | [78] |
| Ore | 15.67 | 2 | [79] |
| Clay | 14.43 | 2 | [79] |
| Magnetic-poly(divinylbenzene-vinylimidazole) microbeads | 4.353 | 2 | [80] |
| Activated carbon | 18.08 | 2.5 | This study |
3.3. Monolayer Comparison to Values in the Literature
The monolayer adsorption capacity of sorbents reported in the literature is compared in Table 7 to values obtained in this study. The table reveals that the activated carbon used in this study compares well to sorbents previously reported. It is noted that the adsorbent in this study exhibited characteristics of the multi-layer formation, which, within the range of operational parameters produced a maximum sorption capacity of 18.08 mg/g. Further, it is emphasized that the present study aims to predict the complex equilibrium behaviour of this adsorbent for the design of batch adsorbers.
3.4. Design of Batch Adsorption System from ANN Predicted Equilibrium Data
3.4.1. Theory of Batch Adsorbers
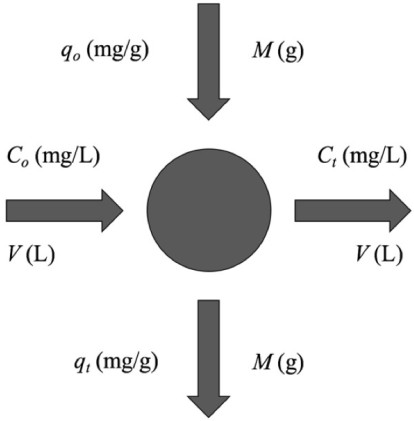
Laboratory-scale equilibrium studies are used to predict batch adsorber size and performance. Fig. (6) shows the schematic of a single-stage batch adsorber with a solution volume of V (L) and the initial Cr(VI) concentration, Co is reduced to Ct as the reaction proceeds. The Cr(VI) loading on the adsorbent in the reactor of mass M (g), changes from qo to qt with increased reaction time. The mass balance for the reactor is given by the following [81, 82]:
 |
(13) |
3.4.2. Development of a Predictive Model
An empirical equation was developed to predict adsorption capacity without having to run the ANN model in Matlab. This will be beneficial not only in saving cost and time required for experimental studies but also in improving the efficient application of full-scale adsorption systems [51]. The equation derived using the weights (Wi) and biases (bi) to the input layer of the optimized network Table 8 is presented here as follows:
 |
(14) |
Where, coefficients are the weights and bias to the output layer and Fi is the tansig activation function used in the hidden layer and is given as:
 |
(15) |
And Ei is the weighted sum of the input defined as:
 |
(16) |
3.4.3. Design of a Batch Adsorber
The adsorption process was best represented by the ANN model, thus the mass balance (Eq. 13) under equilibrium condition (Ct → Ce and qt → qe) is arranged as follows:
 |
(17) |
| i | Input 1 | Bias 1 | Output |
|---|---|---|---|
| Node 1 | 3.1831 | -3.7416 | 1.0969 |
| Node 2 | 4.6201 | -3.3772 | 0.9496 |
| Node 3 | -2.7785 | 2.0832 | 1.2592 |
| Node 4 | 3.2129 | -0.9658 | 0.3095 |
| Node 5 | 3.0881 | -0.3451 | -0.1231 |
| Node 6 | -3.0856 | -0.3557 | 0.0251 |
| Node 7 | -3.0853 | -1.0384 | -0.0381 |
| Node 8 | 3.0822 | 1.7335 | 0.2706 |
| Node 9 | 3.0794 | 2.4138 | 0.2646 |
| Node 10 | 3.0795 | 3.0982 | 0.4054 |
| Bias 2 | 0.3696 |
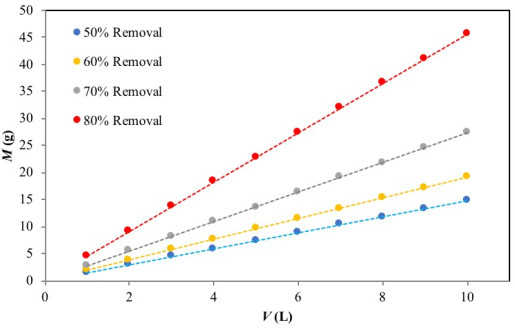
Fig. (7) presents a series of plots of the predicted values of M (g) versusV (L) for 50%, 60%, 70% and 80% Cr(VI) ion removal at the initial concentration of 50 mg/L. As an example, the mass of adsorbent required for 70% Cr(VI) removal from aqueous solution was 8 g and 19 g, for Cr(VI) solution volumes of 3 L and 7, respectively. This evaluation becomes relevant for pilot-batch system design as well as large-scale batch applications.
CONCLUSION
The equilibrium data were modelled using classical two- and three-parameter isotherm models. Among these models, the Langmuir model produced the closest simulation to the experimental data; however, the model failed to successfully capture the shape of the isotherm. The modified BET model was successful in predicting the monolayer sorption capacity of the activated carbon for the Cr(VI) ions; however, the model also produced a poor simulation making it incapable for design applications. An ANN model was successfully developed to simulate and predict the experimental adsorption equilibrium data using the Bayesian Regulation training algorithm. The model was successfully applied to design batch absorbers which can enable up-scale to pilot and full-scale design.
CONSENT FOR PUBLICATION
Not applicable.
AVAILABILITY OF DATA AND MATERIALS
All data supporting the findings are included in the article.
FUNDING
None.
CONFLICT OF INTEREST
The authors declare no conflict of interest, financial or otherwise.
ACKNOWLEDGEMENTS
Declared none.


