All published articles of this journal are available on ScienceDirect.
Multiple Objective Genetic Algorithms for Solving Traffic Signal Optimization Issue at a Complex Intersection: A Case Study in Taichung City, Taiwan
Abstract
Background:
In optimal traffic signal timing, some researchers proposed a single objective genetic algorithm to optimize the timing plan at an isolated intersection. However, the genetic algorithm belongs to a natural selection procession. It means that a suggested model might have a local, optimal result instead of global optimization. A few researchers have tried to avoid local optimization values by making many assumptions for the suggested model, these estimations lacked comprehensive theoretical bases in the transportation field.
Objective:
The objective of this study is to contribute a comprehensive optimization solution, by applying multiple objective genetic algorithms, to minimize the effective green time and cycle length at a complex urban intersection.
Methods:
First, the fitness function was established by the minimum issues of average control delay and queue length at the complex isolated intersection. Secondly, constraint functions were identified based on a scientific basis to provide a comprehensive hypothetical model. After running the hypothetical model with single and multiple objective genetic algorithms and real traffic flow data, the results were compared between the use of multiple genetic algorithms and the use of a single-objective genetic algorithm, between an existing traffic signal timing plan and a suggested traffic signal timing plan. Then, the traffic simulation model for the complex intersection was generated to validate the effectiveness of the suggested method.
Results:
After comparison, the suggested model was found to be more efficient than the existing traffic signal timing at the complex intersection.
Conclusion:
This study demonstrated multiple objective genetic algorithms that overwhelmed the single objective genetic algorithm in optimal traffic signal timing. The multiple objective genetic algorithms could be effectively used to handle traffic optimization at a complex large-scale intersection. Furthermore, a comprehensive solution of applying multiple genetic algorithms to deal with traffic signal optimization has been generated in this research.
1. INTRODUCTION
Road network reconstruction and urgent projects are still unable to meet the requirements of the explosive growth of traffic demand. The traffic jams have been becoming more frequent as a major barrier to the process of urbanization. The travel time of commuters is wasted by being stuck in rush hour traffic. The major cause is happening at the junctions or intersections by the constant traffic signal control. Finding optimal, short term, and long-term solutions to deal with traffic jams is needed. In the computer era and with cutting-edge technology, there is a vast variety of heterogeneous mobility data that can be collected, analyzed, and utilized in traffic control as well as traffic management.
The co-ordination issue for adjacent intersection or a traffic network is a basic prerequisite to optimal traffic signal timing plans [1]. Besides, the optimization of the traffic signal at the complex isolated intersection should be concerned about using real data of traffic flow and complex large- scale optimization algorithms to handle the traffic congestion during rush hour or pick period. In that way, the traffic jams situation will be improved significantly. Optimization, by taking advantage of the Genetic Algorithm (GA) based on the natural evolution theory of Darwin, can be applied in many aspects. Few studies applied GA in optimal traffic signal timing.
Xiao-Feng Chen and Zhong-Ke Shi [2] suggested that the real coded genetic algorithm can be applied effectively in optimistic traffic signal timing by minimizing retained vehicles at a particular intersection. Performance indexes have been evaluated by GA to provide a set of optimal green extension time for signal timing plan at an isolated intersection. Leena Singh et al. [3] and Min Keng Tan et al. [4] generated a fitness function, based on the correlation between the proportion of critical flow ratio and effective green time ratio, applying GA to analyze under and oversaturated condition at four legs intersection. There are a few studies concentrated on minimizing the value of average delay by GA to derive effective green times for each phase signalization [5, 6]. However, the optimization of the traffic signal timing plan, for isolated intersection by GA, utilized a single-objective genetic algorithm which was more popular and lacked theoretical bases to generate constraints condition of variables to approach the global optimization or best solution directly.
Els I. Ducheyne et al. [7] demonstrated that multiple objective GA might overcome these shortcomings of single-objective GA and perform better solutions in the Pareto frontier. Furthermore, by using the scalar fitness function Hisao Ishibuchi et al. [8], it was indicated that the multiple objectives GA outperform single objective GA and are more likely to escape from local optimal. Thus, the multiple objectives GA should be utilized to tackle the traffic signal optimization instead of using the single objective GA (SOGA).
A few pieces of research showed that the well-known traditional method, to handle traffic signal optimization, is based on Webster's model. However, in case of the oversaturated condition or saturated level, Webster's formula is definitely incapable [9, 10]. Hence, finding a flexible and comprehensive solution to deal with the optimum issues in transportation is extremely important in urbanization.
This study sets one's sight on researching new methodologies to derive the expected optimistic timing plan of the isolated intersection. In this essay, we present the effectiveness of applying Multiple Objective Genetic Algorithms (MOGA) to deal with the traffic optimization problems at large-scale and complex signal intersection in the arterial road. Section 2 presents the methodology of this study containing the development of model formulation. In sections 3 and 4, a case study and empirical analysis are indicated. In section 5, the conclusion and remarks are presented to demonstrate the efficiency of the methodology based on the analysis of empirical results. In order to provide an overview, our contributions in this essay are mentioned by the following:
(i) Suggest a new solution to deal with the Traffic Signal Optimization (TSO) at the complex intersection by MOGA that overcomes the shortcomings of a traditional solution, which is Webster's method.
(ii) Provide a comprehensive solution by applying MOGA to identify an appropriate fitness function, define suitable constraints, and run the hypothetical model with appropriate values of genetic operators.
(iii) Contribute the entire model, including fitness function, constraint functions, and GA’s operators to develop subprograms by programming.
(iv) Generate microscopic traffic simulation models for existing traffic signal timing plans and suggested traffic signal timing plans to validate the efficiencies and qualities of the proposed method.
2. MATERIALS AND METHODS
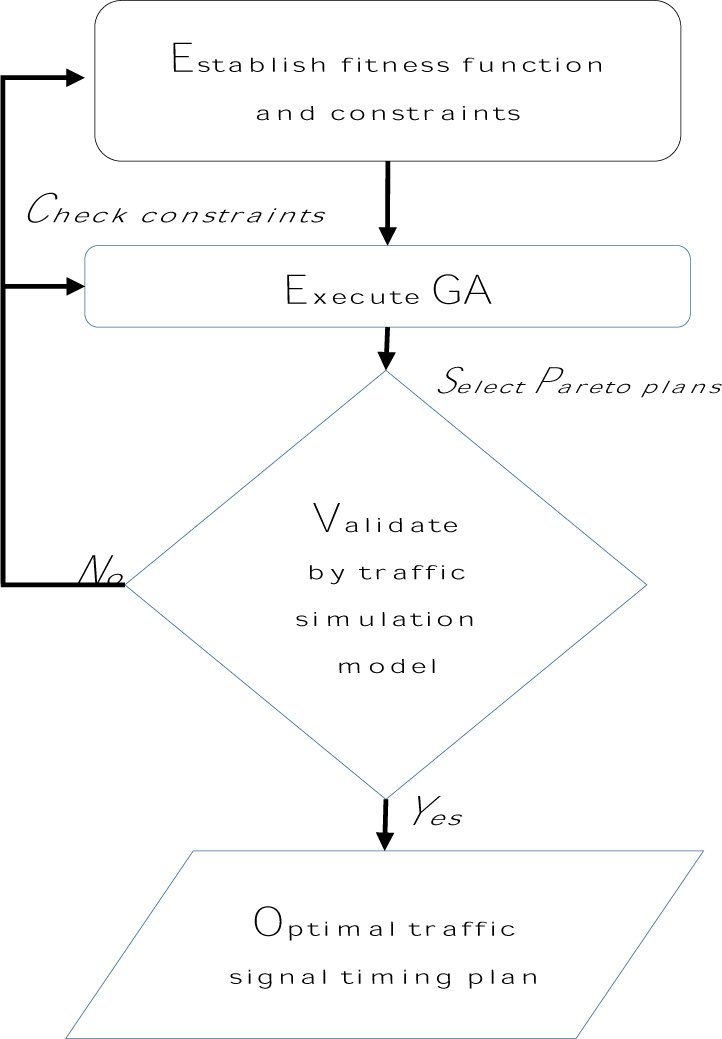
2.1. Fitness Function
The fitness function is typically generated to guide the optimization. In this model, the fitness function has been defined by two objective functions, which are being optimized, i.e. average delay and queue length. In this research, we will present the effective green time (tij) and cycle length (C) variables to establish the fitness function (Fig. 1). Traffic pattern demand will be calculated by the existing traffic flow. And other factors, such as total Loss time (L), capacity, satu-ration flow rate are based on previous studies [11-13].
2.1.1. Average Control Delay Function
The average control delay (sec/vehicle) has been applied in many pieces of research to estimate the Level of Service (LOS) and then determine the traffic situation of a signalized intersection. As discussed above, the most popular model is Webster’s formula for a minimum average delay as well as optimal cycle length. However, in the case of an over-saturated condition or a high degree of saturation flow rate, the Webster’s formula becomes unreasonable. After comparison and experimental test, Francois Dion et al. [14] and Ahmed Y. Zakariya et al. [15] suggested another method, that should be generated for a wide range estimation, is the average control model for each lane group in Highway Capacity Manual (HCM). The average control delay could be calculated by the rate between total control delay per vehicle and the sum of vehicular traffic.
 |
(1) |
Where, ADI is the average vehicle delay of the complex intersection includes n phases and m lane groups (lg), tij,lg is the effective green time for phase i and lane group j, C is the cycle length, Xij,lg is the v/c ratio (the ratio of traffic flow to the capacity of lane group j in phase i), T is analysis period which equals 15 minutes or 0.25 hour in this case study, k is an incremental delay factor, I is the upstream filtering adjustment factor which equals 1.0 for particular isolated intersection, vij is the traffic flow rate of lane group j for phase i.
2.1.2. Queue Length Function
The queue length at the isolated intersection can be determined by the subtraction of departing vehicles from arriving vehicles at the intersection [16]. While Punyaanek Srisurin et al. [17] and Akçelik, Rahmi [18] suggested that the queuing length should be specified by multiplying the corresponding idle time (corresponding red time) by the rate of arrival of the vehicle at the isolated intersection. Typically, the maximum throughput vehicle in rush hour is extremely important based on the arrival rate of vehicles at the intersection from traffic flow data. Therefore, we suppose the average queue length per cycle calculated by equation (2).
 |
(2) |
Where, AQI is the average queue length in cycle traffic signal timing at the intersection, AVij is arrival vehicle rate in the rush hour of lane group j for phase i, Rij is the corresponding idle time (equals total effective green time in other phases), Qij is the initial queue length of lane group j for phase i.
2.2. Constraints
In optimization problems, the global optimization values are more necessary than local optimum values that can directly satisfy the minimum or maximum issues of the fitness function, meet all requirements of the research model in both of deterministic method and stochastic method. Searching the global optimization values, the constrained optimizations are known as a highly deterministic solution and convenient in searching global optimum values [19]. In traffic signal optimization, the constraints of effective green time and cycle length enable the operation of the traffic-timing plan at the isolated intersection to be safer and efficient. Based on the traffic safety issues and efficiencies, the effective green time and cycle length satisfy the following constraint.
 |
(3) |
Where, Cmin is the minimum value of allowed cycle length, Cmax is the maximum value of allowed cycle length at the intersection, tij,min = Lb (lower bounds) and tij,max = Ub (upper bounds) are the lowest values, upper limit values of effective green times, respectively.
2.2.1. Constraints of Necessary Cycle Length
The information of minimum cycle length could be directly found using a previous study [13]. The lowest suggested value of required cycle length for the phasing diagram and the lane group volumes of an intersection have been given by:
 |
(4) |
Where, L is the total lost time for the cycle in seconds at the intersection,
 is the sum of the critical lane group flow ratios calculated by traffic volume (v) and saturation flow rate (s), Xc is critical v/c ratio for the intersection that is defined by the traffic volume (v) and traffic capacity (c) at the intersection. In the case of designing an intersection operation at its full capacity, the value of Xc=1 should be used. The same idea has been found in a previous study [11] and Ahmeh Y Zakaria et al. [15] recommended the minimum value of cycle length Cmin as a duration time that provides enough time to the arriving vehicles to pass through the intersection in the same cycle length by the following equation:
 |
(5) |
Furthermore, Ahmeh Y Zakaria et al. [15] mentioned that the maximum value of cycle length Cmax depends on the empirical analysis and decision-making experiments. The long cycle length includes a long red time interval leading to a long time delay at the intersection. Normally, the value of 120 sec should be set for the upper limit of cycle length. In some exceptional cases, the value should be considered by cycle lengths in excess of 3 minutes (equals 180 seconds) [13], for example, the intersection in the arterial road, complex urban intersection, or oversaturated traffic flow condition.
 |
(6) |
 |
(7) |
2.2.2. Constraints of Safe Pedestrian Crossings and Coordinated Traffic Control Issue
The appropriate constraints enable the fitness function to escape the local optimum values and approach the global optimal value. Several researchers have attempted to assume the limitation of effective green time based on professional skill, however, with a lack of theoretical basis [2, 4-6, 20], we suggest the use of minimum effective green time in [12] that meets the requirement for safe pedestrian crossings.
 |
(8) |
 |
(9) |
Where, D is the distance of the crosswalk, Sp is the walking speed of pedestrians, WE is the width of the crosswalk, Nped is the number of pedestrians crossing during the green interval.
For traffic control system at the intersection with more than two phases, besides the timing requirements for safe pedestrian crossings, Hao Wang et al. [21] indicated that the reasonable traffic signal timing scheme has to ensure the saturation of another phase which is not big to restrict the traffic jam happening in coordinated traffic control signalized system or traffic network. Based on Hao Wang's model, we supposed the limitation for the other effective green times at the intersection by the following expression:
 |
(10) |
According to equation (8), the other minimum effective green times tij,min and maximum value of effective green times tij,max are constructed.
2.2.3. Constraints of Available Effective Green Times in the Cycle Length
The relationship between effective green time and cycle length could be found as described in a study [11], by subtracting lost time per cycle from cycle length
 |
(11) |
2.2.4. Constraints of Allocated Green Times
To apply the constraints of allocating green times in GA’s optimal traffic signal timing process, these constraints might be known as linear equalities [13]. The green-time allocations for the phases of the cycle at the intersection are defined by:
 |
(12) |
Where, Xij is v/c ratio for lane group j in phase i,
 and C is as previously defined.
2.3. Designing Performed Genetic Algorithm
Genetic Algorithm is one of the stochastic global optimization search algorithms based on the evolution theory and natural selection procession that inspired Charles Darwin’s research. The natural evolution typically starts from a population of random chromosomes or randomly generated individuals.
The process of GA (Fig. 2). can be divided into some steps:
[i] The natural selection through the fitness-based process is generated to search for individual solutions.
[ii] This evolution process is repeated until reaching the terminated conditions
[iii] This current process has been improved by Genetics’ operators, which are mutation operators, crossover operators, and selection operators.
| Literatures | Population Size | Crossover Rate | Mutation Rate | Generation |
|---|---|---|---|---|
| Xiao-Fengchen and Zhong-Ke Shi (2002) [2] | 70 | 0.5 | 0.1 | 200 |
| Min Keng Tan et al. (2016) [4] | 50 | 0.9 | 0.1 | 100 |
| Xiaoliang Ma et al. (2014) [22] | 20 | 0.5 | 0.05-0.5 | 60 |
| Kwasnicka, H. and M. Stanek (2006) [23] | 100 | 0.6 | 0.12 | 70 |
| Tahere .Royani et al. (2010) [24] | 220 | 0.5 | 0.01 | - |
| Jianhua Guo et al. (2019) [20] | 30- 160 | 0.6- 0.95 | 0.001-0.1 | 100 |
| Dadmehr Rahbari (2014) [25] | 20 | 0.5 | 0.02 | 200 |
| Yang Xinwu et al. (2016) [26] | 100 | 0.4 | 0.03 | 100 |
| Olympia Roeva et al. (2015) [27] | 100 | 0.75 | 0.01 | 200 |
| Summary | 20-160 | 0.5-0.95 | 0.001-0.5 | 60-200 |
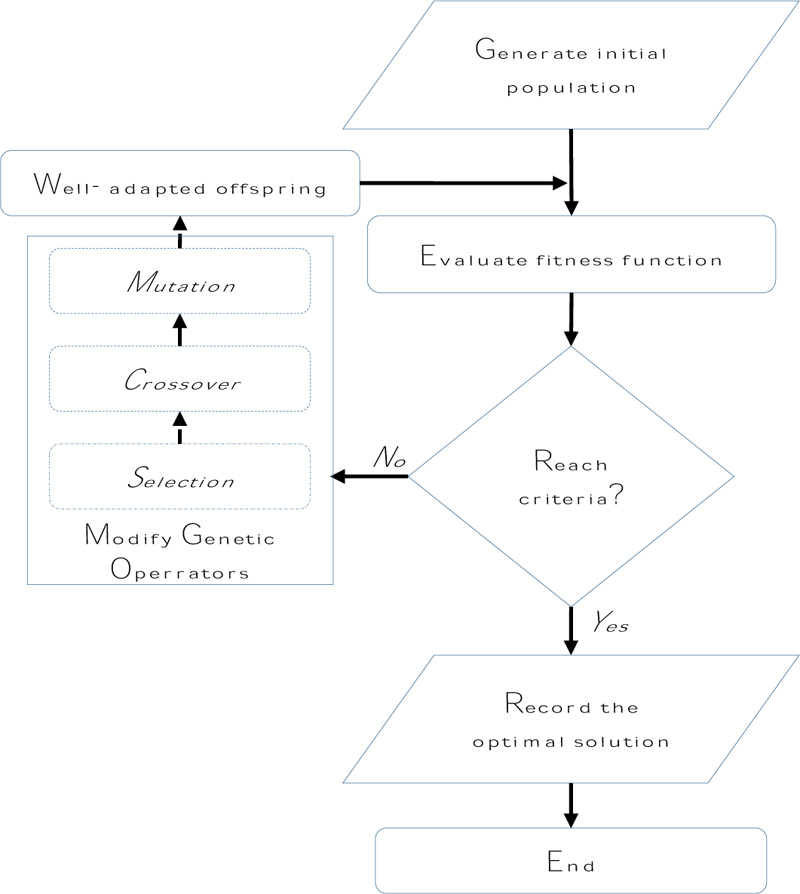
This process has chosen the optimal values of chro-mosomes that meet all requirements of the fitness function. Thus, finding the appropriate genetics’ operators will enhance the effectiveness of the solution.
In optimal traffic signal timing, there are some researchers who suggested the genetic operators as described in the Table 1.
The correlation between crossover probability and mutation probability is not necessary for analyzing GA's process [28]. In GA's process, the stable mutation rate should be used to have a better GA performance [29] and the mutation rate more than 0.05 might have a detrimental effect on GA performance. Then, Patil V.P. and Pawar D.D. [30] reviewed a set of literature to find the best choice for GA's operator, which mentioned that the adaptive genetic algorithm takes advantage of searching for the suitable crossover, mutation rate and the optimistic rate of mutation (0.001), crossover (0.6), population size (50-100) have been utilized in many implemented research.
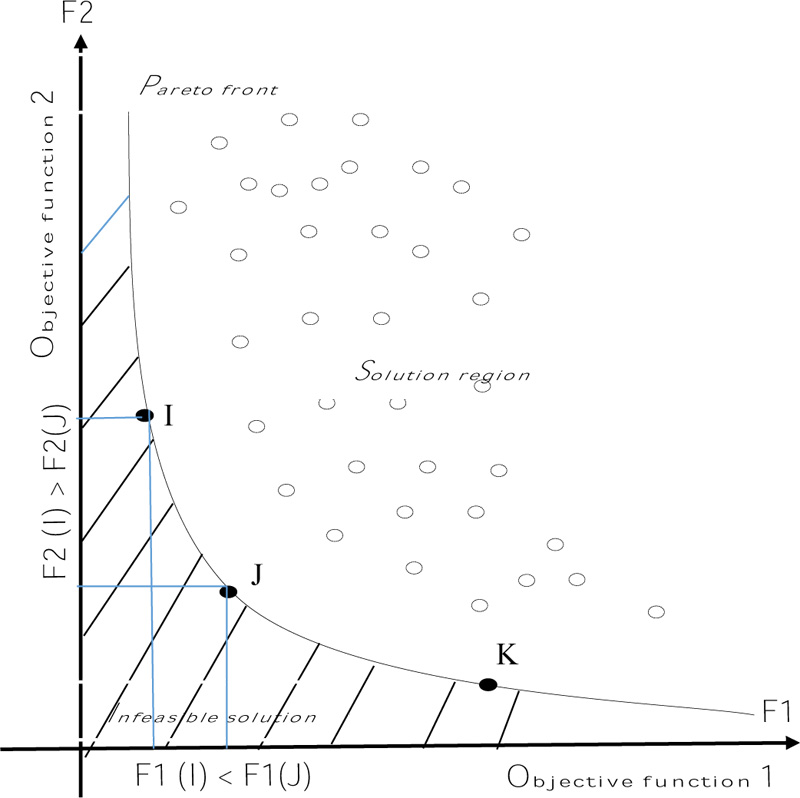
2.4. Pareto Optimality
The Pareto optimality of Pareto efficiency is a situation where no party can be made better off without making another party worse off. It occurs anywhere along the Production Possibility Frontier (PPF). It represents a situation in which resources are fully employed and therefore, increasing production of one good requires sacrificing the production of another, for example, point (I) and point (J) in Pareto front (Fig. 3).
There are many performance indexes to clarify the efficiency of the Pareto front then validate the quality of the research method. In this essay, we suppose the spread indicator, which is a measure of the movement of the Pareto set [31, 32].
 |
(13) |
Where, Q is the number of these solutions in Pareto front, d is the average distance measured among these solutions, μ is the sum over the k objective function indices of the norm of the difference between the current minimum-value Pareto point for that index and the minimum point for that index in the previous iteration, σ is the standard deviation of the crowding distance measure of solutions. When the values of the objective function are stable between iterations (μ is small), the spread is small. Hence, based on the spread indicator, the efficiencies of different GA's operators could be found out.
3. CASE STUDY
3.1. Data Collection
As discussed above, the first aim of this study is to handle the traffic signal optimization at a complex intersection. A crowded intersection located in Taichung City, Taiwan, has been chosen in this essay.
Taichung is located in central Taiwan and is the third-largest city in the island country. The designed traffic network of Taichung City typically follows a radial road layout. Its center is at the Taichung railway station in Central District. The major and arterial roads start from Central District to run outwards, including Xiangshang Road, Zhongshan Road, Zhongqing Road, and Taiwan Boulevard. Currently, the major type of transport in Taichung city is road transport where there is a local bus service along with long-distance bus services, many of which are to districts or townships not served by trains.
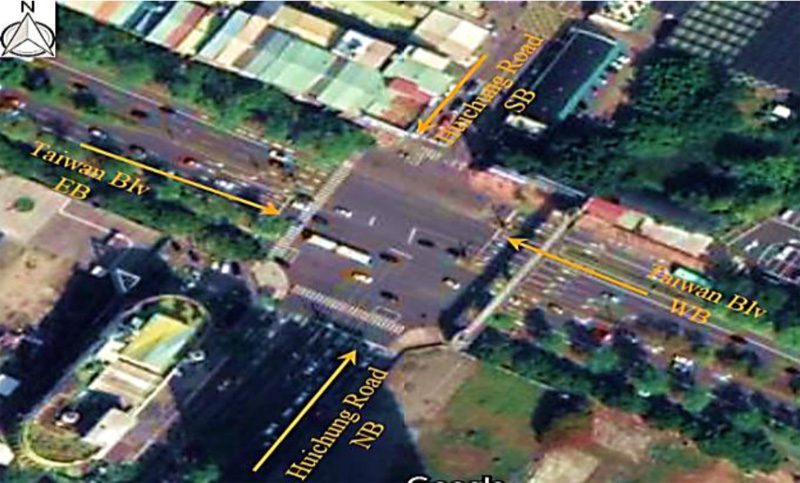
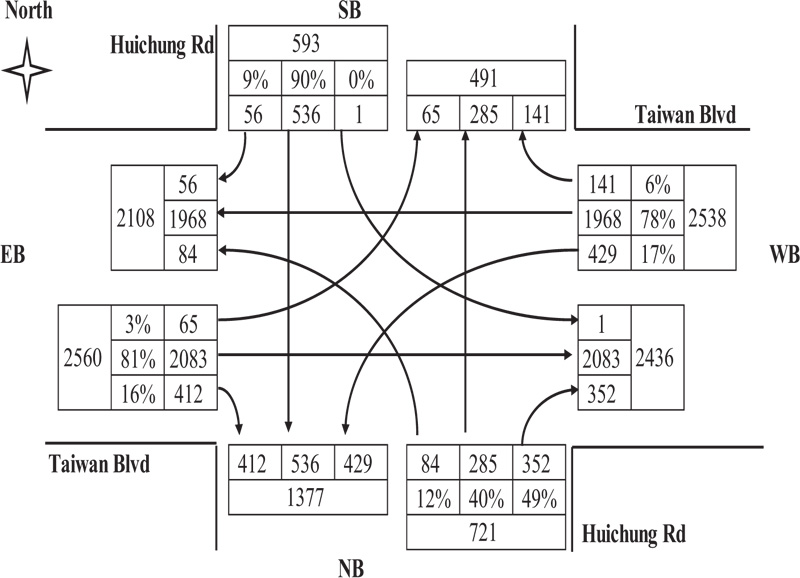
Besides, Taichung city has the highest private vehicle owner rate in Taiwan with more than 300 private cars and 600 motorcycles per 1000 citizens [33]. Thus, traffic jams have been happening more frequently at some intersections in arterial roads, as discussed above. This study will concentrate on the traffic situation in Taiwan Boulevard- Huichung road intersection (Taiwan Blvd- Huichung Rd intersection) which is a complex and large-scale intersection in Taiwan Boulevard with a high density of traffic flow (Fig. 4).
At Tawan Blvd-Huichung Rd intersection, traffic congestion has been happening in rush hour, typically from 7 am to 8 am and from 5 pm to 6 pm (Fig. 5). In this study, the collected data of Taiwan Blvd-Huichung Rd intersection's traffic flow directly, extracted by Video detector data between 7 am and 8 am on various weekend days, will be used to implement optimal traffic signal timing plans by multiple genetic algorithms. The raw data is randomly observed by video detectors, then the arriving rate of the vehicles is calculated by dividing the total arrival vehicles by the duration time of collected data. The heterogeneous type of arriving vehicles has been transformed into the Passenger Car Unit (PCU) for the entire study.
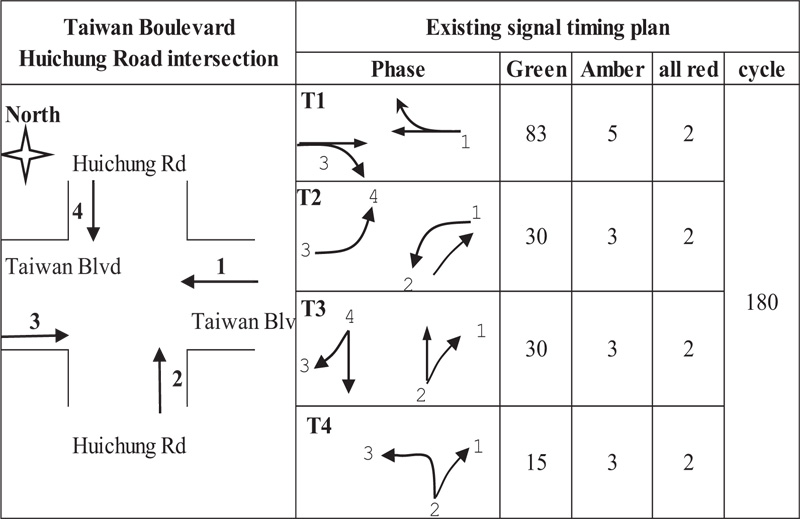
The existing traffic signal control at Taiwan Blvd- Huichung Rd intersection has four phases with a complex turning diagram in each phase (Fig. 6). The current cycle length equals 180 seconds and has been designed for an exceptional timing plan at the complex urban intersection. The actual green time allocated for each phase is based on the existing traffic flow. However, the traffic jam still happens in the duration time, as mentioned above.
3.2. Data Analysis
3.2.1. Establishing the Fitness Function
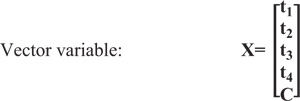
The fitness function that guided the optimum process has been generated by two objective functions, including average control function and queue length function, equations (1) and (2), respectively. The methodology of this study is to handle the optimal traffic signal timing for a complex intersection with four phases and four approaches. According to the process in section 2.1, real data of traffic pattern demand, and assumed values of some constant indicators discussed above, the first objective function has been generated by five variables, inclu-ding effective green times (t1, t2, t3, t4) and cycle length (C).
As stated in section 2.1.2., the queuing length could be calculated by equation (2) for each approach by multiplying the rate of the arriving vehicle by the corresponding effective red time for each movement, for example, effective green time t1 has corresponding idle time is (t2 +t3+t4). Thus, the queue length at the West approach and the East approach is directly defined by the following equation:
 |
(14) |
Where, TET and TER are the average arrival rates of Taiwan Blvd's arriving vehicles on the Eastbound (EB) having through-movements and taking right-turns, respectively. TWT and TWR are the average arrival rates of Taiwan Blvd's arriving vehicles on the Westbound (WB) having through-movements and taking right-turns, respectively.
In other movements, the queue lengths have been detected by the same procedure. Hence, the total queue length of Taiwan Blvd- Huichung Rd intersection has been established by equation (2). Notice that we assumed the arrival rate of vehicles is basically stable as well as ignoring the initial queue length of each movement (Qij,int= 0) during the entire empirical analysis.
3.2.2. Identification of the Constraints
As reported in section 2.2., the constraints of effective green time and cycle length have been presented. While the minimum value of cycle length is calculated by equation (4), the maximum value of cycle length assumed 180 seconds for the complex intersection in an urban area and the total loss time equals 16 seconds per cycle (sum of start-up and clearance delays equal 4 seconds per phase) [12]. The empirical analysis concentrated on the lane group traffic volume for the large-scale and complex intersection by some advantages of significant decreasing queuing length and intersection delay [34].
Furthermore, in agreement with the safe pedestrian crossing issue, two minimum values of effective green time have been defined by the mentioned formulae (8) and (9). The widths of Taiwan Blvd and Huichung Rd are measured by the traffic geometry of this intersection. The distances of the crosswalk are typically designed 4 meters for every large- scale intersection in Taichung city, the number of pedestrians who cross this intersection is collected by video detector data and assumed that the average walking speed of pedestrians is 4 (ft/s) [11]. Other lowest value of effective green times and maximum value of effective green times have been defined by formula (10).
In this manner, the lowest and highest limitation of effective green times and cycle length (t1, t2, t3, t4, C) have been calculated (35 ≤ t1 ≤ 88, 11 ≤ t2 ≤ 131, 44 ≤ t3 ≤ 119, 05 ≤ t4 ≤152, 84 ≤ C ≤ 180). Thus, the lower bound (lb) and upper bound (ub) of variable specified as vectors:
 |
(15) |
According to formula (11), the linear equality constraint referring to the relationship between effective green time and cycle length has defined:
 |
(16) |
Equivalent to:
 |
(17) |
Where, total loss time is as previously defined (L= 16 seconds).
As claimed by formula (12), the cycle length will be allocated by effective green time based on traffic flow data. In this study, we proposed the effective green-times allocation to the high average rate of arriving vehicle approaches, for example, the major movements of vehicles are the phase T1 and phase T3 (through movements and right-turns) at Taiwan Blvd-Huichung Rd intersection. Therefore, the linear equality constraint referring to allocated green times have been generated:
 |
(18) |
 |
(19) |
Equivalent to:
 |
(20) |
 |
(21) |
The linear equality constraints could be described by the following equation:
 |
(22) |
Where:
 |
(23) |
 |
(24) |
 |
(25) |
3.2.3. The Performed MOGA Solution
The Genetic Algorithm (GA) is stochastic by the operator’s factors (mutation, selection, and crossover) that can make random solutions. Thus, running the GA solution can have different results. The multiple objective GA and suitable constraint conditions take advantage of the limitation values of fitness solutions in Pareto front. Nevertheless, the true Pareto frontier might be found by the appropriate genetic operator and population size. As analyzed in section 2.3, in traffic signal optimization, the crossover operator can be chosen in a range of 0.5 to 0.95, the mutation rate is from 0.001 to 0.5, associated with a population size between 20 and 160 for 60 to 200 generations. Furthermore, the adaptive GA benefits GA's effectiveness and the correlation between mutation probability and crossover probability is not necessary, as mentioned above.
Thus, the crossover operator rate could be adopted from 0.5 to 0.95 to retrieve optimistic solutions and the stable value of the mutation rate (equals 0.001) should be used to have better GA performance. The most widely used population size is 100 in many empirical analyses, as mentioned in Table 1 (reviewing suggested genetic operators). In the era of cutting- edge technology and computers, the computing process is significantly faster. Therefore, the number of generations of more than 200 could be set for the entire process. Generally, we supposed the performed MOGA' procedure as the following options:
- Set the mutation rate as 0.001 with an adapted mutation type.
- Establish the population size as 100, generation as 200, and the selection operator as type selection's tournament.
- Check empirical results by spread indicator (13) with different values of crossover probability from 0.5 to 0.95.
Overall, the subprogram has been written based on the analyzed model by Matlab programming to handle the real traffic flow at Taiwan Blvd- Huichung Rd intersection.
4. RESULT EVALUATION
4.1. The Traffic Signal Timing Evaluation
The Table 2. shows the correlation between the crossover probability and the value of the spread factor. It is immediately obvious that the minimum value of the spread factor gained at the crossover probability as 0.5. This result demonstrates that the proposed probability of crossover operator as 0.5 should be utilized in optimization traffic signal timing as mentioned in previous studies (Table 2).
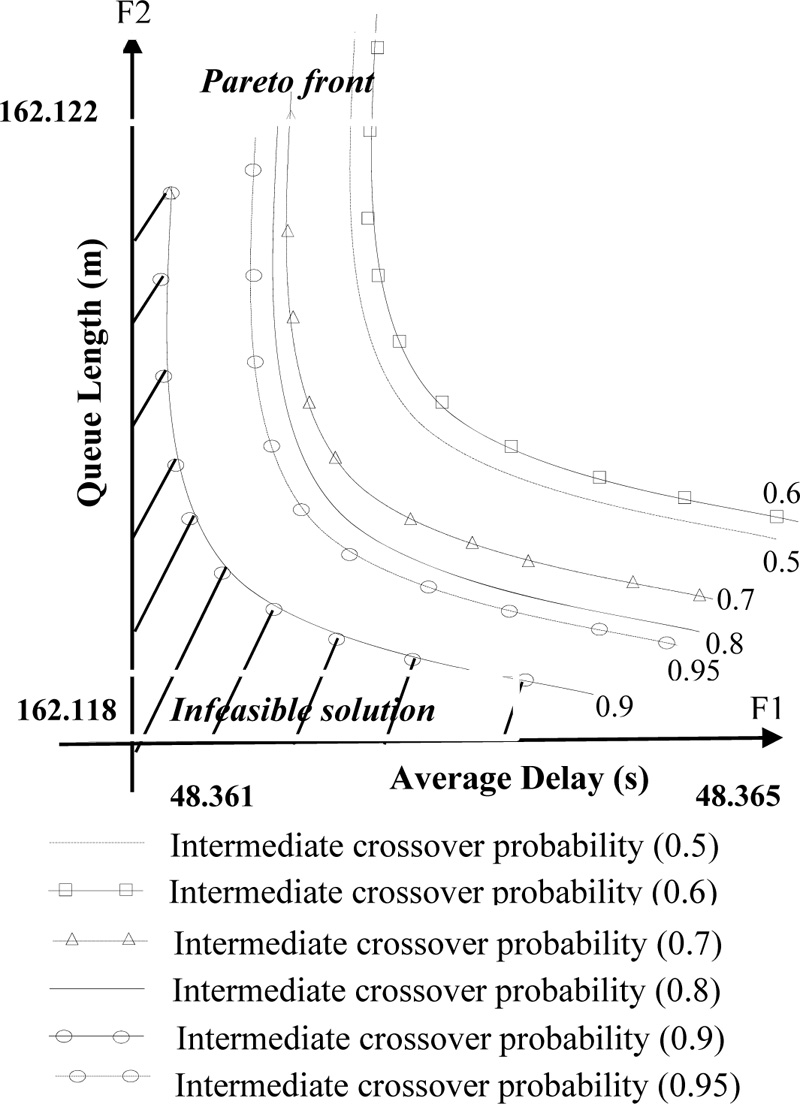
When changing the rate of crossover operator, the solutions of the fitness function switch along with the Pareto sets (Fig. 7). Nonetheless, the value of objective functions change slightly, for example, the queue length value is from 162.118 meters to 162.122 meters, the average delay is from 48.361 seconds to 48.365 seconds. This result shows that the MOGA and suitable constraints function could handle the multiple-choice solution problems of the stochastic method in traffic engineering by limitating the value of the objective function and finding approximate value for variables.
In this case study, the approximate value of queue length is 162.12 meters, and the average delay is 48.363 seconds when setting crossover probability as 0.5 in the model and the values of approximate variables have been defined as suggested traffic signal timing plan at Taiwan Blvd-Huichung Rd intersection by Table 3.
| Crossover Probability | Spread |
|---|---|
| 0.5 | 0.076 |
| 0.6 | 0.125 |
| 0.7 | 0.080 |
| 0.8 | 0.151 |
| 0.9 | 0.204 |
| 0.95 | 0.082 |
The comparison has been made between the Existing Traffic Signal Timing Plan (ETSTP) and the Suggested Traffic Signal Timing Plan (STSTP) for peak period from 7 am to 8 am at Taiwan Blvd-Huichung Rd intersection. Overall, the two compared performance measure factors have been shown in Table 3 for the average delay and queue length. The results illustrated that the STSTP showed improved efficiencies. Particularly, the average delay decreased slightly for a single-vehicle by 3.285 seconds, while the observed queue length of vehicles is reduced by 19.653 meters during the cycle time at the complex intersection. Compared to the ETSTP, the duration time of through movement and right-turns for effective green time phase T1 decreased by 12 seconds, T2’s observed duration is 11 seconds shorter, T4’s duration has changed by 8
| Parameter | Notation |
Existing Effective Green Time (s) |
Suggested Effective Green Time (s) | Changed By (s) |
|---|---|---|---|---|
| Phase (s) | T1 | 86 | 74 | -12 |
| T2 | 31 | 20 | -11 | |
| T3 | 31 | 44 | 13 | |
| T4 | 16 | 8 | -8 | |
| Cycle length (s) | C | 180 | 162 | -18 |
| Average delay (s) | AD | 51.648 | 48.363 | -3.285 |
| Queue Length (m) | QL | 181.773 | 162.120 | -19.653 |
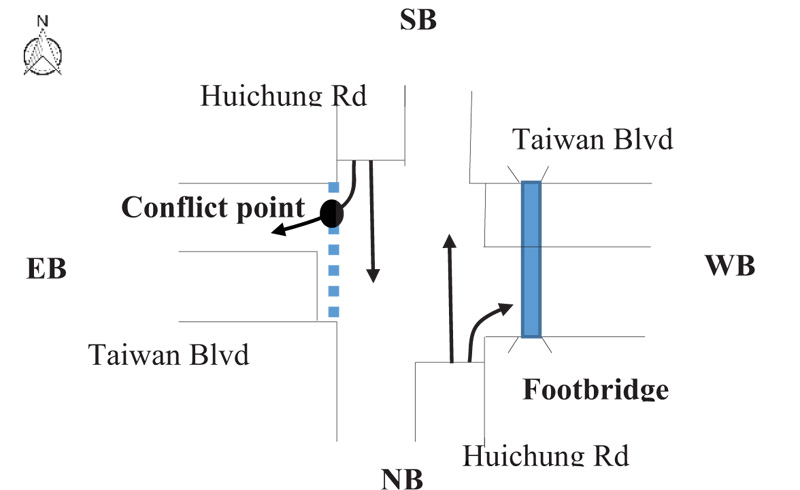
seconds shorter. Nevertheless, T3’s duration increased by 13 seconds to illustrate that this method is not only optimal for minimizing the queue length and average control delay, but also considers the safe pedestrian crossing at the urban intersection. Precisely, the width of Taiwan Blvd is 49.0 meters as measured by traffic geometry. The value of 6.1 pedestrians per cycle has been collected by video detector data. Then, the minimum effective green time of phase T3 (minimum T3 ≈ 44 seconds) is calculated by the formula (9) Fig. (8). The STSTP provided enough time for pedestrians to cross complex intersection safely as well as decreased one major conflict point between right-turns from Southbound (SB) to Eastbound (EB) and crossing pedestrians.
4.2. Validation Results
The performances of applying MOGA in traffic signal optimization have been indicated in this section by comparison between the results of SOGA and MOGA using the corresponding GA operator's factors, comparison results between the traditional solution and the suggested solution. Additionally, the validated results have been obtained by using the traffic simulation model.
4.2.1. SOGA Versus MOGA
The use of SOGA has been tested by multi-loop calculations (n times) to capture the mean values
 and Standard Deviations (SD) of xk factors, including effective green times, cycle times, and values of the fitness function by the followed expression.
 |
(26) |
 |
(27) |
As noted above, most of the suggested models in the literature reviews typically assumed the constraint functions for hypothetical models with a lack of theoretical bases. Basically, those models followed the formulae from (3) to (11), and not included the green time allocation condition (formula (12) to identify the constraints and limit the values of infeasible solutions. The application of those assumptions has been executed in this section using multi-runs n=30 to obtain the Table 4.
The outcomes in the table above showed that although the values of the queue length and average delay significantly improved and the approximate values of variables T1, T2, T3, T4 are 39s (or 40s), 11s, 44s, 5s, respectively. However, the above values of effective green times indicated an imbalance when allocating cycle time to phase T1 (major arterial road) with main traffic. Particularly, the duration time of phase T1= 39s (or 40s) was less than the duration time of phase T3 = 44s (at the minor road). Nevertheless, the SD values partially reflected the appropriate accuracy of this method after multi-runs. It means that the supposed model was stuck at local optimization values when only using the mentioned constraints following formulae from (3) to (11). Besides, the test results by traffic simulation software showed that the T1 value was unreasonable, resulting in an increase in average delay at the other adjacent intersections in Taiwan Boulevard. Therefore, it is necessary to re-check the constraints to improve the accuracy of those hypothetical models (Table 4).
Another comparison has been made between the use of SOGA and MOGA when utilizing constraints of allocated green times to minimize the time delay, and the queuing length for the main traffic flows in major and minor roads. The results performed that the application of SOGA is likely to be possible with suitable constraints demonstrated by improved values of SD and green time allocation to the major road. However, the outcomes of the MOGA are more convincing in optimizing traffic signals at a complex intersection. In particular, SOGA computation took a longer time by multi-loop calculation to catch the globally optimum values, while MOGA might obtain results via Pareto Front with appropriate constraint functions. The enhanced SD and fitness values (average delay, queue length) demonstrated the use of MOGA to be better than the use of SOGA in the practical analysis at Taiwan Blvd- Huichung Rd intersection (Table 5).
4.2.2. Webster’s Method Comparison
Webster’s formula is a well-known method to optimize the traffic control system for the timing plan at the intersection by the following equation.
 |
(28) |
Where, Copt is the optimization value of cycle length, L is as previously defined, ∑Yci is the total critical lane flow ratio.
Then, the effective green time (Ti) allocation for each phase calculated by the below equation.
 |
(29) |
The empirical result Table 6 showed that the optimal cycle length calculated by Webster’s formula (Copt= 153 seconds) is less than the MOGA’s optimistic cycle length (C=162 seconds).
| Use of the only Queue Length Function | Use of the only Average Delay Function | ||||
|---|---|---|---|---|---|
| Factors | Mean | SD | Factors | Mean | SD |
| T1 (s) | 39.263 | 2.811 | T1 | 40.745 | 3.266 |
| T2 (s) | 11.002 | 1.101 | T2 | 11.001 | 1.001 |
| T3 (s) | 44.277 | 1.395 | T3 | 44.002 | 1.002 |
| T4 (s) | 5.004 | 1.113 | T4 | 5.001 | 1.001 |
| C (s) | 115.546 | 3.005 | C | 116.748 | 3.266 |
| Queue length (m) | 122.250 | 2.621 | Average Delay (s) | 42.703 | 2.099 |
| Use of the only Queue Length Function | Use of the only Average Delay Function | MOGA | ||||||
|---|---|---|---|---|---|---|---|---|
| Factors | Mean | SD | Factors | Mean | SD | Factors | Mean | SD |
| T1 (s) | 74.144 | 0.002 | T1 | 74.188 | 0.002 | T1 | 74.088 | 0.001 |
| T2 (s) | 17.331 | 1.423 | T2 | 17.005 | 1.245 | T2 | 19.708 | 0.002 |
| T3 (s) | 44.033 | 0.002 | T3 | 44.059 | 0.002 | T3 | 44.000 | 0.001 |
| T4 (s) | 10.342 | 1.425 | T4 | 10.670 | 1.247 | T4 | 7.966 | 0.002 |
| C (s) | 161.886 | 0.002 | C | 161.982 | 0.003 | C | 161.763 | 0.001 |
| Queue Length (m) | 162.459 | 0.203 | Average Delay (s) | 48.571 | 0.050 | Queue Length (m) | 48.363 | 0.002 |
| - | - | - | - | - | - | Average Delay (s) | 162.120 | 0.002 |
| Phase | Movements | Flow Rate(vph) |
Saturation Flow Rates si (veh/h) |
ci(v/s) | Copt(s) | Effective Green Time (s) |
|---|---|---|---|---|---|---|
| T1 | EB-T | 2712 | 7600 | 0.357 | 153 | 60 |
| T2 | WB-L | 466 | 3800 | 0.123 | 21 | |
| T3 | SB-T | 583 | 1900 | 0.307 | 52 | |
| T4 | NB-L | 91 | 3800 | 0.024 | 4 | |
| SUM (v/s)ci | 0.810 | |||||
In spite of this, the STSTP demonstrated better effectiveness of effective green time allocation. Precisely, the Webster method just only considered the critical group traffic flow, ignored the time allocation for pedestrian safety and coordinated traffic network issue that suggested by Hao Wang's model [21]. The T4’s duration (T4= 4 seconds) is less than the minimum value of effective green time (T4 = 5 seconds) of the Northbound’s left turns vehicles (NB-L) based on the traffic network coordination problem defined by formula (10). Furthermore, the allocated T3’s duration of the Webster model of through movements on the Southbound (SB-T) is too long (T3 = 55 seconds) for a minor road as Huichung Rd.
In addition, the Webster model normally used the critical lane traffic flow to detect the traffic signal timing optimization result, while this study utilized the critical traffic flow for lane group as a basic unit to define the optimal traffic-timing plan. The use of traffic flow of the lane group at the intersection demonstrated efficiencies in various research, for instance, Chen Xiaoming et al. [35] suggested using lane group as the basic unit to analyze the signalized intersection's reliable capacity and/or DingXin Cheng et al. [36] regenerated the Webster's optimization cycle length based on lane group traffic flow and the average delay in highway capacity manual 2000 (HCM 2000).
4.2.3. Validated Optimization Result by the Traffic Simulation Model
The traffic signal timing plan for the intersection is defined by the following formula:
 |
(30) |
Where, Gi is the actual green time for phase i, Yi, Ari and TLi are the yellow time, all red time, and total loss time for phase i, respectively.
The current traffic signal timing plan at Taiwan Blvd - Huichung Rd intersection has been designed in Fig. (6). According to the above equation, the revised signal timing plan has been defined by Fig. (9) assuming that the amber time, all-red time, and turning diagram followed the previous signal timing design.
The compared traffic simulation models have been generated by the SUMO software and the Synchro software for both the Existing Traffic Simulation Model (ETSM) and the Suggested Traffic Simulation Model (STSM) from traffic geometry and current traffic patterns demand.
The outcomes of SUMO software clearly described the traffic situation for isolated intersection by various per-formance indexes. Furthermore, the Synchro software could investigate the effects of the suggested traffic signal timing plan on adjacent intersections of Taiwan Blvd- Huichung Rd intersection in a generated traffic network of Taichung city, Taiwan.
The comparison between the ETSM and the STSM during rush hour from 7 am to 8 am showed that the total max jam length of Taiwan Blvd-Huichung Rd intersection reduced 1611 meters. Additionally, the observed total time loss was 3272.8 seconds shorter between the ETSM and the STSM. The above results were recorded by the lane-area detector (E2) tool in SUMO software.

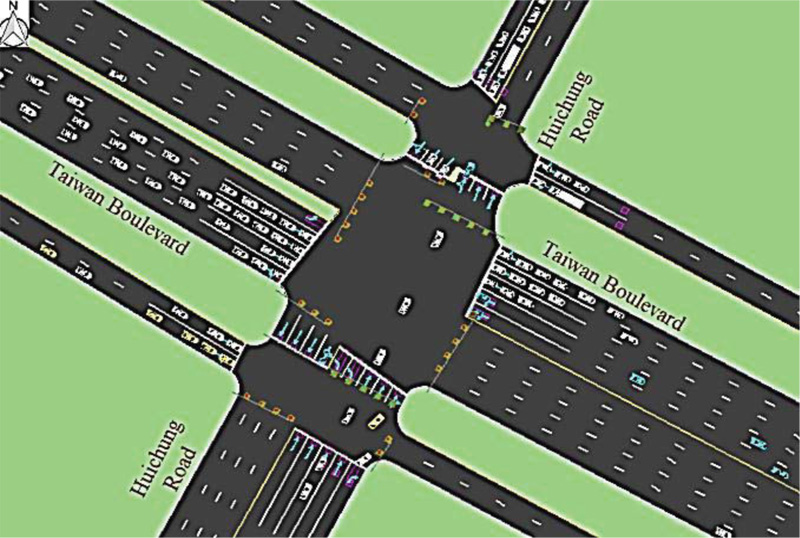
The exported results of Synchro software for the STSM showed that the adjacent intersection on the Southbound (the North approach) has change LOS (Level Of Service) from LOS C to LOS B by changing T3's duration that provided much time than the previous model for arriving vehicle passed through the Taiwan Blvd- Huichung Rd intersection. The LOS of the other adjacent intersections is still stable (Fig. 10).
CONCLUSION
This paper demonstrated the efficiencies of the MOGA's application in optimal traffic signal timing at a complex urban intersection. The empirical results showed that the SOGA could handle traffic signal timing optimization with appropriate constraint functions and GA's operators. On the other hand, MOGA is more efficient than SOGA to catch the global optimization values as well as to solve the multi-goals problem.
The methodology of this study overcame the disadvantages of previous studies to find global optimization values by establishing a suitable fitness function and identifying appropriate constraint functions. Furthermore, it provided a comprehensive solution in searching global optimistic results. The proposed solution was tested by the traditional method and a simulated model to validate the effectiveness.
The four-phase intersection has been adopted in this essay. The other cases could be done by applying the comprehensive solution as provided above.
Future work should take into consideration the other targets to generate feasible fitness function, for instance, maximum throughput vehicle function, maximum traffic capacity function, minimum cycle vehicle stops function, and minimum vehicle exhaust emissions function for different types of intersections.
CONSENT FOR PUBLICATION
Not applicable.
FUNDING
None.
AVAILABILITY OF DATA AND MATERIALS
Not applicable.
CONFLICT OF INTEREST
The authors declare no conflict of interest, financial or otherwise.
ACKNOWLEDGEMENTS
The authors are grateful to the PiTraffic Eng. Consultants Co., Ltd, for their support by providing valuable data of real traffic pattern demand after a long-time observation of the traffic situation at the Taiwan Boulevard- Huichung Road intersection in Taichung City, Taiwan


