All published articles of this journal are available on ScienceDirect.

Study of Online Taxi Choice Model in Indonesia
Abstract
Background:
Online taxis, a travel mode with personalized comfort based on mobile Internet technology, are now rapidly expanding in Indonesia.
Objectives:
This study aims to analyze the influence of the personal characteristics and travel characteristics on the choice of an online taxi or conventional taxi and to analyze the online taxi performance in the cities of Surabaya and Malang, Indonesia.
Methods:
A Stated Preference questionnaire was designed and a Google Forms survey was conducted to obtain data; 200 responses were collected. The binary logit model was employed to analyze the influence of the personal characteristics and travel characteristics on the choice modal. Importance-Performance Analysis was proposed to understand the performance of online taxis.
Results:
By applying the binary logit model, it was found that for variables based on a personal characteristic, age and occupation are the most influential variables that affect the decision to use an online-taxi, while for travel characteristic variables, travel cost is the most influential factor in traveler’s choice-making. According to the sensitivity analysis, the midpoint for travel cost was found to be Rp 9.606,20, and 13,43 minutes for pick up time. Through Importance-Performance Analysis, it was found that no attributes need to be improved.
Conclusion:
The estimated logit model can describe the personalized travel mode choice well. The users of an online taxi are people of young age and non-working group. If the gap price and the gap pick up time more than midpoint, the majority of travelers will most likely shift to conventional taxis. The online taxi performance has already met passenger satisfaction.
1. INTRODUCTION
Buses, conventional taxis, and other forms of road-based traditional public transportation are slowly beginning to lose market share to intermediate modes such as shared taxis [1]. The phenomenon of ridesharing has become a common one and based on ridesharing principles, the concept of cab-sharing or taxi-sharing was developed [2]. The development of technology, such as mobile phones and social networks, has enhanced and changed the perception of people regarding traditional ridesharing. Malang and Surabaya are major cities in Indonesia that are served by the online taxi company of Grab and the local ride service of Gojek. Ridesharing promises to increase reliability and reduce waiting time, which have affected the total travel time of point-to-point traveling. Many studies have been conducted regarding the issue of conventional taxis and online taxis. An innovative transportation concept has been developed, called Flexible Mobility on Demand (FMOD), which is a demand-responsive system providing personalized services to passengers or users [3]. A study regarding the use of online taxi services was conducted in China, and personalized travel choice between taxis and a “tailored taxi” called Didi was the concern of the study [2]. Another study conducted in San Francisco showed that ride-sourcing wait times were dramatically shorter than typical taxi dispatch and hail times, and thus ride-sourcing customers could expect a wait of ten minutes or less anytime and anywhere in the city; in contrast, taxi wait times varied considerably by time, day, and location and were notably longer in the city outside the neighborhoods [4].
Quantitative analysis of passenger preferences in the modal choice is important and beneficial since passenger preferences in the modal choice are themselves essential. Aside from passengers’ preferences, good service quality is the most important reason for people who are willing to use public transportation. A study on travel preference in the online taxi was conducted in Lebanon. The study used stated preference data and the model was applied to a case study of the students at the American University of Beirut in Lebanon [5]. Herman stated that service and performance influence Customer Satisfaction, with performance being a result of activities from a work plan. Service quality is influenced by perceived service and expected service. If the perceived service is less than the expected service, the customer will not be satisfied; but, on the other hand, if the perceived service is more than the expected service, the customer will be satisfied. Five dimensions build customer satisfaction, namely reliability, responsiveness, assurance, empathy, and tangibles [6].
This paper continues the study and deals with online taxi performance and the probability of the shifting of passengers from online taxis to conventional taxis, as observed in the cities of Malang and Surabaya. An online survey was performed to collect primary data. The Importance Performance Analysis was utilized to analyzing the online taxi performance based on the Ministry of Transportation Regulation No. 46 of the Year 2014 on the minimum service standards for road transportation with non-fixed routes. To develop the modal choice model, a Stated Preference (SP) questionnaire was developed to obtain the preferences of respondents, resulting in 200 responses. Meanwhile, the binary logit model was utilized to develop the modal choice between the conventional taxi and the online taxi based on price and waiting time.
2. MATERIALS AND METHODS
2.1. Study Location
A survey using Google Forms was conducted, and selected respondents were chosen from Surabaya city and Malang city in Indonesia. The selection of Surabaya and Malang as research locations was based on their unique characteristics. Surabaya is known as the capital of the Province of East Java and is a trading and industrial city. Malang is known as a city of education and recreation that requires safe and comfortable public transportation. Although the cities provide public transportation, its role has been decreasing. Instead, many people are switching to motorcycles or private cars.
2.2. Data Collection
To achieve the objectives, a literature study was conducted on the online taxi mode choice. Using stated preference technique, a questionnaire was designed to acquire data on travel preference. Then, the binary logit model was proposed to describe the preferences of passenger’s personalized travel behavior and Importance Performance Analysis was conducted to understand the performance of online taxis based on passenger perceptions. A survey using Google Forms was conducted for five weeks and 200 responses were collected.
The questionnaire included (a) personal profile information (age, gender, income, education, and occupation),
(b) Preference for choosing personalized travel mode (online taxi or conventional taxi), (c) the evaluation of action principle in choosing personalized travel mode (travel cost and pick up time). The respondents were selected randomly from Surabaya city and Malang city. The respondents must have had no more than two months of experience in using an online-taxi, be 15-65 years old, and have the online taxi mobile applications as well as experience in using the apps. The definition of variables on the scale is presented in Table 1.
| Variable | Definition | Note |
| X1 | Age | Traveler’s age |
| X2 | Gender | Traveler’s gender:1-male, 2-female |
| X3 | Income | Traveler’s household income, unit: million rupiahs per month |
| X4 | Education | Traveler’s education level:1(basic education) to 4 (post-graduate) |
| X5 | Occupation | Traveler’s occupation level: 1 (student and house-wife) to 2 (worker) |
| X6 | Taxi fare/Travel expenses | Travel expenses gap:1 (Online taxi cheaper than Conventional taxi Rp.15.000) to 7 (Online taxi more expensive Rp.15.000 than conventional taxi) |
| X7 | Pick up time | Pick up time gap: 1 (Online taxi comes 10 minutes early than a conventional taxi) to 5 (Online taxi comes 10 minutes late than conventional taxi) |
| Y | Travel choice | Travel by online taxi (represented by 1) or travel by conventional taxi (represented by 0) |
2.3. Analysis of Travel Choice between Conventional Taxis and Online Taxis
In this study, a conventional taxi refers to a road-based taxi that utilizes a taximeter (conventional taxi) and an online taxi refers to a taxi ordered by using electronic applications. Modal choice selection is one of the basic and important issues in transportation; the choice of traveling by either conventional taxi or online taxi is also associated with personal characteristics and travel characteristics.
The Stated Preference approach has been widely used in transportation, as well as in modal choice selection. This approach examines individual responses to a series of experimentally designed choice alternatives, which are typically described in terms of combinations of attributes with several predefined levels. Hensher used Stated Preference (SP) in his study to determine the value of time [7]. The Stated Preference approach offers the modal choices at once to respondents, then the respondents sort their choices to show the level of preferences of their choices.
To understand the modal choice, several formulas can be utilized. One of them is the logit model, which is used to forecast the probability of an event by fitting data. The decision of mode selection is influenced by individual and transit characteristics and it can be disclosed by using the binary logistic model [8]. Furthermore, a study regarding the adoption of on-demand ride services (Uber) was conducted in California. The study aimed to estimate binary logit models of the adoption of Uber/Lyft with and without the inclusion of attitudinal variables [9].
In this paper, the binary logit model is proposed to describe the preferences of passenger’s personalized travel behavior, whether travel fare and pick up time influencing the passenger’s decision to use online taxi or not, wherein passengers shift from online taxi to conventional taxi. The binary logit model was used because, in this paper, the dependent variable consists of only two categories, which are whether the passengers use the online taxi or any conventional taxi.
The result of personalized travel mode prediction is travel by either online taxi or conventional taxi. Below, xi refers to the ith passenger. Total prediction is the probability of the event (online taxi or conventional taxi). Assuming that n variables exist from x1, x2, … xn, the logit value of the unknown binomial probability is defined as the following linear function [2]:
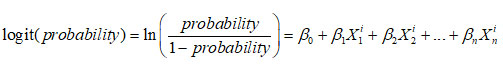 |
(1) |
The unknown parameter βk is estimated through maximum likelihood estimation, which characterizes the contribution that the kth variable makes to the logit probability value (k= 1, 2, … n), and β0 refers to an intercept. From Equation 2, Equation 3 is obtained as follows:
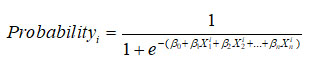 |
(2) |
Assuming that the utility function could be written as:
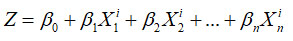 |
(3) |
Eq 2 could be formulated as logistic regression:
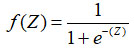 |
(4) |
Where f(z) Є (0,1) refers to the probability of an event.
2.4. Analysis of Online Taxi Performance
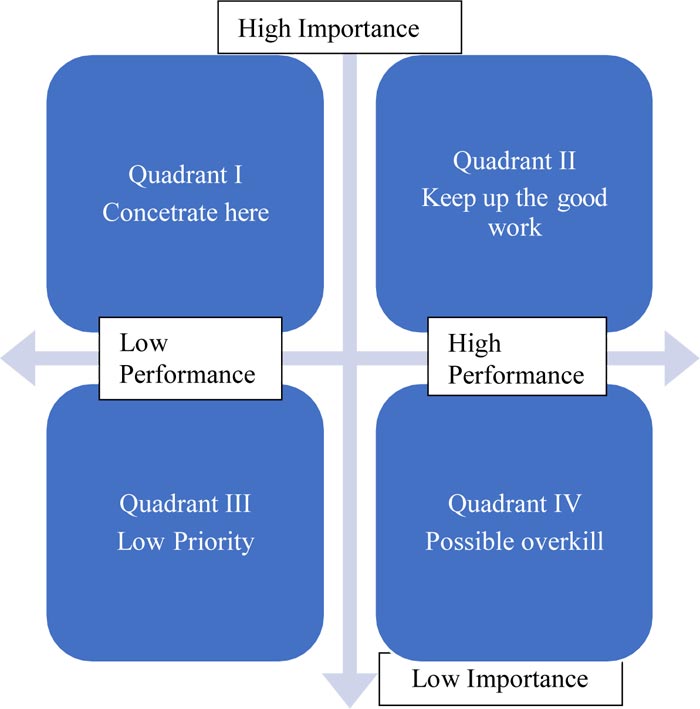
Importance-Performance Analysis (IPA) has been widely adopted in a variety of business sectors for understanding customer satisfaction, identifying areas for improvement, and prioritizing resource allocation [10]. Importance-Performance Analysis (IPA) measures perceived performance based on the importance of service with a two-dimensional plot [11]. A study to measure-out of the customer satisfaction factors in the online taxi mobile app service was performed by using Importance-Performance Analysis (IPA) [12]. Another study about the motorcycle taxi was conducted in Indonesia, Importance-Performance Analysis was applied and the results showed that better provision of trip rates has become a significant indicator for a business partner during the partnership process [13]. The data are presented in a matrix, with the X-axis and the Y-axis depicting attribute importance and attribute satisfaction or performance, respectively, with four quadrants based on their rankings. Attributes located in quadrant I have high importance but low performance, which warrants managers or stakeholders to concentrate their effort and resources on; quadrant II has attributes with both high importance and performance, which managers or stakeholders need to maintain good work on. Attributes in quadrant III have low importance and performance rankings and are of low priority for resource allocations; finally, attributes in quadrant IV have low importance but high performance and are thus possibly “overkill”, for which managers or stakeholders might direct their resources elsewhere [14]. Fig. (1) shows the Importance-Performance Analysis (IPA) matrix [11].
Based on the Ministry of Transportation Regulation No. 46 of the year 2014 on the minimum service standards for road transportation with non-fixed routes, the attributes for the study were developed. The list of research attributes is shown in Table 2.
| Code | Attribute |
| WF1 | Vehicle age of fewer than ten years |
| WF2 | The vehicle always in clean condition and free from foul odors |
| WF3 | Placement of a sticker that contains a hotline number for complaints |
| WF4 | Placement of driver identity on the dashboard, identical to the mobile app |
| WF5 | Window glass tinting of less than 40% |
| WF6 | Air conditioner (AC) running well |
| WF7 | Availability of luggage storage |
| WF8 | Availability of visibility and audibility |
| WF9 | Placement of “No smoking” sticker in car interior |
| K1 | Availability of a hotline number that users can contact for complaints or criticism |
| K2 | Availability of chat feature with the driver |
| K3 | Online taxi application always running well |
| DT1 | Quick response from the application to facilitate users to order vehicles |
| DT2 | Driver mastery of trip routes and alternative routes |
| J1 | Service delivery by the driver for the agreed-upon route |
| J2 | Provision of accident insurance |
| J3 | Availability of payment alternatives (cash or non-cash) |
| J4 | Fixed prices, as stated in the application |
| J5 | Promotions or other free services |
| J6 | Regulation on the maximum number of passengers |
| J7 | Pick-up time corresponding to the application |
| E1 | Facilities for the disabled, elderly people, pregnant women, and infants in vehicles |
| E2 | Drivers who obey traffic laws and communicate well with passengers |
3. RESULTS
3.1. Respondent Characteristics
The detail of respondents’ characteristics for this study is shown in Table 3.
3.2. Model Estimation and Validation
3.2.1. Estimating Model Coefficient
In this paper, two personalized travel modes are considered, including taxi or tailored taxi. The parameters for the explanatory variables are estimated in each utility function by fitting the models to the observed choice outcomes. Maximum likelihood estimation and Wald-test are adopted in this procedure. Explanatory variables significantly influence the preference to choose online taxi if the p-value is less than α = 0.05 (p<0.05). The estimated model coefficient for the Binary Logit model is presented in Table 4 and the coefficient estimation for the valid explanatory variables is also shown in Table 5. From Table 5, it is evident that the variable age (X1) and variable occupation (X5) significantly influence the online taxi preference. The young age traveler and users in the student and house-wife group prefer to use an online-taxi. Furthermore, Table 4 also shows research variables based on personal characteristics namely variable gender (X2), variable income (X3), variable education (X4), variable travel fare (X6), and variable pick up time (X7), excluding some variables due to the p-value > 0.05.
| Demographic Variables | Number of People | Percentage(%) | |
| Gender | Male | 81 | 40,5 |
| Female | 119 | 59,5 | |
| Age | 15 – 22 years old | 96 | 48,0 |
| 23 – 45 years old | 90 | 45,0 | |
| 46 – 54 years old | 11 | 5,5 | |
| 55 – 64 years old | 3 | 1,5 | |
| Occupation | High-school students | 65 | 32,5 |
| University students | 53 | 26,5 | |
| Private employees | 32 | 16,0 | |
| Civil servants | 1 | 0,5 | |
| Entrepreneurs | 14 | 7,0 | |
| Teachers/lecturers/others | 15 | 7,5 | |
| Housewives | 20 | 10 | |
| Income/ Pocket Money | < Rp. 1,000,000 | 86 | 43,0 |
| Rp. 1,000,000-2,999,999 | 46 | 23,0 | |
| Rp. 3,000,000-4,999,999 | 43 | 21,5 | |
| >Rp. 5,000,000 | 25 | 12,5 | |
| Main Purpose of Traveling | Work | 19 | 9,5 |
| Studies | 74 | 37,0 | |
| Shopping | 19 | 9,5 | |
| Family | 56 | 28,0 | |
| Recreation | 27 | 13,5 | |
| Health | 5 | 2,5 | |
| Variable | Beta | S.E | Wald-test | P-value |
| Constant | 9,254 | 1,952 | 22,487 | 0,000 |
| X1 | -2,125 | 0,536 | 15,700 | 0,000 |
| X2 | -0,313 | 0,526 | 0,354 | 0,552 |
| X3 | 0,712 | 0,371 | 3,694 | 0,055 |
| X4 | -0,492 | 0,340 | 2,089 | 0,148 |
| X5 | -1,700 | 0,676 | 6,321 | 0,012 |
| X6 | -0,382 | 0,417 | 0,840 | 0,359 |
| X7 | 0,158 | 0,453 | 0,121 | 0,728 |
| Variable | Beta | S.E | Wald-test | P-value |
| Constant | 7,180 | 1,183 | 36,821 | 0,000 |
| X1 | -1,750 | 0,455 | 14,809 | 0,000 |
| X5 | 11,234 | 0,560 | 4,854 | 0,028 |
| Preference | Observed | Predicted | AUC (p-value) | PPV (%) | NPV (%) |
| Conventional Taxi | 25 | 12 | 0,671 | 98,3 | 36 |
| Online-Taxi | 175 | 188 | (0,006) |
| Quadrant | Attributes | |
| Quadrant I (need improvement) |
- | |
| Quadrant II (keep up the good work) |
The vehicle always in clean condition and free from foul odors (WF2) | |
| Air conditioner (AC) running well (WF6) | ||
| Availability of luggage storage (WF7) | ||
| Online taxi application always running well (K3) | ||
| Quick response from the application to facilitate users to order vehicles (DT1) |
||
| Driver mastery of trip routes and alternative routes (DT2) | ||
| - | Service delivery by the driver for the agreed-upon route (J1) | |
| Availability of payment alternatives (cash or non-cash) (J3) | ||
| Fixed prices, as stated in the application (J4) | ||
| - | Promotions or other free services (J5) | |
| - | Drivers who obey traffic laws and communicate well with passengers (E2) | |
| Quadrant III (low priority) | Placement of a sticker that contains a hotline number for complaints (WF3) | |
| Placement of driver identity on the dashboard (WF4) | ||
| - | Availability of visibility and audibility (WF8) | |
| Availability of a hotline number for complaints (K1) | ||
| Provision of accident insurance (J2) | ||
| - | Facilities for the disabled, elderly people, or infants in vehicles (E1) | |
| Quadrant IV (possible overkill) | Vehicle age of fewer than ten years (WF1) | |
| Window glass tinting of less than 40% (WF5) | ||
| - | Availability of chat feature with driver (K2) | |
| Regulation on the maximum number of passengers (J6) | ||
| Pick-up time corresponding to the application (J7) | ||
3.2.2. Validating Model Credibility
Validating model credibility was performed to compare the predicted value with the observed value of the traveler preference value. The result of validating model credibility is shown in Table 6.
3.3. Online Taxi Performance
After the data from the questionnaire were collected, the online taxi performance analysis was carried out with Importance-Performance Analysis, and the results are shown in Table 7.
4. DISCUSSION
A survey using Google Forms was conducted and 200 responses were collected. The survey indicated that the respondents were predominantly female and between 15-22 years old, having the status of high-school students, and income or pocket money < Rp. 1,000,000.00. Their main purpose of using online taxis was for study activities like going to campus and for group study activity. This paper found that young millennials, high-school students, and university students are more likely to use an online-taxi. It is contradictive with the study conducted by Alemi et al. in California. Alemi et al. found that respondents were highly educated, and older millennials were more likely to use on-demand ride services than other groups [9].
This study aims to analyze the influence of personal characteristics and trip characteristics on the choice of an online taxi or conventional taxi. The sensitivity analysis was performed using the proposed model and analyzing online taxi performance by employing Importance-Performance (IPA) analysis. The analyses discussed below are important to understand the personalized travel mode choice of the traveler.
4.1. The Effect of Travel Cost
To evaluate the influence of travel expense and pickup time, in this study, selection ratios of the conventional taxi and the online taxi were evaluated with the binary logit model. The results for travel cost analysis are shown in Fig. (2).
Fig. (2) indicates that with the increase of online taxi travel costs, the selection of the ratio of online taxi decreases, while that of the conventional taxi increases. When the travel cost of an online taxi is cheaper (Rp.15.000) than a conventional taxi, the probability to use an online taxi is 0.902 (90.2%) but the point at which the travel cost of an online taxi is exactly the same as the conventional taxi, the probability to use the online taxi decreases to 0.704 (70.4%). A midpoint travel cost between online taxis and conventional taxis is Rp. 9.606,20. It is shown that the maximum price gap between an online taxi and conventional taxi is Rp.9.606,20. If the travel cost of online taxis is more expensive by Rp. 9.606,20 than conventional taxis, passengers would prefer using conventional taxis and the probability to use conventional taxis significantly increases. The result shows that online taxi fare is a sensitive variable that determines the decision of the passengers whether to use an online taxi or conventional taxi. The travel fare is a sensitive variable for the passengers, and the traveler’s willingness to pay the maximum price gap is Rp.9.606,20. This is because the majority of respondents are the group of people, mainly students, with a median income that they receive from their parents of less than Rp. 1.000.000,00/month (one million rupiahs per month) including the high-school students (32.5%) and university students (26.5%), therefore the budget for the travel expense is limited.
4.2. The Effect of Pick Up Time
Modal choice probability based on pick up time is an analysis same as the method of modal choice probability based on travel cost. The results of the analysis for modal choice based on pick-up time are shown in Fig. (3).


As shown in Fig. (3), when passengers care more about pick-up time, the selection ratio of online taxi increases. The midpoint pick-up time of online taxis and conventional taxis is not visible in Fig. (3), because the analysis using the binary logit model showed that the midpoint for pick-up time is 13.43 minutes, but the offered choices for pick-up time to respondents were only from 0-10 minutes. If the pick-up times of online taxis are 13.43 minutes longer than conventional taxis, the probability to choose conventional taxis increases, and passengers would prefer to use conventional taxis than online taxis. A more positive difference in pick up times leads to shorter pick-up times and a greater probability to choose online taxis; consequently, the probability to choose conventional taxis significantly decreases. The research result shows that for passenger willing to wait for the online taxi little longer, more than 10 minutes offered as maximum pick-up time in the questionnaire sheet, it is because the main purpose of traveling by online taxi is for study purposes like going to campus or study group, and they have enough spare time to wait little longer but not more than 13.43 minutes.
4.3. Online Taxi Performance
The performance of online taxi was analyzed by Importance-Performance Analysis, and the attributes were identified as being in quadrant I (needs improvement), quadrant II (keep up the good work), quadrant III (low priority), or quadrant IV (possible overkill). The results showed that all attributes met passengers’ expectations of online taxi performance and the passengers were satisfied. This is proven with no attributes found in quadrant I that need improvements. Attributes in quadrant III are of low priority because these do not significantly influence the respondents’ perception of online taxi performance. Furthermore, attributes in quadrant IV are possible overkill attributes, as these attributes do not significantly influence the respondents' perception about online taxi performance but the online taxi still provided these attributes. To maintain this performance, stakeholders need to pay attention to improve attributes in quadrant II, which contains attributes that need to be focused to have continued good work. They must improve the quality of attributes in quadrant II and reduce the effort for attributes in quadrant III and quadrant IV.
CONCLUSION
This paper examined the personalized travel mode. A binary logit model was used to describe the choice of traveling by online taxi or conventional taxi. How the influential factors affect the personalized travel mode choice was revealed by the sensitivity analysis. The following conclusions are drawn based on the results:
- The estimated logit model can describe the personalized travel mode choice well.
- The most influential personal characteristic factor in making a decision to travel by taxi or tailored taxi is age and travel cost is the most influential factor in traveler’s choice making.
-
-The result from the sensitivity analysis shows that the maximum price gap between an online taxi and conventional taxi is Rp.9.606,20, and the maximum pick up time gap is 13.43 minutes. With more than Rp.9.606,20 for travel fare and more than 13.43 minutes for pick up time, the majority of travelers (more than 50%) will most likely shift to conventional taxis. Therefore, the successful operation of an online taxi service in the future warrants the assurance that the online taxi must pay more attention to the pricing and pick up time practice.
-
- The results indicate that the young age traveler and the non-working group user prefer to use an online-taxi.
- The online taxi performance has already met passenger satisfaction. No attribute based on the Ministry of Transportation Regulation No. 46 of the Year 2014 on the minimum service standards for road transportation with non-fixed routes needs to be improved.
The findings from paper are expected to help understand traveler’s choice of personalized travel mode. As the travel expenses and pick-up times simultaneously and significantly influence and contribute to the difference in utility between online taxis and conventional taxis by only 37.8% and 25.7%, respectively, further research is needed on other variables that may also influence the utility between online taxis or conventional taxis.
CONSENT FOR PUBLICATION
Not applicable.
AVAILABILITY OF DATA AND MATERIALS
The data supporting the findings of this article are available within the article.
FUNDING
This study was funded by the Indonesia Endowment Fund for Education (LPDP). The grant code number is 20161141011790.
CONFLICT OF INTEREST
The authors declare no conflict of interest, financial or otherwise.
ACKNOWLEDGEMENTS
The manuscript describes original work and is not under consideration by any other journal. All authors have approved the manuscript and this submission.

