All published articles of this journal are available on ScienceDirect.
Properties of Sustainable Concrete with Mussel Shell Waste Powder
Abstract
Background:
The management of marine waste is a major concern in several countries. Recycling shell waste in concrete formulations may be one of the alternatives for producing sustainable materials at a lower cost.
Objective:
In this research paper, the performance of ground mussel waste for non-structural concrete formulation has been investigated.
Methods:
Two alternatives were explored in this research. The first aimed at incorporating treated Mussel Powder (MP) for partial substitution of cement (6, 12, and 24% by weight). The second aimed to investigate the feasibility of using MP as an additive with a proportion of 3, 6, 9 and 12% by weight of cement. Physico-mechanical properties of advanced composites have been studied in both fresh and hardened state through several laboratory tests.
Results:
The test results indicated that the inclusion of the MP allowed the formulation of concretes with normal density and lower air content. The mechanical behavior was characterized using new formulas adapted to the newly formulated concretes. Based on the obtained results, the treated MP could be used as a cement substitute with a proportion up to 12% or as a mineral additive with a percentage of 3% to produce a non-structural concrete that meets the normative requirements in terms of compressive and tensile strength.
Conclusion:
The recycling of mussel waste in concrete will contribute to the preservation of the environment by reducing the quantity of shellfish waste. The concept of “green” concrete can be achieved through the use of the formulated concretes in the paving works or as a blinding concrete.
1. INTRODUCTION
World population growth has intensified construction activities. These constructions mainly use concrete material. Due to its undeniable physical and mechanical properties, this material had a significant expansion. Concrete is ranked second among the most widely used materials on planet earth. According to statistics, more than 26 Gt of concrete is annually produced [1]. This huge quantity of concrete consumes more than 19 Gt of aggregates and ~2 Gt of fresh water [1, 2]. This substantial worldwide consumption is contributing to the depletion of aggregate and water resources. Thus, organizations have warned about the risk of depletion of these natural resources [3].
The concrete industry is one of the leading causes of pollution. Cement production is an essential source of greenhouse gases, such as CO2. According to recent studies, the production of Portland cement is around 4.1 Gt/year, which is directly responsible for ~9% of global anthropogenic CO2 [4, 5]. The production of 1 ton of cement releases approximately 1 ton of CO2 due to the calcination of the limestone as well as the combustion of fuel. A 50% increase in annual cement production is expected by 2050 [5, 6].
It is, therefore, necessary to research new methods to reduce the environmental impact of the concrete industry. Researchers investigated the feasibility of using several types of wastes as a substitute for conventional aggregates or as cementitious materials in concrete design. The researchers studied the effect of agricultural waste in ash forms such as bamboo and date palm or fiber form such as barley and wheat straw on concrete properties. Besides, demolition waste is an important source of aggregates [7]. Other construction wastes have been used for concrete mix design, such as glass [8], plastic [9], etc.
Seashell wastes can be recycled to substitute concrete components. Shells represent about 33% of the total mass of mussel shells [10]. A large quantity of waste will thus be generated, creating waste management problems for local communities. Seashell waste is a severe environmental problem in several countries, such as New Zealand [11]. With the worldwide development of aquaculture, this problem has become more pronounced. Millions of tons are produced every year through bivalve aquaculture [12]. These wastes have a significant potential to be explored. They are recovered in several fields such as agriculture as a fertilizer or as a soil conditioner [11] and in fine chemistry [13].
As a developing country, Morocco was not far from this global situation. Mussel shells are collected and mainly processed using traditional methods [14]. A huge amount of shellfish waste is dumped untreated into the natural environment. Hazardous odors, marine environmental pollution, and infectious disease risks are among examples of the negative impacts of these wastes.
In this work, treated mussel powder is used both as a cement substitute and as a filler material for the formulation of non-structural concrete. The newly formulated composite can be applied in structures where high strength concrete is not required. Indeed, this type of concrete can be used as a strengthening and infill material for confined beams [15]. Another potential application of this composite is the rehabilitation of deteriorated columns to prolong their service life [16]. This material is also suitable for use in the paving works or as a blinding concrete.
2. LITERATURE REVIEW
Shell by-products are used in concrete and mortar design as a way of recycling these wastes. Researchers have explored the feasibility of using shell by-products as partial or total substitutes for the various concrete components. Scientific works are distinguished in terms of the type of incorporated shells and the substituted component (cement or aggregates). Examples include oysters [17-20], cockles [21-23], scallops [24, 25], periwinkles [26-28], mussels [8, 10], [29-31].
Most studies have noted a decrease in compressive strength as the substitution rate of aggregates or cement increases [32]. The increase of the specific area of aggregates and their weak bonding reflected by high porosity in the interfacial zone contribute to the decrease in strength. Therefore, the substitution rate should be limited to avoid an excessive reduction in this property. The optimal substitution rate differs from research to others. According to Othman et al. [22], cement substitution by powdered cockles should be limited to 15%. Yang et al. reported that fine aggregates substitution with oyster shell waste yielded satisfactory results for up to 20% substitution rates [33]. Martínez-García et al. recommended substitution rates of less than 25% for structural or non-structural concretes [10].
Mussel waste aggregates are characterized by smooth surfaces and thin elongated shapes, which weaken the cement aggregate bond [10]. Consequently, mussel aggregates will have lower strength compared to natural aggregates. Therefore, it would be useful to use mussel waste in powder form to improve the compactness of the concrete.
In this regard, we focused our study on the effect of MP additives on the physical and mechanical properties of non-structural concrete. The novelty in this work consists of the following points. First of all, the effect of the incorporation of the treated MP as a cement substitute or as a filler material additive in concrete has not been previously studied in the literature. Furthermore, this paper thoroughly characterizes the behavior of the formulated mussel composites. Moreover, this work provides a comparative study between the incorporation of the treated MP as a cement substitute and as a mineral additive in concrete. The used incorporation rates are carefully chosen to respect the optimal rates recommended in previous researches. The MP has been incorporated at a rate of 6,12 and 24% as a cement substitute and 3,6,9 and 12% as a mineral additive.
3. MATERIALS AND METHODS
3.1. Materials
3.1.1. Cement And Aggregates
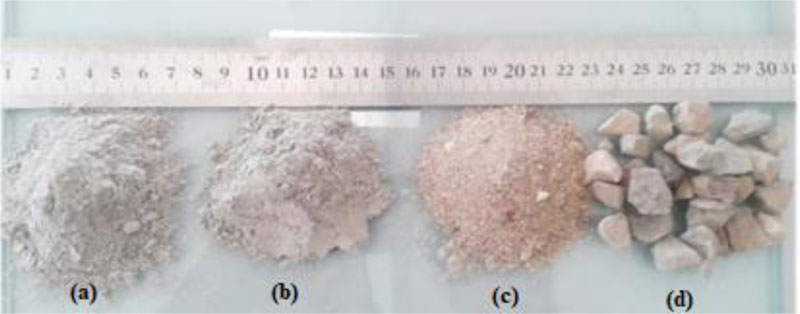
The common materials used in the formulation of ordinary concrete are cement and aggregates. Fig. (1) illustrates all components used in the concrete formulation. The used cement is a Portland cement CPJ 45 manufactured according to Moroccan standard NM 10.1.004 by Moroccan Cement.
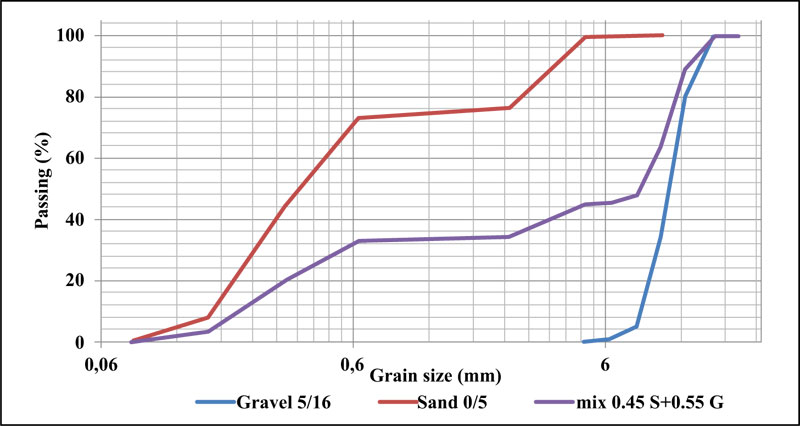
Table 1 shows the physical properties of aggregates. River sand is used with a maximum particle size of 5mm prepared by a combination of two types of sand, 0/2.5mm and 2.5/5mm, with a proportion of 75% and 25%, respectively. The obtained sand has a specific gravity of 2.5 g/cm3 and a fineness modulus of 2.26. Crushed gravel is used with a 5/16 mm size and a specific gravity of 2.73 g/cm3. The particle size distribution of aggregates is given in Fig. (2).
3.1.2. Mussel Powder
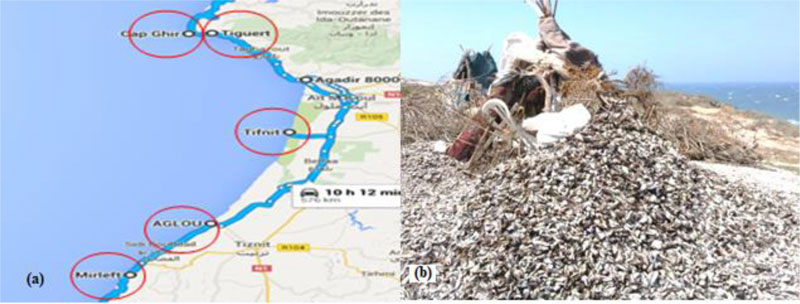
Mussel shells are collected from the Cap Ghir site at 20 km from Agadir city, Morocco (Fig. 3a). Agadir region hosts several gathering points of mussel shells that are sold locally. Local people discard waste without treatment, creating environmental problems (Fig. 3b).
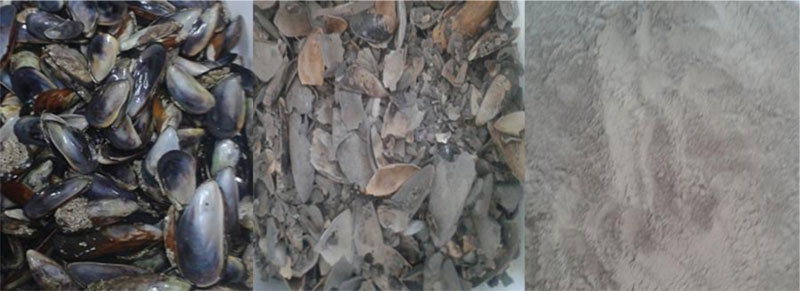
Collected shells were boiled at high temperatures to allow the opening of the valves and the extraction of the meat. The shells are then washed with water mixed with detergents. This treatment removes the organic matter from the shell and reduces the chloride and sulfide content. The mussel shells are then air-dried and taken to a traditional lime production site in Agadir. Mussel shell waste is then thermally calcined in the traditional vertical furnace at a temperature of around 800°C for 6 hours. Calcined shells are finely crushed in a mechanical mill and sieved at 0.08 μm sieve (Fig. 4).
Barbachi et al. investigated the chemical composition of mussel waste used in this study [34]. It was found that mussel waste is mainly composed of calcium carbonates in a proportion of 94%. Chloride and sulfide contents meet standard requirements. These findings are confirmed by several scientific research studies [10, 35, 36].
Martínez-García et al. widely studied the microstructure of the mussel shells. It is made of three layers: the outer, the medium, and the inner layer [10]. The first is composed of conchin protein, the second is mainly composed of calcite prisms and the last is composed of laminar aragonite. Mussel shell aggregates are considered safe and non-hazardous material [10].
3.2. Mix Design
A concrete mix design was carried out in the application of the Dreux Gorisse method. The aim was to prepare a non-structural concrete with a target strength of 20 MPa and with plastic consistency. The adopted W/C ratio is 0.61. The reference curve was drawn to determine the optimal percentage of sand and gravel, which was 45 and 55%, respectively. The obtained G/S ratio is 1.22. The particle distribution curve of the resulting aggregates mixture is shown in Fig. (2).
Two types of mixes were prepared. The first one, called “Mussel Concrete” (MC), is formulated by mass substitution of cement by MP at a rate of 6-12 and 24%. The specimens will be noted MC6, MC12, and MC24, respectively. The second mixture is called “Mussel Filler Concrete” (MFC). It is formulated with MP as a filler material with 3-6-9 and 12% by weight of cement. The adopted W/(C+Filler) ratio was 0.61. Specimens are noted MFC3, MFC6, MFC9, and MFC12, respectively. The reference concrete (Ref), the MC and the MFC composites formulations are shown in Table 2.
| Parameter | Gravel 5/16 | Sand 0/5 | Mussel Powder |
|---|---|---|---|
| Size (mm) | 5/16 | 0/5 | <0.08 |
| Uniformity coefficient | 1.2 | 3.35 | -- |
| Curvature coefficient | 1.15 | 0.7 | -- |
| Bulk density | 1.38 | 1.32 | 1.01 |
| Specific gravity | 2.73 | 2.5 | 2.02 |
| Fineness modulus | -- | 2.26 | -- |
| Specimen | Cement | MP | Water | Gravel 5/16 | Sand 0/5 | W/C | W/(C+F) |
|---|---|---|---|---|---|---|---|
| Ref | 312 | 0 | 190 | 1080.3 | 809.45 | 0.61 | ** |
| MC6 | 293.28 | 18.72 | |||||
| MC12 | 274.56 | 37.44 | |||||
| MC24 | 237.12 | 74.88 | |||||
| MFC3 | 312 | 9.36 | 195.95 | 1080.3 | 809.45 | ** | 0.61 |
| MFC6 | 18.72 | 201.66 | |||||
| MFC9 | 28.08 | 207.37 | |||||
| MFC12 | 37.44 | 213.07 |
3.3. Preparation and Modeling
The preparation of the mixtures was carried out in the ENSA laboratory. Firstly, the aggregates, cement, and MP were mixed. The water was then gradually added while mixing. The mixing operation is continued up to homogenization.
The sampling is carried out according to EN 12350-1 standard [37]. The filling of cylinder molds was carried out in three layers with manual tamping using a tamping rod. Each layer of concrete was tamped 25 times to eliminate air bubbles. Demolding is carried out after 24 hours. The specimens were kept in a water container until the day of the test, as required by the standard EN 12390-2 [38] (Fig. 5).
3.4. Test Program
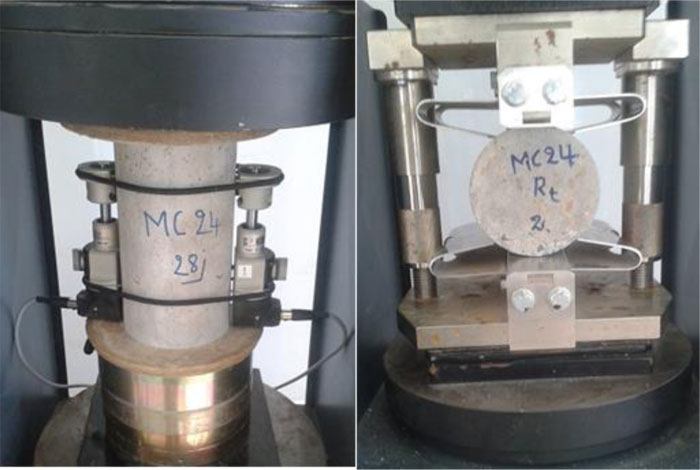
Table 3 shows the list of performed tests and standards used in this study. Cylindrical specimens of 100*200 mm2 are used to perform all mechanical tests. The adopted loading speed was 0.4 MPa/s for the compression test and 0.04 MPa/s for the splitting tensile test. Fig. (6) shows an example of the mechanical tests performed in this study.

4. RESULTS AND DISCUSSION
4.1. Fresh and Hardened Density
Fig. (7) shows the fresh and hardened densities of the different mixes formulated based on MP.
For MC mixtures, there is a decrease in fresh density as the substitution rate increases. A decrease of about 2% is noted for MC24. The lower density of the MP compared with cement explains this result (Table 1). An opposite trend is observed for MFC mixes. An increase in density is noted with the increasing rate of additions. This result is evident because the MP serves as filler within the concrete, increasing the density of the mix. As the densities are higher than 2000 Kg/m3, the formulated mixes are classified as ordinary concretes.
The hardened density follows the same trend as in the fresh state. A decrease of about 1% is noted for the MC24 mixture compared to a non-significant decrease for the MFC mixtures. All the mixes remain within the range of ordinary concretes. The same finding was reported by several authors [10, 45, 46].
4.2. Air Content
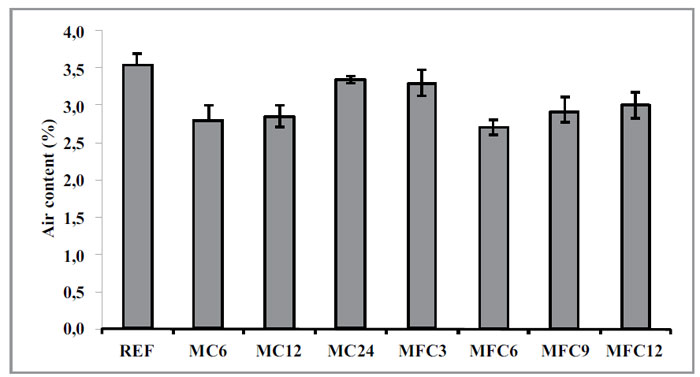
The air content was determined using the pressure method according to the EN 12350-7 standard [40]. Fig. (8) shows the air content in percentage for MC and MFC mixtures.
The air content is closely related to the presence of voids within the sample. The obtained results show a downward trend in the air content as the substitution rate increases. The reduction in air content ranges from 6 to 24%, with maximum compactness for MC6 and MFC6 mixtures. This result is explained by a filler effect of the MP, which improves the compactness of the mixtures. This filler fills more intergranular voids. As a result, the air content is reduced. According to literature, the use of seashell waste as an aggregate did not lead to the same effect. The incorporation of queen scallop as an aggregate in concrete up to 60% increased the air content from 1% to 5.8% [24].
4.3. Compressive Strength
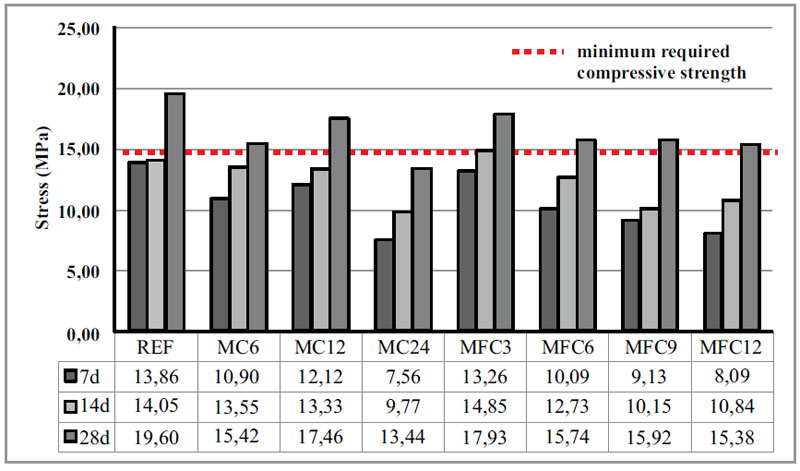
The compressive strength has been determined, according to EN 12390-3 standard [42]. Samples are removed from the storage tank on the day of the test. The compressive strength averages at 7, 14, and 28 days are shown in Fig. (9). Each value is the average of three tests.
As expected, there is an increase in compressive strength with the sample age. The average strength of the reference concrete achieved the target strength in the formulation process (≈20 MPA). A decrease in compressive strength is noted for the MC and MFC mixes compared to the reference concrete. Nevertheless, the majority of mixes have achieved the minimum required strength for non-structural concrete (about 15MPa) except for the MC24 mix.
For MC mixes, the compressive strength reduction is in the range of 10 to 31%, corresponding to a strength of 17.46 MPa for MC 12 and 13.44 MPa for MC24. The optimal substitution rate is 12%, corresponding to a reduction in compressive strength of about 10%. These results can be explained by the fact that the high cement substitution rates reduce the amount of cement paste required for aggregate cement bond. Replacing cement at rates below 12% gives a better packing of particles that reduce the internal pores. The filler effect of MP helps to slightly compensate for the decrease in cement amount.
In the case of MFC mixes, the reduction in compressive strength is between 8% for MFC 3 and 21% for MFC12. A significant decrease was noted when MP additions exceeded 3%. With high addition rates, the percentage of aggregates, including MP, is increased and more cement is required to achieve a similar resistance to the reference. Besides, the amount of water added to maintain the W/(C+Filler) ratio equal to 0.61 has increased the W/C ratio, which has contributed to the reduction of the compressive strength. Therefore, it is recommended to keep MP additions below 3% to avoid a considerable drop in compressive strength.
The performance of concrete prepared with MP is of interest compared to the results obtained by several researchers. Martinez et al. [10] studied the feasibility of substituting coarse and fine aggregates with mussel shell aggregates for structural and non-structural concrete formulations. They reported a decrease in the compressive strength of non-structural concrete by 18% to 32% for optimal rates of substitution. The work carried out by Lertwattanaruk et al. showed an optimal decrease of 26% for a cement substitution of 5% by shell powder [35].

4.4. Modulus of Elasticity
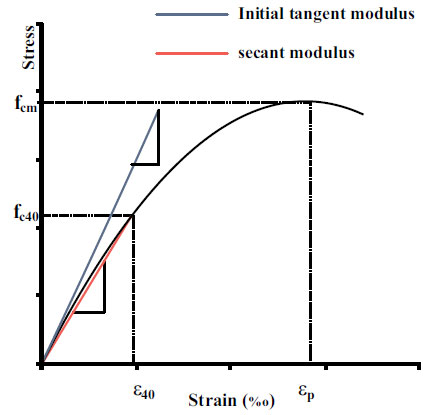
The modulus of elasticity (Ec) was determined based on the stress-strain curves obtained through the 28-day compressive strength test. Strain extensometers have been used to determine the axial deformation of the specimen (Fig. 6). The initial reference length (L0 ) was set at 100 mm. The strain is calculated using Eq. 1. The stress-strain curve of concrete is not linear. Thus, the modulus of elasticity of the composite changes from point to point. It is determined using two methods: the static modulus Ec and the dynamic modulus Ed [47]. The static modulus was adopted to estimate the modulus of elasticity according to the method described in Eurocode 2 and used in the subsequent studies [48-50]. The modulus of elasticity (Ec) corresponds to the secant modulus at 40% of the maximum stress (fc40), as shown in Fig. (10). Thus, the modulus Ec is calculated using Eq. 2.
 |
(1) |
 |
(2) |
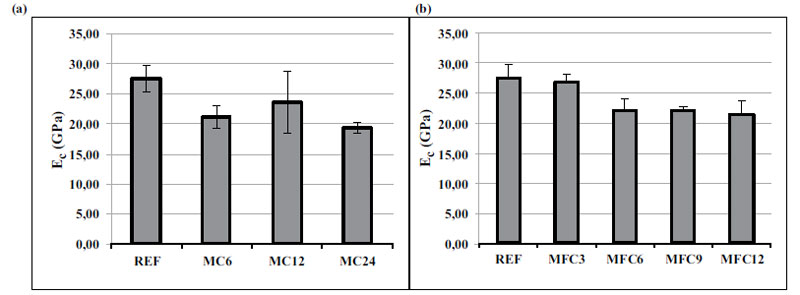
The average of Ec values and their error bars corresponding to the MC and MFC mixtures are shown in Figs. (11a and 11b), respectively. It is noted that Ec follows the same regression trend as compressive strength. The modulus of elasticity of the reference mixture reached 28 GPa after 28 days.
For the MC mixtures, the reduction in modulus of elasticity is about 14% for MFC12 and 30% for MFC24 (Fig. 12a). As for compression strength, the MC12 mix has the best performance, with an average value close to 24 GPa. The reduction rates of MC mixes are similar to those in compression strength.
The modulus of elasticity of MFC mixtures decreases as the rate of MP additions increases. A non-significant reduction of about 3% was recorded for the MFC3 mix, whereas a quasi-stationary reduction of about 12% was recorded for the substitution rates 6,9 and 12% (Fig. 12b). Once again, the Ec modulus follows the same trend in compressive strength, which has recorded a drop between 8 and 21%. The weak cement mussel powder bond and the increase of water content in the mix are the probable causes of this reduction.
The design codes propose various equations to estimate Ec. The given formulas are mainly a function of the compressive strength fc of the concrete. Table 4 summarizes some typical codes correlations.
The correlations between the measured modulus of elasticity and compressive strength for MC and MFC mixtures are shown in Figs. (13a and 13b), respectively. Experienced values (fcm) are compared with the predicted values according to the Eurocode 2 and the BAEL 91 codes. The results reveal that the two previously mentioned regulations overestimate Ec values. Thus, the proposed models are not appropriate for these composites. The experimental curves Ec=f(fcm) have a linear trend with a determination coefficient R2 exceeding 0.99. Empirical expressions have been proposed to estimate the modulus of elasticity of MC mixes (Eq.3) and MFC mixes (Eq. 4).

 |
(3) |
 |
(4) |
4.5. Mechanical Behavior of Composites
In this section, the effect of incorporating MP on the mechanical behavior of concrete is studied. It consists of analyzing the stress-strain curves of the different mixtures to deduce the parameters describing the material behavior in terms of elasticity, rigidity, and ductility. These parameters are the peak strain (εp), the strain at fracture (εr), and the secant modulus at the peak (Ep), as given by Eq. 5.
 |
(5) |
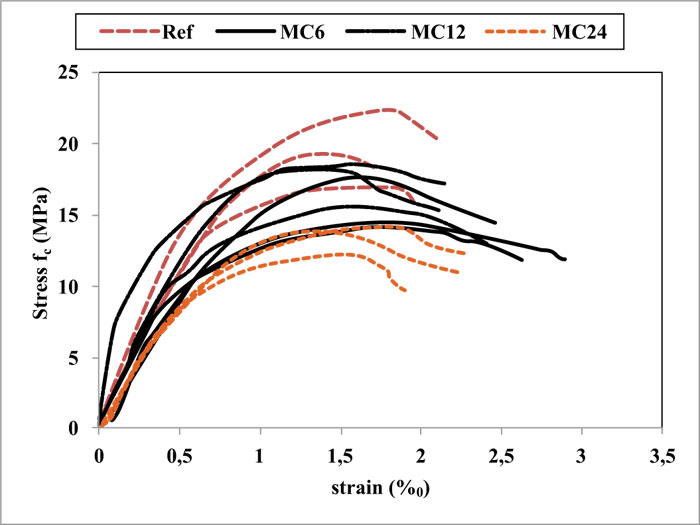
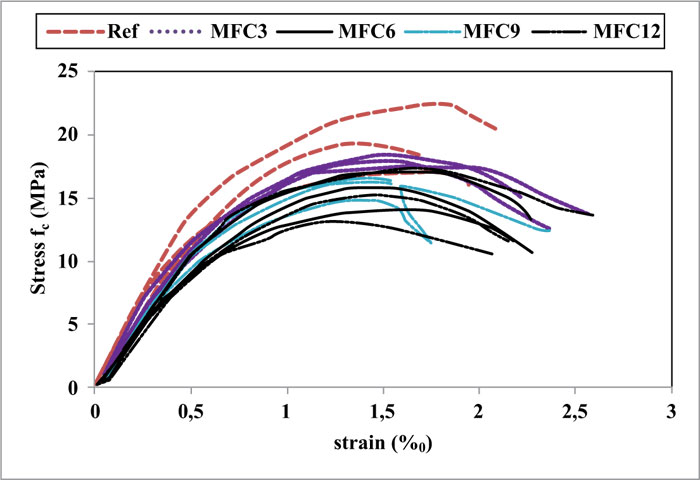
The stress-strain curves for all specimens are shown in Figs. (14 and 15). The parameters εp, εr, Ec and Ep are determined from the experimental data. The average values of the previous parameters for MC and MFC mixtures are presented in Table 5.

| Specimen | fcm (MPa) | εp (‰) | εr(‰) | Ec (GPa) | Ep(GPa) | Ep/Ec |
|---|---|---|---|---|---|---|
| REF | 19,60 | 1,68 | 2,00 | 27,58 | 11,65 | 0,42 |
| MC6 | 15,42 | 1,75 | 2,65 | 21,15 | 8,79 | 0,42 |
| MC12 | 17,46 | 1,57 | 2,18 | 23,62 | 11,15 | 0,47 |
| MC24 | 13,44 | 1,58 | 2,13 | 19,36 | 8,50 | 0,44 |
| MFC3 | 17,90 | 1,57 | 2,39 | 26,80 | 11,43 | 0,43 |
| MFC6 | 15,74 | 1,62 | 2,26 | 22,21 | 9,70 | 0,44 |
| MFC9 | 15,92 | 1,38 | 1,91 | 22,28 | 11,53 | 0,52 |
| MFC12 | 15,38 | 1,47 | 2,28 | 21,53 | 10,44 | 0,49 |
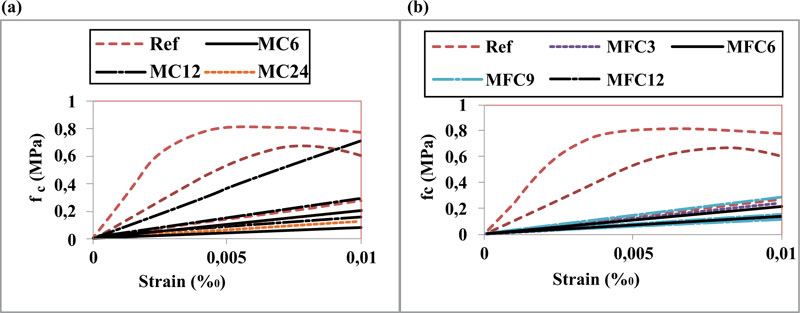
Concrete is a material characterized by non-linear behavior. The stress-strain curve has a parabolic shape. In general, concrete has elastic behavior under small deformations. Fig. (16) shows the stress-strain curve for strains below 0.01%o. It can be seen as a linear trend for mussel-based composites compared to a non-linear pattern for the reference concrete.
| Sample | REF | MC6 | MC12 | MC24 | MFC3 | MFC6 | MFC9 | MFC12 |
|---|---|---|---|---|---|---|---|---|
| 1 | 2,17 | 1,86 | 1,85 | 1,46 | 2,15 | 2,25 | 2,25 | 2,24 |
| 2 | 2,27 | 2 | 2,04 | 1,53 | 2,28 | 2,26 | 2,12 | 2,17 |
| 3 | ** | ** | ** | ** | ** | 2,30 | 2,18 | ** |
| average | 2,22 | 1,93 | 1,95 | 1,50 | 2,22 | 2,27 | 2,18 | 2,21 |
| Change (%) | 0 | -13 | -12 | -33 | 0 | 2 | -2 | -1 |
| standard deviation | 0,071 | 0,099 | 0,134 | 0,049 | 0,092 | 0,028 | 0,065 | 0,049 |
According to the results, the MC samples have reached the maximum stress fcm at a strain between 1.38 and 1.62%o compared to an average strain of 1.68%o for the reference mixture. The post-peak behavior seems to be different. MC samples show a post-peak deformation more noticeable, especially the MC6 mix with a failure strain of about 2.65%o (Table 5). The same remarks can be noted for the MFC mixtures with a lower peak deformation compared to the reference mixture except for the MFC3 mix. The strain at fracture remains exceeding the reference sample.
It can be said that the incorporation of the shell waste in the concrete has made the material more ductile. The composite continues to deform without reaching the fracture. Ductility is often related to the stiffness of the composite: the stiffer the material, the less deformable it is. Previous results showed a decreasing trend in modulus of elasticity as the rate of MP additions increased, which explains the higher ductility behavior of the formulated composites.
4.6. Splitting Tensile Strength
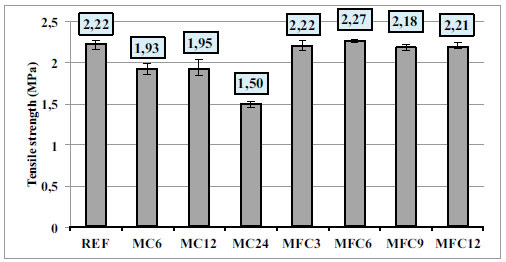
The Brazilian test is carried out on cylindrical specimens of 100*200 mm2 at 28 days of curing. The tensile strength is the average tensile strength of at least two tests. Table 6 summarizes the obtained results with standard deviation for MC and MFC specimens. The average strength values are shown in Fig. (17).
The two types of mixes show different mechanical behavior in terms of tensile strength. For MC mixes, a decrease in tensile strength is observed as the substitution rate of cement increases. The tensile strength of MC6 and MC12 remained relatively stable, with a reduction not exceeding 13%, whereas a significant drop of around 33% was noted for MC24. This result is explained by the fact that MP is not able to bind as well as Portland cement.
However, the tensile strength of MFC mixes is nearly similar to the reference concrete. There is even enhancement of the tensile strength for the MFC6 mix. This is explained by the improvement in the continuity of the concrete matrix resulting from the reduction of internal voids, as described in section 4.2 (decrease in air content).
Tensile strength is often related to compressive strength through empirical relationships. Table 7 shows some equations to predict tensile strength (ft) from compressive strength (fc).
The correlations between ft and fc at 28 days for the MC and MFC mixtures compared to the other models are shown in Fig.(18). It can be seen that the Eurocode2 (EC2) and BAEL91 models [44, 51] underestimate the tensile strength value while the ACI 318 model [52] overestimates it. The proposed model for the MC mixtures displays a parabolic curve with a determination coefficient R2=1. Eq. 6 gives the empirical expression of the proposed model, which can be used to predict the tensile strength for cement substitution rates between 6 and 24% by MP. For the MFC mix, there is no apparent correlation between the mechanical properties fc and ft. The ACI 318 model [52] gives values quite close to the experimental results with a precision degree of more than 94%.
 |
(6) |

CONCLUSION
In this article, the feasibility of using treated MP for the non-structural concrete formulation was discussed. The MP was used as a cement substitute in the proportion of 6, 12, and 24% and as an additive in the percentage of 3, 6, 9, and 12% by weight of cement. A sequence of tests was carried out to characterize the new composites in both fresh and hardened states. From this experimental study, the following conclusions can be made:
- The incorporation of MP reduces the air content of the formulated mixtures.
- The density of MC mixes decreases with the increasing cement substitution rate and is within the range of ordinary concretes.
- The compressive strength of the MC and MFC formulations meets the minimum required strength for non-structural concrete. The best performances have been achieved at a 12% replacement rate and 3% as a mineral additive.
- The addition of MP as a mineral additive improves the tensile strength of concrete up to 6%.
- The usual relationships used to estimate the modulus of elasticity and tensile strength are not suitable for these composites. New specific correlations have been established to predict these parameters.
- The MC and MFC composites have developed ductility behavior. They tend to be more deformable before failure.
As a general conclusion, the recycling of mussel waste in concrete will contribute to the preservation of the environment by reducing the quantity of shellfish waste. The concept of “green” concrete can be achieved through the use of the formulated concretes in the paving works or as a blinding concrete. This composite could be used as an infill material for confined beams and columns.
CONSENT FOR PUBLICATION
Not applicable.
AVAILABILITY OF DATA AND MATERIALS
The authors confirm that the data supporting the findings of this study are available within the article.
FUNDING
None.
CONFLICT OF INTEREST
The authors declare no conflict of interest, financial or otherwise.
ACKNOWLEDGEMENTS
The authors gratefully thank and acknowledge the Mechanics, Structures, and Materials research team, part of the Laboratory of Mechanics, Energy, and Environmental Processes, for their help in the completion of this work.


