All published articles of this journal are available on ScienceDirect.

Storage Earth Dam Failure due to Liquefaction Caused by Earthquakes
Authors Info & Affiliations
Abstract
Aims:
We are researching causes and criteria for the liquefaction dam failure by analyzing the safety of the dam under static and dynamic loads against shear failure using the finite element technique, which is used to simulate stability assessment for selected earth dams under different loading conditions.
Background:
Storage Massive earth dams are vulnerable to collapse during earthquakes, which can have severe effects ranging from direct human casualties to indirect economic losses. How seismically fragile earth dams are and what issues may arise from a failure depend on how they respond to earthquakes. Slope failure, piping, displacement, and/or settlement are examples of seismic responses that are caused by weak soil and/or the liquefaction of loose sands. Earth dam failure can be caused by a variety of factors, including seepage through the dam body, hydraulic issues, structural instability, and liquefaction failure brought on by earthquakes.
Objective:
The objective of this study is to find a way to design of earth-fill dams.
Methods:
The finite element method is a numerical solution. This method is based on a grid pattern (not necessarily rectangular) which divides the flow region into discrete elements and provides N equations with N unknowns. Material properties, such as permeability, are specified for each element, and boundary conditions (heads and flow rates) are set. The finite element method has several advantages over the finite difference method for more complex seepage problems.
Results:
The Lower San Fernando Dam is dangerous under dynamic loads, and the F.O.S. values for the upstream and downstream directions are 0.264 and 0.183, respectively. 1350 m2 is the Lower San Fernando Dam's liquefaction area. 40.67% of the Lower San Fernando Dam's overall foundation area is represented by that figure. Tapar (India) dam is hazardous due to slope failure under dynamic loads, and the F.O.S. values for the upstream and downstream directions are 0.5 and 0.109, respectively. Tapar Dam in India has a liquefaction area of 457 m2. This amount equals 52.33 percent of the Tapar (India) dam's entire foundation area. The slope failure under dynamic loads and the F.O.S. values of 0.313 and 0.548 for the slopes of the river upstream and downstream of Fatehgadh dam (India), respectively, lead to the conclusion that it is dangerous. 333.5 m2 is the size of the liquefaction area of the Fatehgadh dam in India. The foundation area of the Fatehgadh (India) dam as a whole is represented by that figure at 78.75%. Saluda Dam in Columbia is an unsafe slope failure under dynamic loads, and the F.O.S. values for the upstream and downstream directions are 0.102 and 0.101. Saluda Dam in Columbia has a 32095 m2 liquefaction area. This value represents 32.96% of the Saluda Dam's total foundation area (Columbia).
Conclusion:
Conclusions state that 32.96% of the minimum liquefaction zone area is what causes liquefaction failure. Under the effect of seismic stresses, a safe design standard for storage earth dams is produced. The evaluation must also take into account the specifications for safety limitations based on global norms, regulations, and codes. examining the dam safety requirements for dynamic loads.
1. INTRODUCTION
Dams are built for a variety of objectives, such as irrigation, flood control, and the generation of hydroelectric power. The two primary varieties of storage dams are concrete rigid dams and embankment dams. The two main types of embankment dams, based on the materials used in construction, are earth-fill dams and rock-fill dams. Over 85% of all built dams are embankment dams [1]. A few factors that affect the type of earth dam chosen include geography, foundation conditions, environmental effects, construction facilities, and socioeconomic research. The type of earth dam chosen depends on several factors, including terrain, foundation conditions, environmental effects, construction facilities, and socioeconomic research. QUAKE/W and SIGMA/W are often utilized in many civil engineering applications. These programs were used in this research to analyze and study the results [2].
In this work, analyses of five earthfill dams that have already collapsed due to liquefaction have been compiled under the influence of earthquakes. These dams are: the Fernando Dam (California) Taper Dam (India), Saluda Dam (Columbia), Fatehgadh Dam (India), and Chang Dam (India). The study aims to find a critical ratio of the volume of liquefied soil from the data of the studied dams to be a guiding value for design engineers that are taken into account when designing earth dams to avoid the occurrence of the phenomenon of liquefaction under the influence of earthquakes.
2. PREVIOUS WORK
According to Singh et al. (2005) [3], Tapar dams were badly impacted, particularly along the upstream parts, although Chang Dam experienced significant slumping. First, the potential for liquefaction of these dams' foundation conditions was determined. According to the meager subsurface information available from inspections carried out before the earthquake, the layers beneath these dams' downstream sections were not saturated, which prevented the Bhuj Earthquake from inducing liquefaction. An earthquake of magnitude of 7.6 (Mw 7.6) occurred on January 26, 2001. The epicenter of the main shock of the event was located near Bachau at latitude 23.368N and longitude 70.348E with a focal depth of about 23.6 km. The event, commonly referred to as the Bhuj Earthquake, was among the most disastrous earthquakes that have affected India. In this work, the liquefaction failure zone was determined by using the finite element method.
According to S. Mahmood et al. (2022) [4], the Makhoul Dam, a massive zonal dam that is now being built on the Tigris River in northern Iraq, was numerically modeled using finite element methods to examine seepage, slope stability, and liquefaction. Due to high pore water pressure, piping, and soil liquefaction, earthquake shakings impose extra hysteric and short-term pressures that may cause dam failure. As a result of applying an earthquake shaking to the dam, the dynamic stability of the dam and soil liquefaction was also assessed. Because the calculated value of the safety factor was more than the permitted amount, the dam was safe from internal erosion and slope failure under static conditions.
Su et al. (2022) [6] utilized the Monte Carlo method, the dynamical stability of the earth-rock dam was examined while taking into account the spatial variability of the soil beneath the dam and the coupling effect of the seepage field, stress field, and other hazards. Engineering of early warning measures is suggested by the revelation of the impact of numerous disaster on the stability of the dam. This study achieves the dynamic risk assessment of the dam slope stability under multiple hazards, avoids the restriction of evaluating the dam slope stability with a single safety factor, and provides a reference for risk analysis and emergency management of reservoir dams under the action of multiple hazards.
W. Aziz et al. (2023) [7] studied the effects of top width, shape, and side slopes on upstream and downstream slope stability under various conditions. The safety of an earth dam's side slopes was evaluated using the Slide 6.0 software, and the results were validated. The findings showed that, particularly under steady state and fast drawdown situations, the factor of safety was decreased by increasing the side slopes of the core. The safety factor in the steady state condition decreased along with widening the top.
In the study of Abbas et al. (2021) [8], the seepage during the Al-Wand dam was examined using the Seep/w software, which was used in conjunction with the Geo-studio modeling. Following confirmation that the dam was safe from seepage failure, the analysis was transferred to the QUAKE/W, which is used for liquefaction modeling of earthquakes and dynamic loading and calculates the movement and increasing pressures of pore water that result from seismic vibration or rapid shock loads. The program was used to examine how the earthquake affected the pressure in the pore water, effective stresses, and displacements. The earthquake's considerable impact on these parameters is also unclear.
The findings of study by Marchamalo-Sacristán, et al. support the use of MT-InSAR monitoring of embankment dams at all stages of their lifecycles, including mature dams like the Bennar Dam [8]. However, geodetic, hydraulic, and geotechnical monitoring should be included as required by dam safety requirements. It has been shown that MT-InSAR is a reliable and economical system for monitoring deformations in embankment dams. Dam deformation's temporal evolution was identified both geographically and temporally. Results support the consolidation of the dam predicted by a theoretical model.
Smail (2022) [10] examined the Souk Tlata earth dam's ability to withstand earthquakes. It is equivalent to a preliminary analysis of the behavior of the dam under quake loading with a dominating frequency that is near the fundamental frequency of the dam. Using Plaxis-2D, a finite element model of the dam was created using plane-strain finite elements. To conduct dynamic analysis, a real earthquake motion was used that corresponds to the primary shock that occurred on May 21, 2003, in Algeria. The findings demonstrate that seismic loading with peak acceleration exceeding 0.10g causes significant settlement at the dam's crest and significant displacement in the upper half of the riprap on the upstream side.
Han et al. (2023) [11] studied the distribution of kinds of soil shear strength indicators using a research methodology based on cloud theory. It is determined that the logarithmic normal cloud distribution is the best probability distribution model for cohesiveness and internal friction angle. Additionally, we provide a “cloud model-Monte Carlo” coupling model that can accurately assess the danger of dam landslides. The cloud model can determine the probability distribution models of the shear strength parameters and handle their uncertainty. The Monte Carlo approach can estimate the probability of output variables and simulate the random behavior of input variables. A more precise risk evaluation can be produced by combining these two techniques.
In the work of Astutik and Aprilina (2022) [12], the groundwater level and the composition of the soil structure were used to model the possibility for liquefaction using shaking table test equipment. Based on the groundwater level, this research demonstrates that sand soil, which is expected to have a shallow groundwater level, has more and faster liquefaction. Sand soil also liquefies when it becomes water-saturated.
Md. Mizanur Rahman and Sitharam (2020) [13] studied the combined concepts and assessed the potential for liquefaction by comparing it to the estimated typical cyclic stress ratio, or CSR, caused by an earthquake. It then suggested a critical state (CS) technique for fine-grained sand. In Ahmedabad, India, which suffered significant damage from the Bhuj earthquake in 2001, sand from the Sabarmati river region was evaluated in a series of triaxial tests. Before being blended with 0% to 30% quarry dust in increments of 5%, the sand was cleaned to create clean Ahmedabad sand. Estimating the liquefaction resistance for sand to fc and figuring out the likelihood of liquefaction can be done by comparing the typical cyclic stress ratio, or CSR, of an earthquake with the CRR20. Using a liquefaction screening chart, the CRR20 link can be seen (2001). The liquefaction potential of a location along the Sabarmati River was evaluated using an SPT-based case study and compared to another study [13].
3. MATERIALS AND METHODS
3.1. Slope Stability of Earth Dam Approach
Hence, the strength or shear resistance of the soil determines how stable the slopes of earthen buildings are. The Swedish method, developed by Swedish Engineers in 1922, is a well-known approach for examining the stability of slopes and is consequently more frequently utilized. This approach assumes that the curved slip surface is an arc of a circle with a certain center. There will be several of these probable slip rings, each with its center. Picking up the critical slip circle with the lowest soil shear resistance, or the most dangerous critical slip circle, is important. Trial and error are used to determine the circle's center [14].
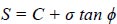
The soil's shear strength varies from one location to the next around the slip circle as a result of internal friction and cohesion. This soil's shear strength is calculated as follows:
 |
(1) |
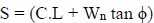
Where C is constant throughout the slip circle, but the pressure generated by the weight of the dirt along the slip circle varies from one spot on the slip circle to the next. The curved surface of length L at the bottom of the strip is characterized by W and S, which is its shearing strength. According to (Fig. 1), the weight (W) is equal to two forces: the tangential force Wt and the normal force Wn, which are tangential to the curved surface and normal to the surface, respectively. Hence, we will obtain the equation:
 |
(2) |
Where, C . L = cohesive strength per meter length of the strip, Wn tan ϕ = frictional strength per meter length of the strip. According to the trapezoidal formula or precisely to a plan meter, the area of each strip that is one meter long determines how much it weighs. The Wn and Wt of each strip can be graphically determined by drawing the triangle of force for each strip as shown in (Fig. 1). The critical circle is located as normal, and the safety factor is discovered for each of the other slip circles. It should be carefully observed that the tangential weights of the first few strips near the slope's toe will resist the propensity to slide; therefore, these weights must be taken with their proper sign [14]. There are other methods used to determine the factor of safety of slopes. They are Ordinary, Bishop's, Janbu, and Morgenstern. Price methods according to Table 1.
| Method | F.O.S | Inters Lice | |
|---|---|---|---|
| Load | M | (V=vertical, H=horizontal,) | |
| Ordinary Method | --- | yes | Ignore H and V. |
| Bishop’s Method | --- | yes | V disregarded, H thought |
| Janbu’s Method | yes | --- | V disregarded, H thought |
| Morgenstern-Price | yes | yes | H and V both considered |
Shear stresses are present on internal surfaces or failure planes near the slope in every soil mass with a slope at one end. To drag part of the soil material near the slope gravitational forces have caused this. The critical slip surface and accompanying safety factors were identified using a variety of models and analytical techniques, including the method of slices [15].
 |
(3) |
Where F.S. is the safety factor, τf is the failure shear strength of the soil along the slip surface, and τ is the shear stress of the soil along the slip surface. An earthfill dam's side slopes' stability is influenced by its shape, parts, materials, individual component characteristics, and external influences. By applying straightforward failure models, the stability of a slope can be assessed analytically using a few different methods. Only slopes comprised of homogenous material, soils, and rocks with fractures that behave like soils, as well as straightforward strain (2-D) problems, may be solved using these techniques. Table 1 compares the various slope stability strategies.
3.2. Formulation of Numerical Finite Element
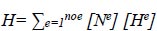
The Laplace equation for continuous groundwater seepage was first solved using a finite element simulation, which was presented [16]. The foundation rock for Canada's Bennett Dam was allegedly evaluated for probable seepage flows and uplift pressure using the finite element method [17]. Utilizing the thermal technique in the ANSYS computer code, numerically simulated instances of earth dams have no set free surfaces [18]. The finite element approach's fundamental tenet is to subdivide the issue domain into smaller domains (Finite Elements) connected at common nodes, with the estimated definition of the field variable's unknown function occurring within each element. Using a continuous function, the estimated solution for each element is
 |
(4) |
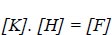
Where, Ne = form of the element function (e), He = nodal to (H) for the I th node in element (e), and noe = number of components overall. There are various ways to formulate the problem's approximation of a solution. The usual weighted residual approach using criteria was employed in the current investigation to determine the solution to the unidentified variable (H) [19]. Equation (1) can be represented in matrix form as follows:
 |
(5) |
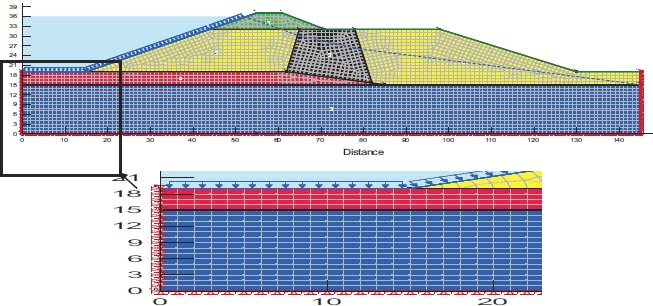
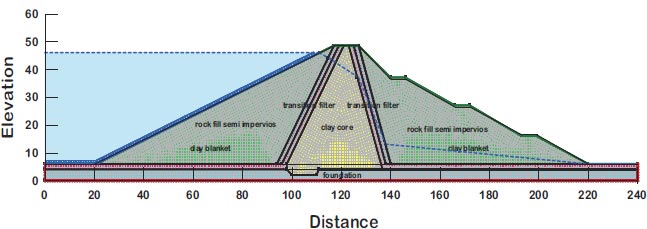
Where [K] is the conductivity matrix, [H] is the unknown nodal potential head vector, [F] is the unknown nodal external flux vector, and [H] is the nodal potential head vector. To address the seepage problem of a phreatic surface, the finite element mesh's size and the location of the phreatic surface must be varied frequently until the nodal head H reaches the requisite level of convergence [20]. Depending on the geometry, the model using finite elements uses both organized and unstructured mesh, as shown in (Fig. 1), for example, the case of San Fernando Dam. The model consists of 4097 nodes and 3945 elements, where material properties are extracted. The geometry of the quad and triangular elements is chosen in our situation because it is compatible with the unstructured mesh and the number of nodes and the mesh also comply with the Geo-Studio manual's recommendations.
3.3. Boundary Conditions for Modeling
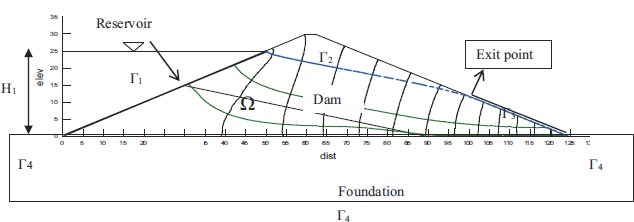
The statement of the issue and the boundary conditions for a conventional earth dam are schematically represented in Fig. (2). The following is a succinct summary of these boundary conditions:
3.3.1. Entrance Surface (Γ1)
The surface where reservoir water percolates at the entrance through the media is the upstream boundary surface (Fig. 2). Circlet condition refers to this surface as an equipotential line with the following predefined heads [21].
 |
(6) |
3.3.2. Phreatic Surface (Γ2)
The dam's phreatic flow surface (2) creates the boundary surface. This line is considered the stream's boundary. Despite being a boundary condition, the phreatic surface's location and profile are uncertain. The boundary condition for the unknown phreatic surface is determined by:
 |
(7) |
 |
(8) |
Where n is the boundary's normal direction (Γ2).
3.3.3. Exit Surface (Seepage Surface) (Γ3)
Fig. (2) shows boundary surface is also known as the seepage surface or exit surface. As it is believed that the pressure along this boundary is atmospheric, the following boundary condition applies to such a surface:
 |
(9) |
The seepage surface's geometry is known, except for its upper limit, or exit point, which is located on the unnamed phreatic surface. Knowing where this point is part of the required solution.
3.3.4. Dam Foundation Boundary (Γ4)
The boundary surface Γ4 is also referred to as the Neumann Condition and represents the boundary of the dam's base. This border is presumptively impermeable for the sake of the current study, meaning that water cannot pass through it, as shown by:
 |
(10) |
Where n is the boundary's normal direction.
3.4. Earthquake-induced Liquefaction
During cyclic loading, loose cohesion less soils tend to compress if the soil is moist and generally unable to drain during shaking. This can cause normal stress to be transferred from the soil skeleton to the pore water. The soil's effective confining stress decreases as a result, and the loss of strength and stiffness causes the soil deposit to deform [22]. Liquefaction is the loss of strength and stiffness brought on by rising pore pressure, and it can have disastrous results. Although the liquefaction phenomena are qualitatively described in the previous definition, the precise circumstances in which it occurs are not known. This is mostly because failure mechanisms vary based on the pre-earthquake circumstances. Flow liquefaction and cyclic mobility are the two basic phenomenon groups that makeup liquefaction. When a soil undergoes flow liquefaction, its shear strength falls until the shear stresses needed to achieve equilibrium outweigh it. This results in flow failure, which is fueled by static shear stress. With cyclic mobility, as opposed to flow liquefaction, the combined effects of static and cyclic stress results in incremental deformations that lead to failures that are created during shaking. Latitudinal spreading is a sort of cyclic mobility that can occur on almost level ground next to bodies of water or on slightly sloping terrain. Although the deformations in this scenario are considerably less than inflow failures, the damage could still be substantial if nearby buildings are present. This type of phenomenon can affect quite sizable regions.
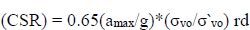
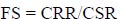
3.5. Assessment of Liquefaction
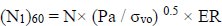
The Critical Stress Ratio (CSR) is a gauge for seismic load, and the Cyclic Resistance Ratio (CRR) is a liquefaction index for soil resistance in the process of determining the liquefaction potential. Using field performance data from prior earthquakes, relationships that depend on the soil's fineness have been used to link the normalized SPT blow count, or (N1)60, with CRR for cohesion-less soils. The SPT blow count is provided with a normalized value by [13].
 |
(11) |
Where the atmospheric pressure is Pa. (≈ 100 kP a), N is the raw SPT blow count, σvo is the depth of testing's effective vertical stress, and the energy ratio (ER) is approximately 0.92 in a typical Indian SPT configuration.
 |
(12) |
Where CRR stands for the cyclic resistance ratio of the soil for an earthquake of a specific magnitude.
 |
(13) |
 |
(14) |
3.6. Problem Statement
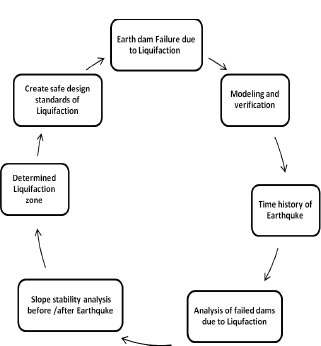
For the dam's stress analysis and slope stability simulation, finite element modeling is used. The GeoStudio programmer GEO-Slope (2018) is utilized for the analyses. Limit equilibrium slope stability evaluations of the downstream and upstream slopes of the dam before and after the earthquake, effect employs all the results of both seepage and stress analyses. The analysis findings are put to use to create safe design standards for massive dams subject to seismic load effects and liquefaction failure dams. Fig. (3) presents a methodological flow chart. This diagram was made to illustrate the basic steps and general objectives of the work to perform an analysis of the stability of earthen dams against earthquakes.
3.7. Material Properties of Dams
In this part, the cross-section of the dams under study is presented, as well as the tables of the material properties of the constituent layers of those dams. Table 2 presents a group of dams that are studied in the research are presented, as well as the earthquake forces affecting each dam and the model properties.
3.7.1. Bilate Dam
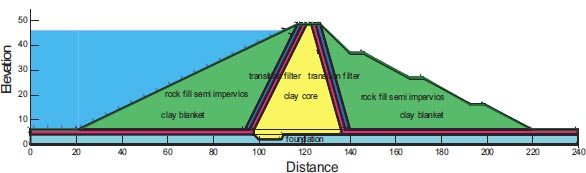
Fig. (4) and Table 3 show the material properties of the Bilate dam. Dam examined the estimated flow slope stability factor of the Bilate dam at overall stability both before and after earthquake loading using the GeoStudio computer programmer. Southern National and Oromia are the regions where the Bilate dam is situated. The dam's reservoir has a 52 million m3 capacity and is filled with rock and earth to a height of 42.5 m [23].
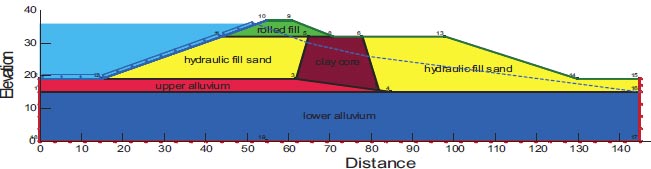
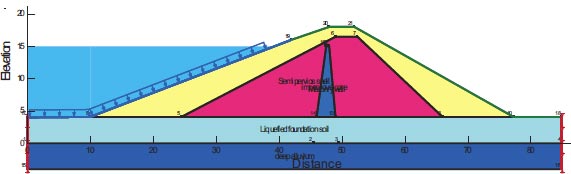
3.7.2. Lower San Fernando Dam
Fig. (5) and Table 4 show the cross-section of the San Fernando dam. The eroding embankment as well as the strong chance of the dam collapsing put the 80,000 or so residents in the area below in danger. San Fernando Dam was the second significant dam to crumble. The San Fernando earthquake, which occurred in Southern California in 1971, was a large quake. The 6.6 Richter magnitude earthquake struck on February 9 around 6:00 a.m. The top and upstream slopes of the Lower San Fernando Dam were significantly altered by the San Fernando earthquake in 1971. This dam is located in Southern California [22].
| Dam | Country | H (m) | Acc. of Earthquake | Location of Liquefaction Failure | Mesh of Model | ||
|---|---|---|---|---|---|---|---|
| Area | Node | Elements | |||||
| Lower San Fernando | California | 22 | 0.6g | Foundation and dam body | 1m*1m | 4097 | 3945 |
| Chang | India | 15.5 | 0.5g | Dam body | 1m*1m | 1286 | 1201 |
| Tapar | India | 13.5 | 0.41g | Dam body | 1m*1m | 2501 | 2355 |
| Fatehgadh | India | 11.6 | 0.3g | Dam body | 1m*1m | 949 | 861 |
| Saluda | Columbia | 115 | 0.4g | Foundation and dam body | 4m*4m | 7573 | 7357 |
| Saddle | Ethiopia | 65 | 0.318g | Foundation and dam body | 1m*1m | 18046 | 17771 |
| Material | E | ϒ | C | Φ | G | V | R |
|---|---|---|---|---|---|---|---|
| Core | 17500 | 19 | 18.8 | 26 | 11000 | 0.4 | 0.1 |
| Semi impervious layer | 20000 | 19 | 15 | 26 | 11000 | 0.4 | 0.1 |
| Filter | 25000 | 22 | 0 | 38 | 15400 | 0.3 | 0.1 |
| Rock fill | 62000 | 22 | 0 | 38 | 28600 | 0.25 | 0.2 |
| Clay blanket | 17500 | 19 | 18 | 26 | 11000 | 0.4 | 0.2 |
| Alluvium foundation | 50000 | 17.7 | 35 | 31 | 11000 | 0.35 | 0.2 |
| Type of Material | E | ϒ | C | Φ | G | V | R |
|---|---|---|---|---|---|---|---|
| Semi-precious shell | 17500 | 18 | 9 | 30 | 10000 | 0.2 | 0.1 |
| Impervious core | 17500 | 20 | 65 | 0 | 12000 | 0.2 | 0.2 |
| Masonry wall | 60000 | 22 | 80 | 0 | 30000 | 0.3 | 0.1 |
| Liquefied foundation soil | 12000 | 18 | 0 | 10 | 7000 | 0.2 | 0.1 |
| Deep alluvium | 20000 | 20 | 0 | 41 | 17500 | 0.35 | 0.2 |
3.7.3. Chang Dam
The 1959-built Chang Dam is a multiple-zone earthen dam with a 15.5 m maximum section height and a crest length of 370 m. Fig. (6) and Table 5 show the cross-section of Chang Dam and the material properties of the dam. The bedrock on which the dam is constructed is a thin layer of sandstone. The initial design did not consider or take into account the sensitivity of the foundation soil to liquefaction and estimate that the alluvial soils beneath the dam were probably wet when the Bhuj Earthquake occurred, even though the reservoir behind Chang Dam was essentially vacant [3, 26].
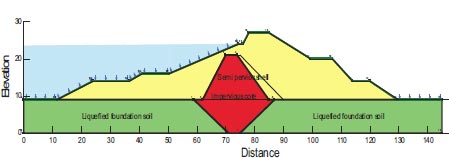
3.7.4. Tapar Dam
The earthen dam with many zones, the Tapar Dam, was built in 1976. An extended crest of 1350 meters and a maximum section height of 13.5 meters. In the 1990s, it was raised by another 2.5 m, directly beneath the dam are alluvial sediments that descend more than 30 meters. The Bhuj Earthquake occurred in India on January 26, 2001, with a maximum acceleration of 0.41g [3]. The Tapar Reservoir was largely empty, but the alluvium beneath the upstream face of the dam was moist. Several areas were affected by the upstream toe's liquefaction of the upstream slope to slide laterally and translational [26, 3]. The dam's cross-section shows all of its parts as shown in Fig. (7). Table 6 displays the material characteristics of the dam's parts.
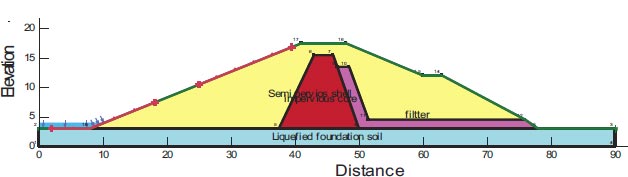
3.7.5. Fatehgadh Dam
The multimode Fatehgadh Dam, constructed in 1979, has a maximum height of 11.6 meters and a 4050-meter crest length (Fig. 8). Like Chang Dam, Fatehgadh Dam is coated in a combination of loose to medium-density silt sand. The scant subsurface exploration information that is available indicates the site is covered in 2 to 5 m deep granular soil, which has a Standard Penetration Test (SPT) blow count in the uncorrected range of 13 to 19. The reservoir level was near the surface and the alluvium beneath the dam was saturated during the Bhuj Earthquake. The Bhuj Earthquake occurred in India on January 26, 2001, with a maximum acceleration of 0.41g [3]. Furthermore, the liquefaction of foundation soil may unintentionally result in the problem of longitudinal cracks. However, it's possible that the upper portion of the downstream slope's instability is not caused by the liquefaction of the foundation layers. Fig. (8) depicts the dam's cross-section along with every component of the dam. Table 7 lists the dam components' material properties.
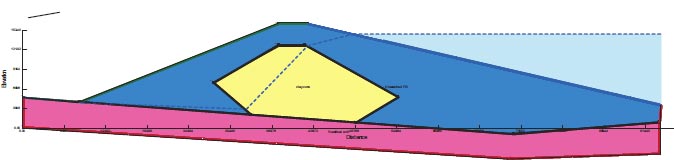
3.7.6. Saluda Dam
Saluda Dam (Saluda) building is prone to liquefaction and is situated in the South Carolina region affected by the Charleston Earthquake with a maximum acceleration of 0.4g. Risks of liquefaction exist within the components that make up the embankment itself at Saluda Dam [27, 28]. These facts lead to procedures that are very distinct for post-earthquake slope stability. Although the Saluda Dam is an earth-fill retention structure, it has a very different shape and set of features. Fig. (9) depicts the dam's cross-section and all of its components. Table 8 lists the dam components' material properties.
| Type of Material | E | ϒ | C | Φ | G | V | R |
|---|---|---|---|---|---|---|---|
| Clay core | 17500 | 19 | 40 | 8 | 15000 | 0.25 | 0.1 |
| Unwashed fill lid | 15000 | 19 | 5 | 25 | 10000 | 0.2 | 0.1 |
| Residual soil | 30000 | 22 | 30 | 40 | 25000 | 0.2 | 0.1 |
4. RESULTS
4.1. Numerical Modeling and Verification
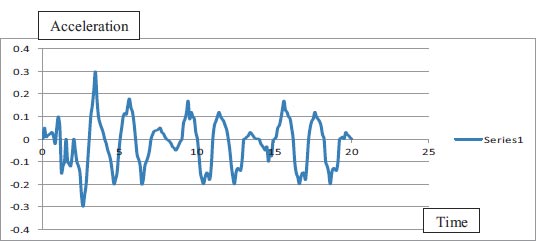
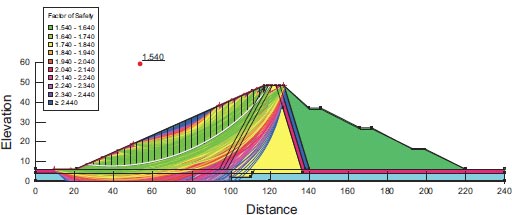
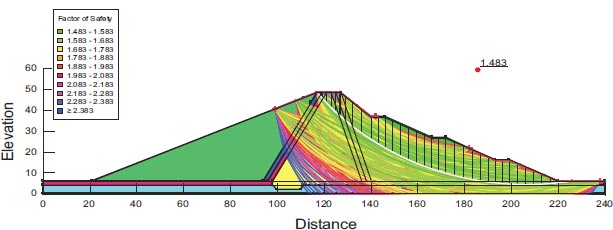
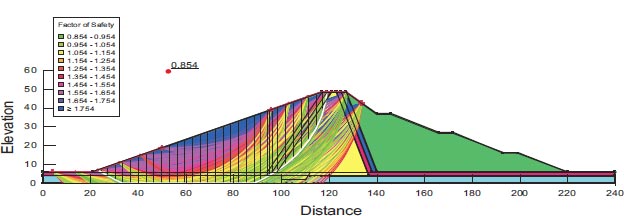
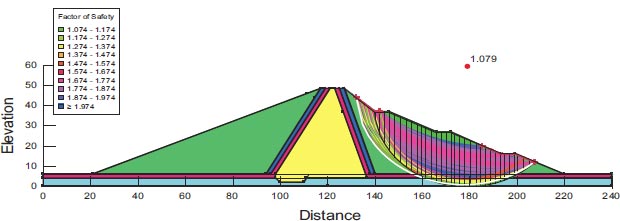
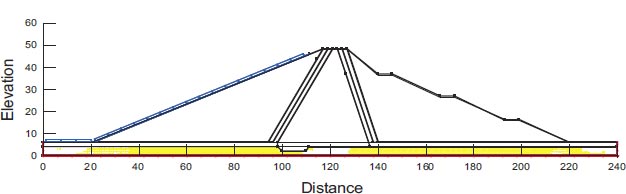
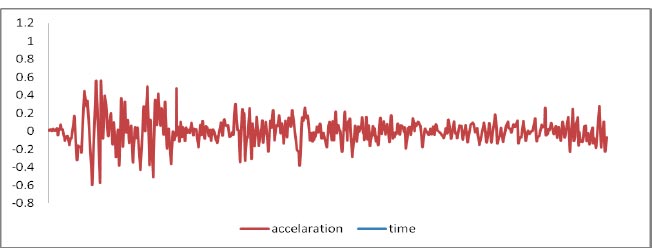
For the assessment of slope stability before and after seismic stresses for earth dams, Geostudio was employed. Computer code for GeoStudio in the current work, the stability analysis is simulated by GEO-Slope (2018) utilizing an unconventional earth fill dam. The model is validated using [23]. The verification is done for overall stability before and after seismic loads. Figs. (10 and 11) show the horizontal maximum credible earthquakes are 0.3g and the mesh profile used in the finite element method. Figs. (12-15) and Table 9 show (F.O.S.) for all possible operations, a simulation of the upstream and downstream slope. The average absolute percentage difference (AAPD) is approximately 11.6% for the upstream slope before the earthquake, and the absolute mean error (AME) is roughly 0.203. The absolute mean error (AME) and average absolute percentage difference (AAPD) for the upstream slope following the earthquake are each about 0.039 and 4.36%, respectively. (AME) is around 0.229 and (AAPD) is approximately 13.3% for the downstream slope before the earthquake. After an earthquake, the downstream slope's (AME) and (AAPD) values are approximately 0.137 and 11.2%, respectively. For all cases of operation, a good agreement is reached. Fig. (16) presents liquefaction areas after the earthquake through the foundation layer of the Bilate dam.
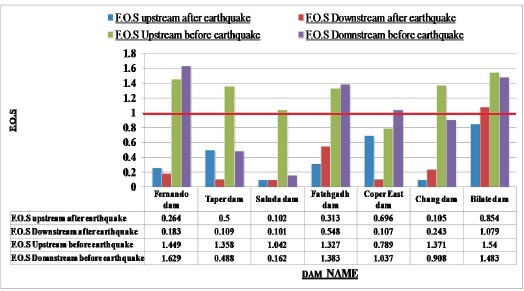
| F.S. Downstream Slope | F.S. Upstream Slope | Methods of Calculation | ||
|---|---|---|---|---|
| After Earthquake | Before Earthquake | After Earthquake | Before Earthquake | |
| 1.079 | 1.483 | 0.854 | 1.54 | Present study GeoStudio software (2018) |
| 1.216 | 1.712 | 0.893 | 1.743 | Reference [HABTAMU GETACHEW 2018] |
| 11.2% | 13.3% | 4.36% | 11.6% | Absolute percent difference |
4.2. Liquefaction Failure Modeling
4.2.1. Lower San Fernando (California)
The results of the on-site study revealed that the slide was caused by a hydraulic sand fill zone liquefied located close to the foundation of the upstream shell. Fig. (17) shows the Horizontal maximum credible earthquake San Fernando Earthquake in 1918 and its maximum acceleration is 0.6 g.
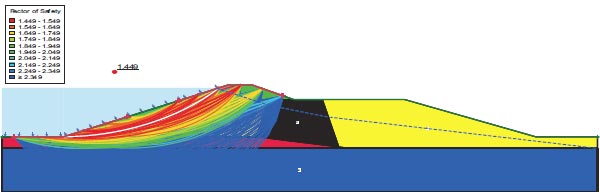
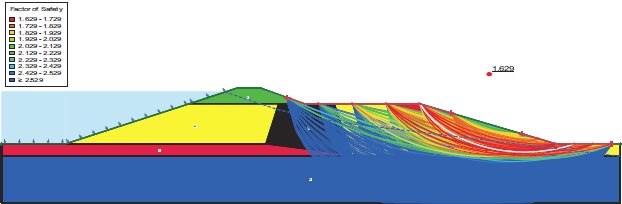
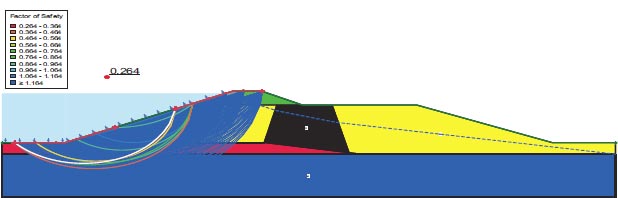
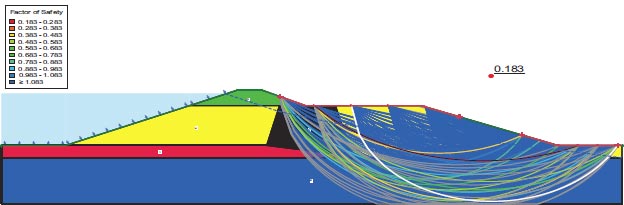
Figures depict the F.S. for the dam slopes both before and following the earthquake (18–21). The safety factor (F.O.S) values before the earthquake, as depicted in the figures, were between 1.449 and 1.629, satisfying the minimal F.S. requirements [25, 27]. The safety factor (F.O.S) readings under static load are an indication of the dam's stability. The safety factor (F.O.S) values following an earthquake varied from 0.264 to 0.183, falling short of the basic limits set by [25, 27]. Fig. (22) presents the zone where the initial stress ratio is above or on the collapse surface, as indicated by the yellow shading. This is marked as a zone of liquefaction in QUAKE/W. Fig. (22) illustrates the area of liquefaction, which has a value of 40.70%.
4.2.2. Chang Dam (India)
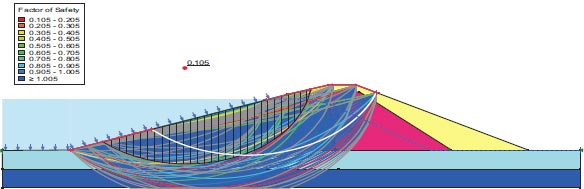
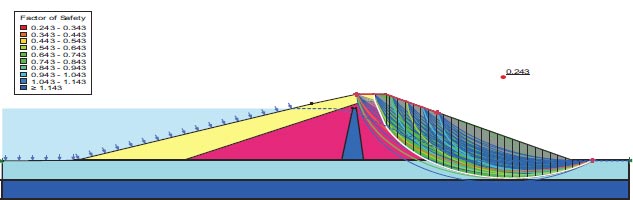
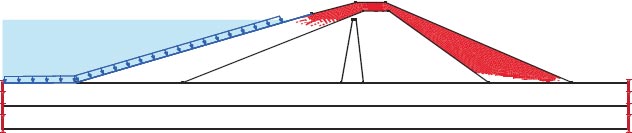
After the earthquake, the F.S. for the dam slopes is shown in Figs. (23 and 24). The safety factor (F.O.S.) values after the earthquake are 0.105 and 0.243, as can be seen in the supplied figures, and they satisfy the minimal F.O.S. criteria [25, 27]. The zone where the stress ratios initially are above or on the collapse surface is indicated in Fig. (25) by the red shading. This is marked as a zone of liquefaction in QUAKE/W. Fig. (25), where the value is 52.20%, depicts the area of liquefaction.
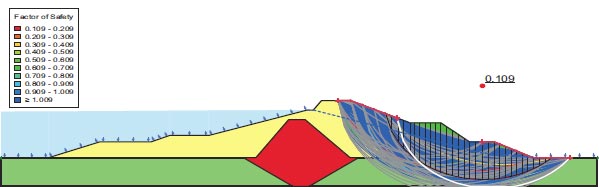
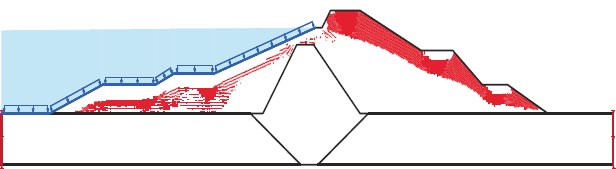
4.2.3. Tapar Dam (India)
After an earthquake, the dam slopes' F.S. is shown in Fig. (26); the factor of safety (F.S.) values after the earthquake were 0.109, which is below the minimal F.S. levels specified by [25, 28, 29]. In Fig. (24), the region where the stress ratios are initially above or on the collapse surface is colored red. This area is marked as a liquefied zone in QUAKE/W. Fig. (27), where the value is 52.33%, depicts the region of liquefaction.
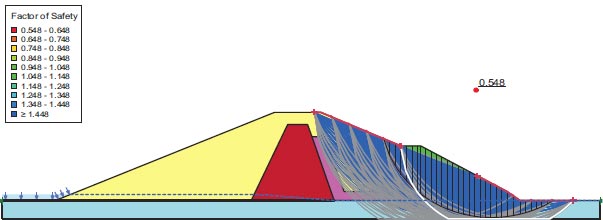
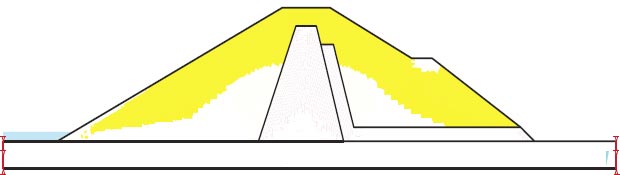
4.2.4. Fatehgadh Dam (India)
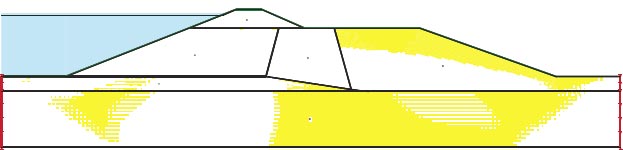
F.S. for the dam slopes following an earthquake is shown in Fig. (28). The safety factor (F.O.S) values after the earthquake, as shown in the supplied figure, are 0.548, which does not meet the minimal F.S. criteria [25, 27]. The zone where the stress ratios are initially above or on the collapse surface is shown in Fig. (29) as a yellow-shaded area. This is marked as a zone of liquefaction in QUAKE/W. The liquefaction area is shown in Fig. (29), where the value is 78.75%.
4.2.5. Saluda dam (Columbia)
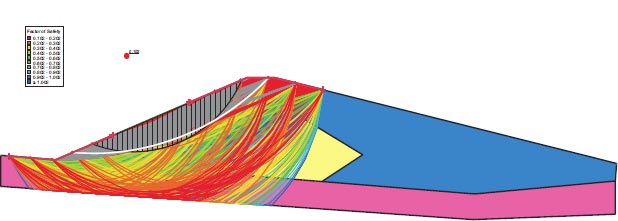
F.S. for the dam slopes following the earthquake is shown in Fig. (30). The safety factor (F.O.S) value after the earthquake, as shown in the presented figure, is 0.102, which is fewer than the minimum limitations of the safety factor (F.O.S) [25, 27, 29].
5. RESULTS AND DISCUSSION
The Ethiopian Bilate values of 1.54 and 1.483 for upstream and downstream, respectively. F.O.S values of 0.854 and 1.079 for the upstream and downstream due to slope collapse under dynamic loads. The Bilate Dam in Ethiopia has a liquefaction area of 737.2 m2, this amount equals 78.67% of the Bilate Dam's entire foundation area.
Lower San Fernando dam is dangerous under dynamic loads, and the F.O.S. values for the upstream and downstream directions are 0.264 and 0.183, respectively. 1350 m2 is the Lower San Fernando Dam's liquefaction area. 40.67% of the Lower San Fernando Dam's overall foundation area is represented in Fig. (31).
When the soil's steady-state strength is exceeded by the static shear forces in a deposit of liquefiable soil, flow liquefaction may result. Both during and after an earthquake, it can result in severe flow slide failure. Only loose soil has the potential for flow liquefaction. Cyclic mobility can occur when the static shear stress is less than the steady-state (residual) shear strength and the cyclic shear stress is high enough to suddenly surpass the steady-state strength. At the end of a strong and/or long-lasting earthquake, the deformations caused by cyclic mobility start gradually but grow significantly. Both loose and dense soils are capable of cyclic mobility, but as density rises, deformation dramatically declines. In the contractive zone, an undrained stress channel frequently moves to the left as the inclination of contraction raises the pore pressure and lowers p'. In an earthquake, the q/p' stress ratio and the contours of the initial static stresses' q/pL stress ratios are shown in the figure. The high q/pL ratios near the hydraulic fill's center are an important item to note. The initial q/Pl points are thus above the collapse surface in a certain area. With only slight shaking, the soil strength in this zone could be quickly reduced to steady-state strength.
Tapar (India) dam is hazardous due to slope failure under dynamic loads, and the F.O.S. values for the upstream and downstream directions are 0.5 and 0.109, respectively. Tapar Dam in India has a liquefaction area of 457 m2. This amount equals 52.33 percent of the Tapar (India) dam's entire foundation area.
The slope failure under dynamic loads and the F.O.S. values of 0.313 and 0.548 for the slopes of the river upstream and downstream of Fatehgadh dam (India), respectively, lead to the conclusion that it is unsafe. The size of the liquefaction area is 333.5 m2 of the Fatehgadh dam. The foundation area of the Fatehgadh (India) dam as a whole is represented by that figure at 78.75%.
Saluda Dam in Columbia is an unsafe slope failure under dynamic loads, and the F.O.S. values for the upstream and downstream directions are 0.102 and 0.101. Saluda Dam in Columbia has a 32095 m2 liquefaction area. This value represents 32.96% of the Saluda Dam's total foundation area (Columbia).
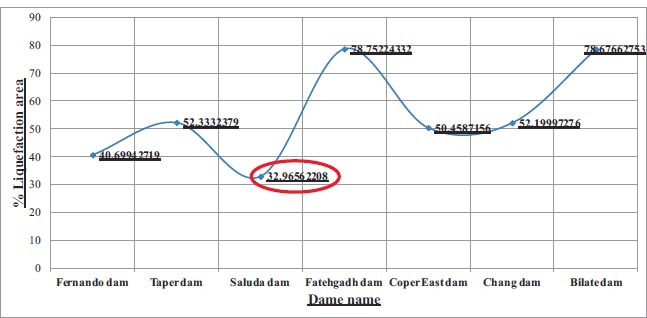
All results and discussions are presented in Table 10, Figs. (31 and 32) which show the minimum liquefaction zone area is 32.96% of the total area. The minimum percentage value of liquefaction 32.96% can be relied upon in predicting dams that may be exposed to liquefaction due to strong earthquakes affecting them.
| Dam | Height of Dam | amax | Total Area | Liquefied Area | % (Liquefied Area/Total area) |
|---|---|---|---|---|---|
| Fernando dam | 22 | 0.6g | 3317 | 1350 | 40.67% |
| Taper dam | 15.5 | 0.41g | 873.25 | 457 | 52.33% |
| Saluda dam | 116 | 0.6g | 97359 | 32095 | 32.96% |
| Fatehgadh dam | 11.6 | 0.3g | 423.48 | 333.5 | 78.75% |
| Chang dam | 15.5 | 0.5g | 220.23 | 114.96 | 52.20% |
| Bilate dam | 42.5 | 0.24g | 937 | 737.2 | 78.67% |
CONCLUSION AND RECOMMENDATIONS
For earthen dams that are going to be built in seismically active areas, a dynamic stability analysis needs to be done. Three different operational load circumstances were utilized to test the dam embankment's upstream and downstream slopes. The case studies provided are excellent illustrations of the various phases of liquefaction analysis in earth-filled embankments. All dams collapse in seismic conditions and with a safety factor of less than 1.0 due to the liquefaction that earthquakes cause.
The Ethiopian Bilate Dam is safe against slope failure under static loads; the Bilate Dam is unsafe after earthquake loads and a liquefaction area of 737.2 m2. This amount equals 78.67% of the Bilate dam's foundation area.
The Lower San Fernando Dam is unsafe under dynamic loads, and the F.O.S. values for the upstream and downstream directions are 0.264 and 0.183, respectively. The Lower San Fernando dam's liquefaction area is 1350 m2. This amount equals 40.67% of the Bilate dam's foundation area.
Tapar (India) dam is unsafe due to slope failure under dynamic loads, and the F.O.S. values for the upstream and downstream directions are 0.5 and 0.109, respectively. Tapar Dam in India has a liquefaction area of 457 m2. This amount equals 52.33% of the Tapar (India) dam's foundation area.
Fatehgadh dam (India), the slope failure under dynamic loads and the F.O.S. values of 0.313 and 0.548 for the slopes of the river upstream and downstream, lead to the conclusion that it is dangerous. 333.5 m2 is the size of the liquefaction area of the Fatehgadh dam in India. The foundation area of the Fatehgadh (India) dam as a whole is represented by that figure at 78.75%.
Saluda Dam in Columbia is an unsafe slope failure under dynamic loads, and the F.O.S. values for the upstream and downstream directions are 0.102 and 0.101. Saluda Dam in Columbia has a 32095 m2 liquefaction area. This value represents 32.96% of the Saluda Dam's total foundation area (Columbia). According to Fig. (32) and Table 10, the minimum liquefaction zone area is 32.96%. As a result, software creation is crucial for Earth Dam security.
It appears that the straightforward and reasonably priced technology can quickly analyze the seismic safety of similarly constructed earth dams without taking earthquake loading into account.
LIST OF ABBREVIATIONS
| MST | = Ministry of Science and Technology |
| FERC | = Federal Energy Regulatory Commission |
| CRR | = Cyclic Resistance Ratio |
| CSR | = The Critical Stress Ratio |
| AAPD | = The Average Absolute Percentage Difference |
| AME | = The Absolute mean Error |
| EERI | = Earthquake Engineering Research Institute |
| BDS | = The British Dam Society at the Institution of Civil Engineers |
| USACE | = Engineering Manual 1110-2-1902 Department of the Army, Corps of Engineers |
| F.O.S | = Factor of Safety for Upstream and Downstream Slopes |
CONSENT FOR PUBLICATION
Not applicable.
AVAILABILITY OF DATA AND MATERIALS
The data and supportive information are available within the article.
FUNDING
None.
CONFLICT OF INTEREST
The authors declare no conflict of interest, financial or otherwise.
ACKNOWLEDGEMENTS
Declared none.

