All published articles of this journal are available on ScienceDirect.
Analysis of Flood Incidents in Manado City due to Rainfall Fluctuations (Case Study of the Tondano Watershed), Indonesia
Abstract
Background
Fluctuating rainfall intensity refers to the fluctuations or variations in the pattern of rainfall intensity over time in a certain area. This encompasses changes in intensity, duration, frequency, and spatial distribution of rainfall intensity occurring within a specific time frame.
Objective
This study investigates the fluctuation of rainfall and its relationship with flood occurrences in Manado City, particularly in the Tondano Watershed Area (DAS Tondano).
Results
The analysis indicates that average rainfall intensity > 21.79 mm and cumulative rainfall > 52.64 mm, maximum rainfall intensity > 64 mm, and cumulative rainfall > 99.10 mm serve as threshold points for the onset of floods in Manado City.
Conclusion
Recommendations are made for continuous rainfall data collection in the Tondano Watershed area, especially Manado City, to support more effective flood control planning. The conclusions drawn from this analysis provide valuable insights into understanding and addressing flood risks in the region.
1. INTRODUCTION
Water is one of the most vital natural resources for meeting the needs of many people, thus requiring protection to provide significant benefits for human life and other biological systems. Proper management and conservation of water resources are essential for sustaining ecosystems, supporting agriculture, and ensuring access to clean water for future generations. Effective water management not only helps in maintaining the health of natural habitats but also in addressing challenges related to water scarcity and quality, thereby supporting economic development and improving the quality of life for communities around the world [1]. Hydrology is the science that studies all aspects related to water on Earth, including its circulation, distribution, movement, utilization, development, management, and all matters related to water. As a primary medium in the hydrological cycle, water plays a crucial role, making rainfall intensity significantly impact flood phenomena [2]. Rainfall intensity refers to the amount of water falling to the ground surface during a certain period in specific units, estimated in millimeters (mm) above flat surfaces. This measurement helps assess the rate of precipitation, which is crucial for understanding the potential for surface runoff, flood risks, and water resource management. By analyzing the intensity and duration of rainfall, we can better predict how much water will be absorbed by the soil versus how much will contribute to runoff. Accurate data on rainfall intensity is essential for effective planning and response to weather-related challenges, as it enables the development of strategies to mitigate flood risks, manage water resources efficiently, and adapt to changing climate conditions [3].
Fluctuating rainfall intensity refers to variations or fluctuations in the pattern of rainfall intensity over time in a particular area. This includes changes in intensity, duration, frequency, and spatial distribution of rainfall intensity occurring within a certain time frame. Causes of fluctuating rainfall intensity can vary and are often complex, including factors such as global climate change that can lead to fluctuations in rainfall patterns worldwide [4]. Rising global temperatures can affect atmospheric circulation, alter wind patterns, and trigger changes in rainfall distribution, leading to more extreme weather events. Natural phenomena such as El Nino and La Nina significantly impact rainfall patterns in several regions. El Nino can cause increased rainfall in some areas while resulting in droughts elsewhere [5]. Leading to significant disruptions in water availability and ecosystem health. Local influences, such as topography, vegetation, and land use, can also affect rainfall fluctuations in an area. For example, mountainous areas may experience higher rainfall due to orographic effects. Given its significant impact on various aspects of human life and the environment, the issue of fluctuating rainfall must be understood. Changes in precipitation patterns overall affect flood risks in multiple areas. In general, floods are events where land areas not typically inundated by water, especially those not swampy, become submerged in water. High rainfall intensity and low-lying or basin-shaped topography are causes of floods. Low soil infiltration boundaries also trigger flood disasters, so the soil cannot absorb water as expected [6]. North Sulawesi is one of the regions experiencing diverse rainfall variations, thus requiring studies to investigate rainfall fluctuations using spectral approaches [7].
Manado City is the capital city of North Sulawesi Province, with a population of 454.606 [8]. Manado City, which has a wet tropical climate with relatively stable temperatures throughout the year, experiences the driest climate around August and the wettest in January [9]. Unexpected or extreme rainfall intensity can cause damaging floods, threaten safety, and disrupt the daily lives of communities. Flood disasters occur in Manado City, especially during the rainy season. As a result, North Sulawesi Province, particularly Manado City, is considered one of the most flood-prone areas in Indonesia [10]. Over the past decade, floods have occurred almost every year in Manado City, causing losses to its residents [11].
The greater the frequency or return period of rain, the greater the intensity. The known intensity of rain in an area can cause flooding [12]. Flood events in an area have a close relationship with cumulative daily and annual rainfall [13]. The value of rain intensity in an area can determine the occurrence of flooding in that area. Flood events in an area have a close relationship with cumulative daily and annual rainfall [14].
Thiessen polygons are used to calculate average rainfall, where they are used to measure rainfall in a specific region based on estimated rainfall intensity information from various locations within that area [15] [16]. By applying the Thiessen polygon method, each polygon represents a zone where the rainfall measurement from a central point is used to estimate the average rainfall over the entire polygon. This approach helps in creating a more accurate representation of rainfall distri- bution across the region. The regional area can be divided into homogeneous sub-areas using Thiessen polygons, and the rainfall in each sub-area is considered equal to the rainfall intensity at the center of the polygon [17]. This technique simplifies the calculation process by assuming that the precipitation is evenly distributed within each polygon. Consequently, it allows for effectively aggregating rainfall data, facilitating better flood risk assessments and hydrological analyses.
The purpose of studying rainfall fluctuations concer- ning flood occurrences is to understand the relationship between variations in rainfall patterns, cumulative rainfall, and the tendency of floods. The correlation between rainfall intensity and flood occurrences refers to the statistical relationship between the patterns of rainfall intensity, cumulative rainfall, and the likelihood of floods. Thus, the relationship between the pattern of rainfall intensity, cumulative rainfall, and the possibility of flooding will provide an early warning of the amount of rainfall.
2. MATERIALS AND METHODS
2.1. Study Area
This research is located in Manado City, North Sulawesi Province, Indonesia. Manado City is the capital of North Sulawesi Province and is located at the northern tip of Sulawesi Island, between 124°40' - 124°50' East Longitude and 1°30' - 1°40' North Latitude. Manado city map can be seen in Fig. (1).
2.2. Method
In this study, data utilized to ascertain the correlation between rainfall and flood occurrences, particularly floods in the watershed that most frequently experience flooding, include watershed maps, rainfall data, and flood disaster data. Additionally, cumulative rainfall data is necessary to compare rainfall intensity during flood events and before flood events, enabling the identification of safe and unsafe areas based on graphs. This study used the Thiessen polygon method to obtain average rainfall because the Thiessen polygon is one of the most widely used and important methods. Its calculation method is fast, simple, and somewhat accurate, providing reliable estimates of spatial rainfall distribution that are essential for effective flood risk management. By analyzing these data, the study aims to improve flood prediction and response strategies.
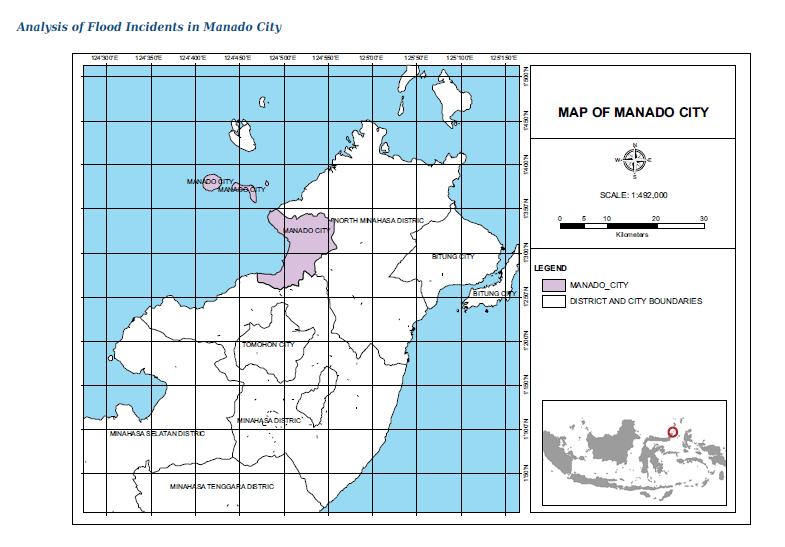
Map of Manado city.
| Date | Occurrences |
|---|---|
| 11/15/2022 | Floods |
| 10/26/2022 | Floods |
| 3/3/2022 | Floods |
| 12/7/2021 | Floods |
| 1/22/2021 | Floods |
| 1/16/2021 | Floods |
| 3/2/2020 | Floods |
| 2/1/2019 | Floods |
| 4/29/2018 | Floods |
| 3/19/2018 | Floods |
| 3/18/2018 | Floods |
| 2/7/2018 | Floods |
| 3/20/2017 | Floods |
| 1/26/2017 | Floods |
| 12/16/2016 | Floods |
| 1/11/2015 | Floods |
| 1/15/2014 | Floods |
| 2/17/2013 | Floods |
| 12/9/2010 | Floods |
| 5/22/2010 | Floods |
| 1/13/2009 | Floods |
| 5/5/2008 | Floods |
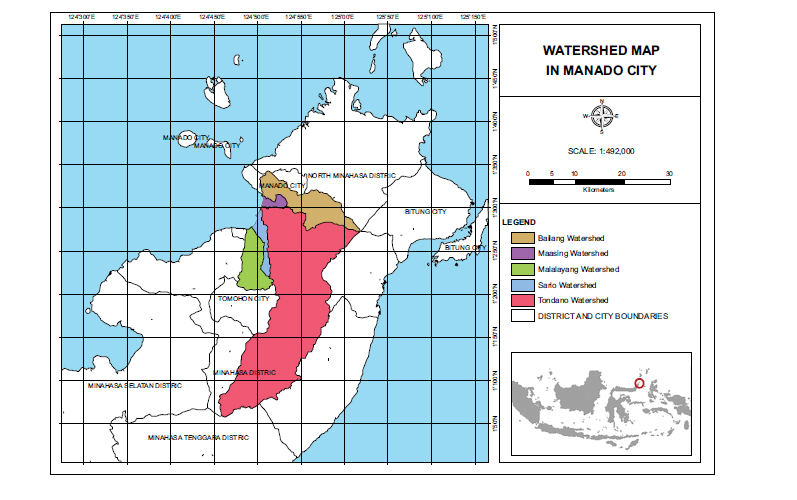
Watershed map in Manado city.
The data used in this research is secondary data. Secondary data was obtained from data and reports sourced from relevant agencies, including rainfall data and the location of rain observation posts from the North Sulawesi Watershed Area Center (BWS) and data on flood events that occurred from 2008 to 2020 obtained from the national disaster management agency (BNPB).
Therefore, the information obtained from this study is expected to serve as a useful initial step in formulating plans or strategies to organize, implement, control, and monitor water flow in the watershed areas most prone to flooding, especially in Manado City.
Table 1 below provides a record of flood disaster data that occurred in Manado City over the past decade, from 2008 to 2022.
5 watersheds are contributing to the administrative area of the city of Manado, namely, Tondano Watershed, Sario Watershed, Malalayang Watershed, Bailang Watershed, and Maasing Watershed. This study will focus on the Tondano watershed that has experienced the most floods over the past 14 years, from 2008 to 2022. Fig. (2) shows the map of the city of Manado's watershed.
2.2.1. Thiessen Polygon Method
The Thiessen polygon was proposed by A. H. Thiessen (1911). The Thiessen polygon is one of the most widely used and important methods in precipitation analysis. Its calculation method is fast, simple, and somewhat accurate, making it a practical choice for many applications. The Thiessen Polygon method is a technique used in precipitation analysis to divide a region into smaller areas called Thiessen polygons [18, 19]. Each point representing rainfall intensity within the area becomes the focal point of the nearest Thiessen polygon, allowing for a localized assessment of rainfall distribution. This strategy estimates the rainfall in a specific area based on the rainfall intensity data from particular locations, thus providing a more detailed understanding of spatial variability. By using Thiessen polygons, a region can be divided into homogeneous sub-regions, where the rainfall within each sub-region is considered equal to the rainfall at the polygon center [20]. This approach helps in creating more accurate rainfall maps and forecasts. The Thiessen polygon method provides a weighted sum of the observations by using a graphical method to define the relative polygonal areas associated with each single station observation [21]. This technique ensures that each observation contributes proportionally to the overall rainfall estimate, enhancing the reliability of the results.
The steps to find the average rainfall using the Thiessen Polygon method are as follows:
2.2.1.1. Identify Rain Gauge Locations
Determine the locations of the rain gauge stations within a watershed area.
2.2.1.2. Create Thiessen Polygons
Construct Thiessen Polygons around each rain gauge station. These polygons should be made up of straight lines forming boundaries equidistant between the nearest stations.
2.2.1.4. Determine Total Rainfall
Calculate the rainfall recorded at each rain gauge station over a specific period.
2.2.1.5. Compute Average Rainfall for Each Polygon
Divide the total rainfall at each station by the area of the corresponding Thiessen polygon to obtain the average rainfall value for each polygon.
2.2.1.6. Estimate Regional Average Rainfall
The average rainfall for each Thiessen polygon is then considered representative of the average rainfall for the respective subregion.
Then, the average rainfall is calculated using the following (Eq 1):
 |
(1) |
With:
 = Average rainfall intensity
R1, R2, ... , Rn = Rainfall intensity at each observation point, with n being the number of observation points.
A1, A2, ... , An = Area represented by each observation station.
3. RESULTS AND DISCUSSION
3.1. Flood Event Classification
Flood disasters are highly likely to occur in low-lying areas. Most of Manado City's territory is situated in low-lying areas, making it susceptible to flood disasters during periods of high rainfall.
Recordings of flood events in Manado City still encompass all watershed areas, thus necessitating data classification. To identify the watershed areas that have experienced the most frequent floods over the past 14 years, flood event data in Manado City needs to be classified for each respective watershed area present in the city. The results of the flood event classification in various watershed areas, along with the intensity of rainfall during flood events in Manado City, are presented in the following table.
The Tondano River basin has 4 rain observation stations: Tikala Sawangan Station, Tikala Kaleosan Station, Rumengkor Station, and Bailang Kayuwatu Station. From the observation, the highest rainfall was found at the Bailang Kayuwatu rain observation station on February 17, 2013, with a rain intensity of 194.3 mm. The second was on January 15, 2014, with a rain intensity of 183 mm, and is in the observation area of Rumengkor rain station, where on the same date there was also a flash flood in Manado City, which claimed many victims. More details on the date of the flood, rain station, and rain intensity in the Tondano River basin can be seen in Table 2.
| Date |
Tikala Sawangan (mm) |
Tikala Kaleosan (mm) |
Rumengkor (mm) |
Bailang Kayuwatu (mm) |
|---|---|---|---|---|
| 15/11/2022 | 50 | 71 | 50.5 | 0 |
| 26/10/2022 | 100 | 68.5 | 7.5 | 10.1 |
| 3/3/2022 | 25 | 35 | 64 | 31.5 |
| 16/07/2021 | 5 | 135 | 95.5 | 0 |
| 22/01/2021 | 25 | 98.9 | 24.8 | 33.2 |
| 16/01/2021 | 50 | 149.5 | 113.5 | 0 |
| 1/2/2019 | 76 | 128.4 | 30 | 0 |
| 29/04/2018 | 67 | 30.6 | 31.5 | 0 |
| 19/03/2018 | 65 | 46 | 65 | 0 |
| 18/03/2018 | 70 | 64 | 65 | 13.2 |
| 7/2/2018 | 40 | 103.5 | 45 | 7.4 |
| 20/03/2017 | 50.2 | 58 | 87 | 37.2 |
| 26/01/2017 | 70 | 75.5 | 41 | 0 |
| 16/12/2016 | 70 | 104 | 0.5 | 25 |
| 11/1/2015 | 90 | 90 | 0 | 18.2 |
| 15/01/2014 | 170.7 | 171.5 | 183 | 123 |
| 17/02/2013 | 180.4 | 80.6 | 146.6 | 194.3 |
| 9/12/2010 | 123 | 76.1 | 10 | 0 |
| 5/5/2008 | 0 | 44 | 72 | 0 |
Sario River basin has 4 rain observation stations: Tikala Sawangan station, Tikala Kaleosan station, Rumengkor station, and Bailang Kayuwatu station. From the observation, the highest rainfall was on January 15, 2014, with all rain intensity above 100 mm, and on the same date, flash floods occurred in Manado City, which claimed many victims. More details on the date of flooding, rainfall stations, and rainfall intensity in the Sario River basin can be seen in Table 3.
Malalyang watershed, with 2 rain observation stations, Malalayang Kakaskasen station, and Malalayang Tinoor station, has not had too many flood events. There were 7 flood events in the Malalayang watershed. From the observations, the highest rainfall was on January 16, 2021, with a rain intensity of 156.4 mm. More details on the date of the flood, the rain station, and the rain intensity in the Sario River basin can be seen in Table 4.
| Date | MRG Malalayang Kakaskasen (mm) | MRG Tikala Rumengkor (mm) | MRG Tikala Sawangan (mm) | MRG Tikala Kaleosan (mm) |
|---|---|---|---|---|
| 15/11/2022 | 33 | 50.5 | 50 | 71 |
| 26/10/2022 | 55 | 7.5 | 100 | 68.5 |
| 3/3/2022 | 27 | 64 | 25 | 35 |
| 7/12/2021 | 33 | 15 | 100 | 30.4 |
| 16/07/2021 | 63 | 95.5 | 5 | 135 |
| 22/01/2021 | 36 | 6.8 | 25 | 80.8 |
| 16/01/2021 | 91 | 113.5 | 50 | 149.5 |
| 1/2/2019 | 89 | 30 | 130 | 128.4 |
| 19/03/2018 | 0 | 65 | 65 | 46 |
| 18/03/2018 | 8 | 65 | 70 | 64 |
| 20/03/2017 | 16 | 0 | 70 | 58 |
| 16/12/2016 | 45 | 0.5 | 70 | 104 |
| 15/01/2014 | 145 | 183 | 170.7 | 171.5 |
| 17/02/2013 | 2 | 146.6 | 180.4 | 80.6 |
| Date | MRG Malalayang Kakaskasen (mm) | MRG Malalayang Tinoor (mm) |
|---|---|---|
| 15/11/2022 | 33 | 29.7 |
| 26/10/2022 | 55 | 17.5 |
| 7/12/2021 | 33 | 29 |
| 16/07/2021 | 63 | 101.6 |
| 22/01/2021 | 36 | 103.8 |
| 16/01/2021 | 91 | 156.4 |
| 16/12/2016 | 45 | 62.4 |
| Date | MRG Bailang Kayuwatu (mm) |
|---|---|
| 22/01/2021 | 33.2 |
| 16/01/2021 | 0 |
| 2/3/2020 | 5 |
| 1/2/2019 | 0 |
| 19/03/2018 | 0 |
| 18/03/2018 | 13.2 |
| 20/03/2017 | 55.2 |
| 26/01/2017 | 9.8 |
| 16/12/2016 | 25 |
| 11/1/2015 | 18.2 |
| 15/01/2014 | 123 |
| 9/12/2010 | 0 |
| 13/01/2009 | 0 |
| Date | MRG Bailang Kayuwatu (mm) |
|---|---|
| 26/10/2022 | 10.1 |
| 3/3/2022 | 31.5 |
| 7/12/2021 | 26 |
| 22/01/2021 | 33.2 |
| 16/01/2021 | 0 |
| 2/3/2020 | 5 |
| 1/2/2019 | 0 |
| 29/04/2018 | 0 |
| 19/03/2018 | 0 |
| 18/03/2018 | 13.2 |
| 20/03/2017 | 55.2 |
| 26/01/2017 | 9.8 |
| 16/12/2016 | 25 |
| 11/1/2015 | 18.2 |
| 15/01/2014 | 123 |
| 17/02/2013 | 194.3 |
| 13/01/2009 | 0 |
The Bailang watershed only has 1 rain observation station, Bailang Kayuwatu station. In the record, there were 8 flood events in the Bailang River basin. From the observation, the highest rainfall was on January 15, 2014, with a rain intensity of 123 mm. This river basin is also one of the contributors to flash floods in Manado. More details on the date of flooding, rainfall stations, and rainfall intensity in the Sario River basin can be seen in Table 5.
The Maasing River basin has only one rain observation station, Bailang Kayuwatu station. In the record, there were 12 flood events in the Bailang River basin. The highest observed rainfall was on February 17, 2013, with a high rain intensity of 194.3 mm. To see more details on the date of flooding, rain stations, and rain intensity in the Sario River basin, see Table 6.
Based on the classification of flood disaster data, it is known that there have been 19 flood incidents in the Tondano Watershed area. Thus, the Tondano Watershed area is the most frequently affected by floods in the city of Manado. Here is a map of the Tondano Watershed area. The Tondano River watershed map can be seen in Fig. (3). Tondano River is the third longest river.in North Sulawesi, after the Poigar River and Ranoyapo River. Ranoyapo River. It has a length of 39.9 km and a watershed area of 544.75 km2 and empties into Manado Bay. This river has an important role in supporting the life of North Sulawesi. Important role in supporting the life of the people of Tondano, Manado, and surrounding areas, among others Tondano, Manado, and surrounding areas, among others, as a hydroelectric power plant (PLTA) in Tonsea Lama and Tanggari I and II, as the main source of drinking water for the people of Manado and Minahasa (PDAM Manado and Minahasa). But as we can see in the table, the Tondano watershed is the watershed that causes the biggest flood in Manado City.
With the Tondano watershed as the most flooded watershed and causing the largest flood in the city of Manado, we took the location of this watershed as our research location.
3.2. Analysis Rainfall Intensity
The flood event classification data indicates that the Tondano Watershed Area experiences flooding almost every year. To further understand this, a rainfall analysis was conducted to determine the rainfall intensity during flood events as well as the cumulative rainfall calculated for 7 days before the flood occurrence. Rainfall analysis was conducted to find the relationship between average rainfall intensity and cumulative rainfall and the occurrence of flooding.
Rainfall is the most critical input in the hydrological process because the amount of rainwater falling into the river is converted into flow through surface runoff or groundwater flow [22]. Rainfall is a major factor in causing floods in river basins. The critical rainfall amount, determined by studying typical rainfall patterns, is a key indicator for predicting floods [23]. Cumulative rainfall, on the other hand, is the combined precipitation occurring over a specific period, measured from the beginning of that period up to a particular point in time. This metric aggregates all rainfall over the designated period and is often estimated in units of volume, such as millimeters or centimeters [24].
3.2.1. Thiessen Polygon Method for Average Rainfall
To determine the average rainfall intensity during flood events, an analysis using the Thiessen Polygon method was conducted. By following the steps to find the average rainfall using the Thiessen Polygon method, the Thiessen Polygon method provides a way to accurately estimate the average rainfall over a defined area, helping to analyze and understand rainfall distribution during flood events. Fig. (4) shows the application of Thiessen polygons to the Tondano watershed with four rainfall stations.
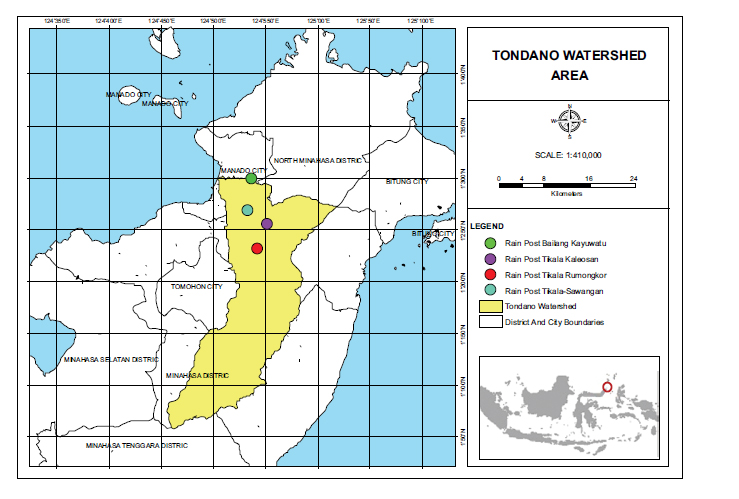
Tondano watershed area.
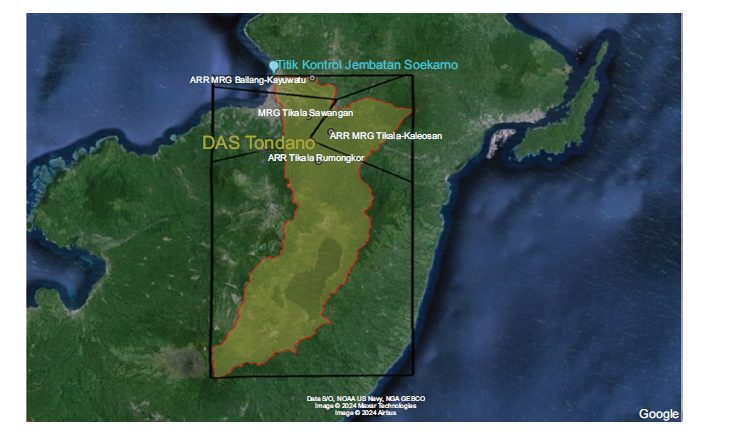
Thiessen polygon.
Based on the results of the analysis of the Thiessen polygon, the area obtained can be seen in Table 7.
The average rainfall is calculated based on Eq. (1) and the results are shown in Table 8. Therefore, the average rainfall during the flooding event in the Tondano Watershed area is as follows.
| Station | MRG Tikala Sawangan | MRG Tikala Kaleosan | ARR Tikala Rumengkor | MRG Bailang Kayuwatu |
|---|---|---|---|---|
| Area (km2) | 43.26 km2 | 83.63 km2 | 393.47 km2 | 22.71 km2 |
| Date | Rainfall (mm) |
|---|---|
| 15/11/2022 | 51.51 |
| 26/10/2022 | 24.37 |
| 3/3/2022 | 55.07 |
| 16/07/2021 | 90.38 |
| 22/01/2021 | 36.58 |
| 16/01/2021 | 109.24 |
| 1/2/2019 | 47.56 |
| 29/04/2018 | 32.87 |
| 19/03/2018 | 59.36 |
| 18/03/2018 | 63.08 |
| 7/2/2018 | 52.04 |
| 20/03/2017 | 77.52 |
| 26/01/2017 | 46.91 |
| 16/12/2016 | 23.00 |
| 11/1/2015 | 21.79 |
| 15/01/2014 | 177.74 |
| 17/02/2013 | 141.12 |
| 9/12/2010 | 28.76 |
| 5/5/2008 | 58.94 |
| Sawangan (mm) | Kaleosan (mm) | Rumengkor (mm) | Bailang Kayuwatu (mm) |
|---|---|---|---|
| 125 | 150.5 | 94 | 23 |
| 85 | 129 | 61 | 2.5 |
| 56 | 179 | 87 | 96.6 |
| 59 | 177.1 | 159 | 7.5 |
| 250 | 275.1 | 148 | 63 |
| 60 | 200.1 | 166 | 64 |
| 116 | 210 | 57 | 4.3 |
| 101 | 95.1 | 103 | 6.5 |
| 65 | 133 | 79 | 11.9 |
| 2 | 102 | 24 | 11.9 |
| 106 | 194 | 176 | 48.1 |
| 33 | 18.8 | 71 | 86.7 |
| 106 | 229.5 | 72 | 0 |
| 151 | 171.5 | 99 | 66.1 |
| 267 | 196 | 0 | 27.9 |
| 313 | 440 | 373 | 560.7 |
| 298 | 161.9 | 265 | 323.6 |
| 104 | 80.2 | 25 | 0 |
| 186 | 135.5 | 77 | 0 |
To establish a link between average rainfall intensity and flood events, only flood events were reported in the Tondano Watershed. After the classification of rainfall events described in Table 2, we verified whether the dates of the reported flood events coincided with the rainfall or with a heavy rainfall event. The comparison of information on flood events and the rainfall data analysis indicated a threshold amount of rainfall above which flooding events can occur.
3.3. Cumulative Rainfall
To calculate the cumulative rainfall, 7 days are used in this study. Using the available rainfall data, the total amount of rainfall occurring over the 7 days leading up to the flood event is calculated. The cumulative rainfall values obtained are as follows: Tables (9-11).
The results of the average cumulative rainfall analysis in the Tondano Watershed area are presented in the following Table (10).
The correlation between the magnitude of average rainfall intensity and average cumulative rainfall is presented in Fig. (5).
| No. | Cumulative Rainfall (mm) |
|---|---|
| 1 | 101.84 |
| 2 | 70.58 |
| 3 | 99.10 |
| 4 | 147.49 |
| 5 | 172.36 |
| 6 | 158.25 |
| 7 | 83.02 |
| 8 | 97.23 |
| 9 | 83.39 |
| 10 | 33.39 |
| 11 | 167.85 |
| 12 | 60.60 |
| 13 | 96.17 |
| 14 | 112.84 |
| 15 | 52.64 |
| 16 | 386.37 |
| 17 | 254.32 |
| 18 | 38.56 |
| 19 | 91.47 |
| No. | Rainfall Intensity During Flood (mm) | Cumulative Rainfall (mm) |
|---|---|---|
| 1 | 51.51 | 101.84 |
| 2 | 24.37 | 70.58 |
| 3 | 55.07 | 99.1 |
| 4 | 90.38 | 147.49 |
| 5 | 36.58 | 172.36 |
| 6 | 109.24 | 158.25 |
| 7 | 47.56 | 83.02 |
| 8 | 32.87 | 97.23 |
| 9 | 59.36 | 83.39 |
| 10 | 63.08 | 33.39 |
| 11 | 52.04 | 167.85 |
| 12 | 77.52 | 60.6 |
| 13 | 46.91 | 96.17 |
| 14 | 23 | 112.84 |
| 15 | 21.79 | 52.64 |
| 16 | 177.74 | 386.37 |
| 17 | 141.12 | 254.32 |
| 18 | 28.76 | 38.56 |
| 19 | 58.94 | 91.47 |
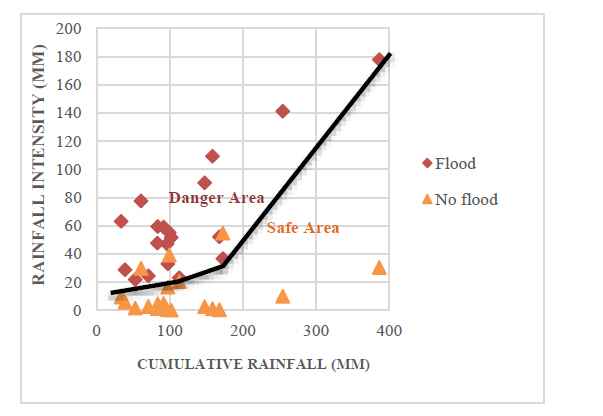
Rainfall intensity average vs cumulative rainfall.
The information from Fig. (5) indicates a correlation between the variation of the average rainfall intensity and cumulative rainfall, suggesting that flooding begins in the city of Manado if the average rainfall intensity is > 21.79 mm and cumulative rainfall is > 52.64 mm. However, there are 3 data points classified as high-risk areas with no flood occurrences.
Tarhule (2005) found that the amount of rain that accumulates before a heavy rainstorm can significantly affect whether or not flooding occurs [25]. Panthou et al. (2014) defined extreme rainfall as anything over 30 mm. They also discovered that almost all flooding events (92%) were triggered by rainstorms that produced at least 30 mm of rain [26]. Tables (12 and 13).
| No. | Max Rainfall (mm) |
|---|---|
| 1 | 71 |
| 2 | 100 |
| 3 | 64 |
| 4 | 135 |
| 5 | 98.9 |
| 6 | 149.5 |
| 7 | 128.4 |
| 8 | 67 |
| 9 | 65 |
| 10 | 70 |
| 11 | 103.5 |
| 12 | 87 |
| 13 | 75.5 |
| 14 | 104 |
| 15 | 90 |
| 16 | 183 |
| 17 | 194.3 |
| 18 | 123 |
| 19 | 72 |
| No. | Rainfall Intensity Maximum during the Flood (mm) | Intensity Cumulative Rainfall (mm) |
|---|---|---|
| 1 | 71 | 101.84 |
| 2 | 100 | 70.58 |
| 3 | 64 | 99.1 |
| 4 | 135 | 147.49 |
| 5 | 98.9 | 172.36 |
| 6 | 149.5 | 158.25 |
| 7 | 128.4 | 83.02 |
| 8 | 67 | 97.23 |
| 9 | 65 | 83.39 |
| 10 | 70 | 33.39 |
| 11 | 103.5 | 167.85 |
| 12 | 87 | 60.6 |
| 13 | 75.5 | 96.17 |
| 14 | 104 | 112.84 |
| 15 | 90 | 52.64 |
| 16 | 183 | 386.37 |
| 17 | 194.3 | 254.32 |
| 18 | 123 | 38.56 |
| 19 | 72 | 91.47 |
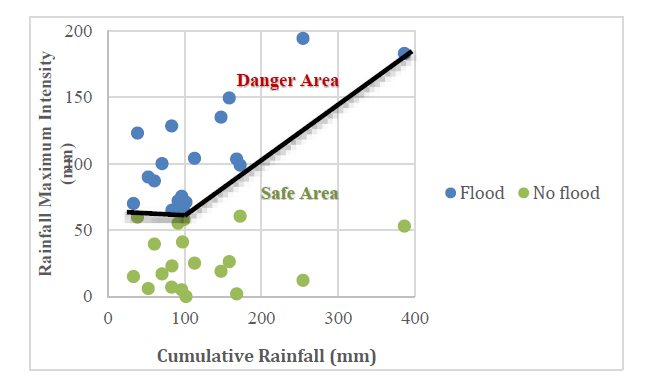
Rainfall maximum intensity vs cumulative rainfall.
The information from Fig. (6). indicates a correlation between the variation of the maximum rainfall intensity and cumulative rainfall, suggesting that flooding begins in the city of Manado if the rainfall intensity is > 64 mm with cumulative rainfall > 99.10 mm.
CONCLUSION
This study investigated flooding in the Tondano Watershed, the watershed as the most flooded watershed, and caused the largest flood in the city of Manado using a combination of rainfall data and flood events.
Analysis using average rainfall data in the Tondano Watershed indicates that flooding begins in the city of Manado if the average rainfall intensity is > 21.79 mm, with cumulative rainfall > 52.64 mm. So if there is an average rain intensity of > 21.79 mm with cumulative rain > 52.64 mm, it is indicated that it can cause flooding in Manado City.
Analysis using maximum rainfall data in the Tondano Watershed indicates that flooding begins in the city of Manado if the maximum rainfall intensity is > 64 mm, with cumulative rainfall > 99.10 mm. Recommendations for collecting rainfall intensity data in the Tondano Watershed, especially in the city of Manado, suggest continuous studies to obtain up-to-date and accurate information for flood control planning in the city of Manado.
Based on points 1 and 2, it is necessary to set up an early warning system to anticipate potential flood events.


