All published articles of this journal are available on ScienceDirect.
Finite Element Analysis of Fiber Reinforced Concrete Slabs under Torsion
Abstract
Introduction
This study has investigated the behavior and strength of steel fiber-reinforced concrete slabs under torsion using Finite Element Analysis (FEA). The research has focused on the effects of steel fiber volume ratio and reinforcement bar size on the torsional properties of concrete slabs.
Methods
A 3D solid element model with non-linear analysis has been employed using ABAQUS software to simulate the behavior of fifteen square slabs with varying fiber volume ratios and reinforcement bar sizes. The analysis has assessed the torsional properties, including cracking moment, yielding moment, ultimate moment, and stiffness.
Results
The results have indicated that using steel fibers could enhance the torsional cracking, yielding, and ultimate moments. The torsional ultimate moment has increased between 3% to 4% by using fibers with a volume ratio of 0.5%, but it has increased between 106% to 148% by using fibers with a volume ratio of 2%. The study has concluded the proper volume ratio of fibers to improve the torsional ultimate moment to be between 1% to 2%. Moreover, an increase in reinforcement bar size has led to a higher torsional ultimate moment.
Conclusion
The torsional stiffness of slabs in uncracked phases has been found to be about 14.4-30.9 times the stiffness in the cracked phase. Fiber reinforcement has been found to lead to an increase in the stiffness of the cracked phase.
1. INTRODUCTION
Reinforced concrete slabs play a vital role in various concrete structures, serving as the main components in floors, roofs, walls, and bridge decks. Torsion, a type of deformation caused by a twisting action within structural members, resulting from the fundamental structural force known as torque, often affects these slabs, but it is frequently overlooked due to its complexity. Accounting for torsional stiffness significantly alleviates bending moments. The exact theory of bending of elastic plates for the case of simply supported square slabs demonstrates that the twisting moments relieve the bending moments by about 25% [1]. Understanding the effects of torsion is crucial for safe structural design, necessitating compre- hensive knowledge of torsional effects and analytical models that can be applied in the design [2]. Fiber Reinforced Concrete (FRC) has emerged as a significant innovation in structural engineering, offering enhanced mechanical properties compared to traditional concrete. One crucial aspect of structural analysis involves understanding the behavior of FRC slabs under torsion, a fundamental loading condition encountered in various applications, such as buildings and bridges. Transitioning from traditional analysis methods to Finite Element Analysis (FEA) has become prevalent, especially from 1995 to 2015, aiding in the design of two-way concrete members [3]. Analytical solutions for torsional stiffness, such as those by Marti and Kong [4], have highlighted the importance of considering pre-cracking and post-cracking stages. May et al. [5] investigated the response of slabs to bending and twisting moments. They conducted tests on fourteen 1.6x1.6x0.15 m reinforced concrete slabs subjected to uniform bending and twisting loads. Nonlinear analysis was employed, and results were compared with experimental data. The predictions were not conservative when the twisting moment was significant. Lopes et al. [6] explored the behavior of reinforced concrete slabs under torsional stress, empha- sizing stiffness during uncracked and cracked phases. Their experimental investigation included nine slabs, varying in dimensions, subjected to pure torsion. They observed a substantial reduction in torsional stiffness during the cracked phase, approximately ranging from 1/17 to 1/15 compared to the elastic phase. Hamdy and Brahim [7] studied the torsional behavior and strength of full-scale concrete beams reinforced with Glass Fiber-reinforced Polymer (GFRP) bars and stirrups. Their findings revealed that GFRP-reinforced beams exhibited similar strength and crack patterns to those of steel-reinforced concrete beams, but showed lower post-peak torsional stiffness. Nguyen et al. [8] performed an experimental study on the torsional stiffness of reinforced concrete slabs, testing seven square slabs with dimensions of 1.9 m by 1.9 m under torsion. The study identified three distinct behavioral stages, including pre-cracking, post-cracking of the concrete, and post-yielding of the steel reinforcement. It was found that the thicker the slab, the greater its torsional stiffness, as the reinforcement meshes were placed further from the mid-plane. In a related study, Nguyen and Pham [9] explored the behavior of reinforced concrete slabs under torsion using both experimental methods and finite element analysis. They tested three square slabs (1.9 m x 1.9 m x 0.15 m) and observed the behavior in both pre-cracking and post-cracking stages. When the concrete had cracked and the steel yielded, the torsional stiffness was approximately 1/25 of the pre-cracking stiffness. Ali and Mohannad [10] investigated the torsional behavior of reinforced concrete beams with steel fibers. Four beams, one conventional and three with varying steel fiber content, were tested, revealing notable improvements in ultimate torsional strength and reduced angle of twist. Specifically, specimens with steel fiber volume ratios of 0.5%, 0.75%, and 1% demonstrated significant enhancements in torsional strength of 28.55%, 38.09%, and 49.46%, respectively, compared to the control beam. Ibraheem and Mukhlif [11] experimentally tested nine reinforced concrete slabs under pure torsion, noting the significant effects of steel reinforcement ratio and slab width on strength, stiffness, and ductility. Luca et al. [12] investigated the torsional behavior of six large-scale steel fiber-reinforced concrete beams with different transverse reinforcement. Findings revealed that steel fibers significantly enhanced torque resistance and twist of the specimens. It was also found that specimens with steel fibers exhibited higher post-cracking stiffness and smoother crack development, enhancing beam behavior at the serviceability limit state. Abdullah and Malik [13] experimentally tested twelve hollow reinforced concrete beams under torsion. Their study examined the impact of different variables, including stirrup spacing, steel fiber fraction, and the amount of longitudinal reinforcement. The results demonstrated that the torsional performance of the beams could be enhanced by increasing the fiber volume ratio, reducing stirrup spacing, and increasing the longitudinal reinforcement, leading to improved structural characteristics under torsion. Oettel [14] investigated the behavior of steel fiber-reinforced concrete beams under torsion, and the results showed that the steel fibers positively influenced the torsional load-bearing behavior. Moreover, he modified the space truss model and added the longitudinal and transverse steel fiber tension struts. This modified space truss model was validated with the database and showed a good prediction of the torsion test data. Noha et al. [15] studied the behavior of ten Self-compacting Reinforced Concrete (SCRC) beams subjected to pure torsion and strengthened using various confi- gurations of externally bonded Glass Fiber-reinforced Polymer (GFRP) strips. The results showed that the beam strengthened along its entire length with three layers of GFRP sheets achieving the highest increase in the ultimate torsional moment, with a 33.3% improvement compared to the unstrengthened beam. Furthermore, the greatest gain in energy dissipation capacity was observed when four layers of GFRP sheets, spaced 300 mm apart, were applied to the beams. Iman et al. [16] conducted an experimental and theoretical investigation regarding the impact of different fiber ratios on the structural performance of solid and hollow reinforced concrete beams under pure torsion, using polyolefin fiber. Both solid and hollow beams demonstrated enhanced torsional performance as the polyolefin fiber percentage increased up to 1.5%. Notably, the reduction in torsional strength was more significant in high-strength beams compared to normal-strength beams when comparing solid and hollow sections.
While extensive research has been conducted on the torsional behavior of beams, no studies have specifically examined the effect of fiber reinforcement on the torsional behavior of concrete slabs. This represents a significant gap in the current body of knowledge, as fiber-reinforced concrete has been shown to enhance mechanical properties, such as toughness, crack resistance, and post-cracking behavior in other structural elements. Under- standing how fiber content influences the torsional response of slabs is crucial for advancing design practices, yet this aspect remains unexplored in the literature. The motivation for this study has emerged from the need to address this gap and quantify the effects of fiber volume ratios and reinforcement bar sizes on the torsional performance of slabs. Unlike previous research focusing on beams, this study provides novel insights into the behavior of FRC slabs under torsion, where the effect of varying fiber volume ratios and reinforcement sizes on torsional stiffness and ultimate moment has been quantified. By conducting a novel numerical analysis using finite element analysis, this research could offer valuable insights that can contribute to both academia and practical engineering applications, advancing the under- standing of torsional behavior in FRC slabs and offering a basis for improved design methods. The present study has focused on analyzing the behavior of FRC slabs under torsion, specifically examining the impact of two critical variables, including fiber volume ratio and reinforcement bar size.
2. RESEARCH METHODOLOGY
In this study, an investigation of the behavior of steel fiber-reinforced slabs under torsion has been conducted. This has been achieved through a numerical analysis methodology employing the ABAQUS software. The research study has utilized 3D solid elements within a non-linear finite element analysis framework to comprehen- sively analyze the behavior and strength characteristics of fiber-reinforced concrete slabs under torsional loading conditions. The methodology has involved the develop- ment of a detailed 3D numerical model, material modeling, imposition of loading conditions, non-linear finite element analysis, and subsequent evaluation and interpretation of the results. By employing this methodology, a robust framework has been established for a thorough investi- gation into the behavior and strength properties of steel fiber-reinforced slabs under torsional loading, facilitating a comprehensive understanding of their performance.
3. SPECIMENS AND VARIABLES OF THE STUDY
This research study has conducted finite element analysis on fifteen square slabs measuring 2.8x2.8x0.15 m. These slabs have involved two steel meshes positioned at their top and bottom surfaces, with a 100 mm spacing between the steel bars. Utilizing steel fiber reinforced concrete, the study has incorporated end-hooked steel fibers measuring 25 mm in length and 0.3 mm in diameter. Examined variables have encompassed the fiber volume ratio and steel reinforcement bar size. Three groups of slabs have been examined, incorporating reinforcement bar sizes of 8 mm, 10 mm, and 12 mm, with each comprising five slabs. These slabs within each group have exhibited varying fiber volume ratios ranging from 0% to 2%. A comprehensive overview of specimen details and study variables is provided in Table 1.
4. NUMERICAL FINITE ELEMENT ANALYSIS OF THE SLABS
This study has utilized ABAQUS, a flexible software proficient in tackling a wide range of linear and nonlinear engineering challenges, to perform numerical finite element analysis on fiber-reinforced concrete slabs subjected to torsional forces.
4.1. Geometric Modeling and Boundary Conditions
Under the ABAQUS/explicit model, the initial stage has involved defining the slab geometry. Concrete slabs and support plates have been modeled using three-dimensional solid elements. Reinforcements have been specified using deformable “wire” components, represented as lines in ABAQUS/CAE. As shown in Fig. (1), the reactions have acted in the vertical direction. Supports at corners C3 and C4 have constrained downward displacements, while the C2 corner support has restricted upward displacement. A downward load has been applied at corner C1 [6, 9]. Each support and the load has involved a steel plate for even stress distribution. The downward load has been applied as a specified vertical displacement, with the use of an amplitude function (smooth step). The analysis has been conducted in step-1 (dynamic, explicit), which has been the step after the initial step.
|
Group No. |
Specimen No. |
Fiber Volume Ratio vf % |
Reinforcement Bar Size (mm) |
|---|---|---|---|
| G1 | S-00-8 | 0 | 8 |
| S-05-8 | 0.5 | 8 | |
| S-10-8 | 1 | 8 | |
| S-15-8 | 1.5 | 8 | |
| S-20-8 | 2 | 8 | |
| G2 | S-00-10 | 0 | 10 |
| S-05-10 | 0.5 | 10 | |
| S-10-10 | 1 | 10 | |
| S-15-10 | 1.5 | 10 | |
| S-20-10 | 2 | 10 | |
| G3 | S-00-12 | 0 | 12 |
| S-05-12 | 0.5 | 12 | |
| S-10-12 | 1 | 12 | |
| S-15-12 | 1.5 | 12 | |
| S-20-12 | 2 | 12 |
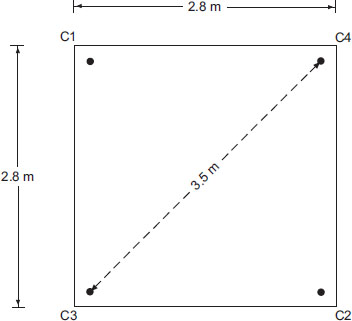
Boundary conditions of the slabs.
4.2. Material Modeling
Upon completing the geometric input, the next step has involved inputting the material properties of the specimen into ABAQUS. The following subsections provide a detailed overview of the procedures carried out in this stage.
4.2.1. Fibrous Concrete
The ABAQUS-utilized Concrete Damage Plasticity (CDP) model has been employed to characterize concrete behavior during loading. CDP accounts for concrete degradation and incorporates two primary failure mechanisms: cracking under uniaxial tension and crushing under uniaxial compression. Essential parameters for defining the concrete's plasticity model include the dilation angle (ψ), plastic potential eccentricity, biaxial-to-uniaxial compressive stress ratio (fbo/fco), the shape factor of the yielding surface (K), and viscosity parameter. Table 2 presents the CDP-required parameters that have been used in this study [17-19].
| CDP Parameters | Value |
|---|---|
| Dilation angle (ψ) | 31° |
| Eccentricity | 0.1 |
| biaxial/uniaxial ratio (fbo / fco) | 1.16 |
| K | 0.667 |
| Viscosity parameter | 0 |
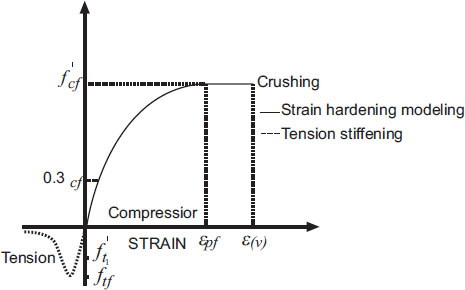
The compressive stress-strain relationship of fibrous concrete has been modeled using a strain-hardening approach shown in Fig. (2). The material model has featured a linear response up to 30% of the compressive strength, followed by a parabolic stress-strain curve until reaching the compressive strength of the fiber-reinforced concrete. Beyond this point, a perfect plastic behavior has been assumed until crushing has occurred [20, 21]. The following equations have been used for this relationship [20, 22, 23]:
 |
(1) |
 |
(2) |
 |
(3) |
Where, εpf is the strain at peak stress (f’cf), εcuf is the maximum compressive strain, Ec is the elastic modulus of plain concrete, f’c is the cylinder compressive strength of plain concrete set as 40 MPa in this study, vf is the fiber volume ratio, and lf and df are the length and diameter of the fibers, respectively.
For the stress-strain relationship of fibrous concrete in tension, the following equation represents the ascending and descending parts of the curve used for the fibrous concrete in this study [20, 24-26]:
 |
(4) |
where, ε is the tensile strain at stress ft, f’tf is the fibrous concrete tensile strength, εtf is the strain at peak stress, and ß is a fiber parameter defined according to the following equation for hooked fibers [27]:
 |
(5) |
where, R.I is the reinforcing index = wf lf /df, wf is the ratio of the weight of fibers to concrete. The following two equations can be used to determine εtf and f’tf [22]:
 |
(6) |
 |
(7) |
where, εt and f’t are the cracking strain and tensile strength of plain concrete, respectively; Nf is the number of fibers per unit area and is equal to
 , and ηo is an orientation factor and can be taken as 0.5 [22].
The degradation of concrete under tension relies on the damage parameter dt, calculated as the ratio of post-cracking tensile stress to the ultimate tensile stress [19]. Additionally, wc=0.8 denotes the compressive stiffness recovery factor, assuming significant recovery of stiffness upon crack closure during the transition from tension to compression loading.
4.3. Element Types and Mesh Generation
As shown in Fig. (3), the solid members, including both concrete and plates, were meshed using first-order hexahedral elements. Specifically, the eight-node brick type C3D8R with reduced integration and hourglass control was used, which offered effective outcomes with minimal cost in three-dimensional analyses. In terms of reinforcement, a two-node three-dimensional truss element of type T3D2 was utilized. The general dimensions of the elements were standardized at 100 mm.
5. RESULTS AND DISCUSSION
The following sections present the results, including the effect of different variables included in the study on the torsional behavior and strength of the specimens.
5.1. Load-displacement Relationship
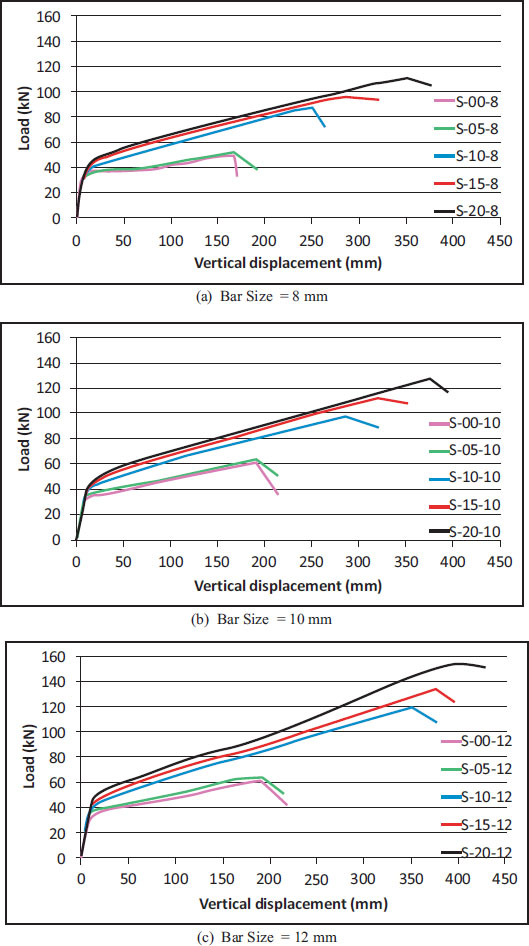
The relationship of load-displacement was determined for all slabs. Table 3 provides data for various parameters, including cracking load (Pcr) and its corresponding displacement (dcr), yielding load (Py) and its corresponding displacement (dy), as well as stiffness values for stages I (KI) and II (KII), along with their ratio. KI represents the stiffness before slab cracking, while KII reflects the tangent inclination in the cracking stage. In Fig. (4), the point (Py, dy) marks the end of stage II, indicating the beginning of steel yielding. This point is determined by the intersection of the stage II line and a horizontal line drawn from the maximum load point [6]. The value of the cracking load has been found to be increased with the increase in the volume ratio of fibers. For the slabs with a steel bar size of 12mm, the cracking load has increased to 35% (from 33.8 kN to 45.7 kN) by adding fibers with a volume ratio of 2%. A maximum increase in Py as the effect of using fibers has been 148% (from 61.3 kN for S-00-12 to 152.1 kN for S-20-12) when using a volume ratio of fibers of 2%, and for slabs with steel bar size of 12mm. The stiffness in stage I has been found to be higher than the stiffness in stage II and the maximum value for the ratio KI/KII has been obtained as 30.9.
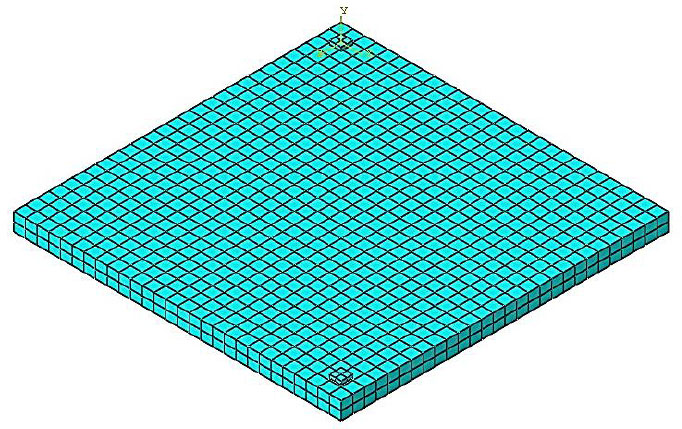
Elements and meshing.
| Specimen No. |
Pcr (kN) |
dcr (mm) |
Py (kN) |
dy (mm) |
KI (kN/mm) |
KII (kN/mm) |
KI/KII |
|---|---|---|---|---|---|---|---|
| S-00-8 | 33.3 | 11.2 | 49 | 155.1 | 2,973 | 109 | 27.3 |
| S-05-8 | 34.5 | 11.2 | 51.5 | 181.9 | 3,080 | 100 | 30.9 |
| S-10-8 | 37.1 | 11.2 | 86.2 | 242.7 | 3,313 | 212 | 15.6 |
| S-15-8 | 40.7 | 11.2 | 94.7 | 276.1 | 3,634 | 204 | 17.8 |
| S-20-8 | 42.2 | 11.2 | 108.3 | 333.4 | 3,768 | 205 | 18.4 |
| S-00-10 | 33.4 | 11.2 | 60.4 | 183.7 | 2,982 | 157 | 19.0 |
| S-05-10 | 35.4 | 11.2 | 63.3 | 187.7 | 3,161 | 158 | 20.0 |
| S-10-10 | 40.1 | 11.2 | 97 | 282.9 | 3,580 | 209 | 17.1 |
| S-15-10 | 41.8 | 11.2 | 109.8 | 310.4 | 3,732 | 227 | 16.4 |
| S-20-10 | 43.2 | 11.2 | 125.7 | 369.5 | 3,857 | 230 | 16.7 |
| S-00-12 | 33.8 | 11.2 | 61.3 | 185.8 | 3,018 | 157 | 19.2 |
| S-05-12 | 36.4 | 11.2 | 63.4 | 175.7 | 3,250 | 164 | 19.8 |
| S-10-12 | 41 | 11.2 | 117.8 | 343.1 | 3,661 | 231 | 15.8 |
| S-15-12 | 42.7 | 11.2 | 132.9 | 375.1 | 3,813 | 248 | 15.4 |
| S-20-12 | 45.7 | 11.2 | 152.1 | 386.5 | 4,080 | 284 | 14.4 |
Figs. (5 and 6) illustrate the load-displacement relationship for all slabs. The P-d curves have been found to be similar for the different slabs, but with an increase in the ultimate load and corresponding displacement with the increasing fiber volume ratio and reinforcement bar size. The ultimate load for the slab without fibers, reinforced with 8mm bars (S-00-8), has been 50 kN. In comparison, in the experimental results obtained from the work of Lopes et al. [6] for a slab with similar dimensions and reinforcement, S3.5-8-L-N(2), an ultimate load of 52 kN has been recorded. This has indicated the two results to be very close to each other.
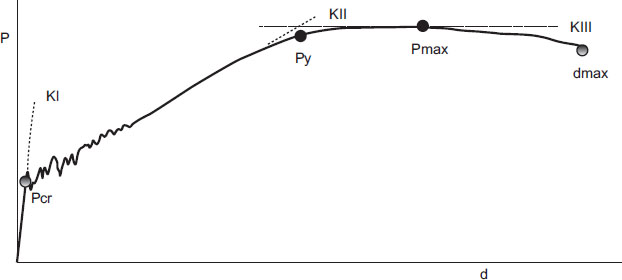
The main points in the P-d curve [6].
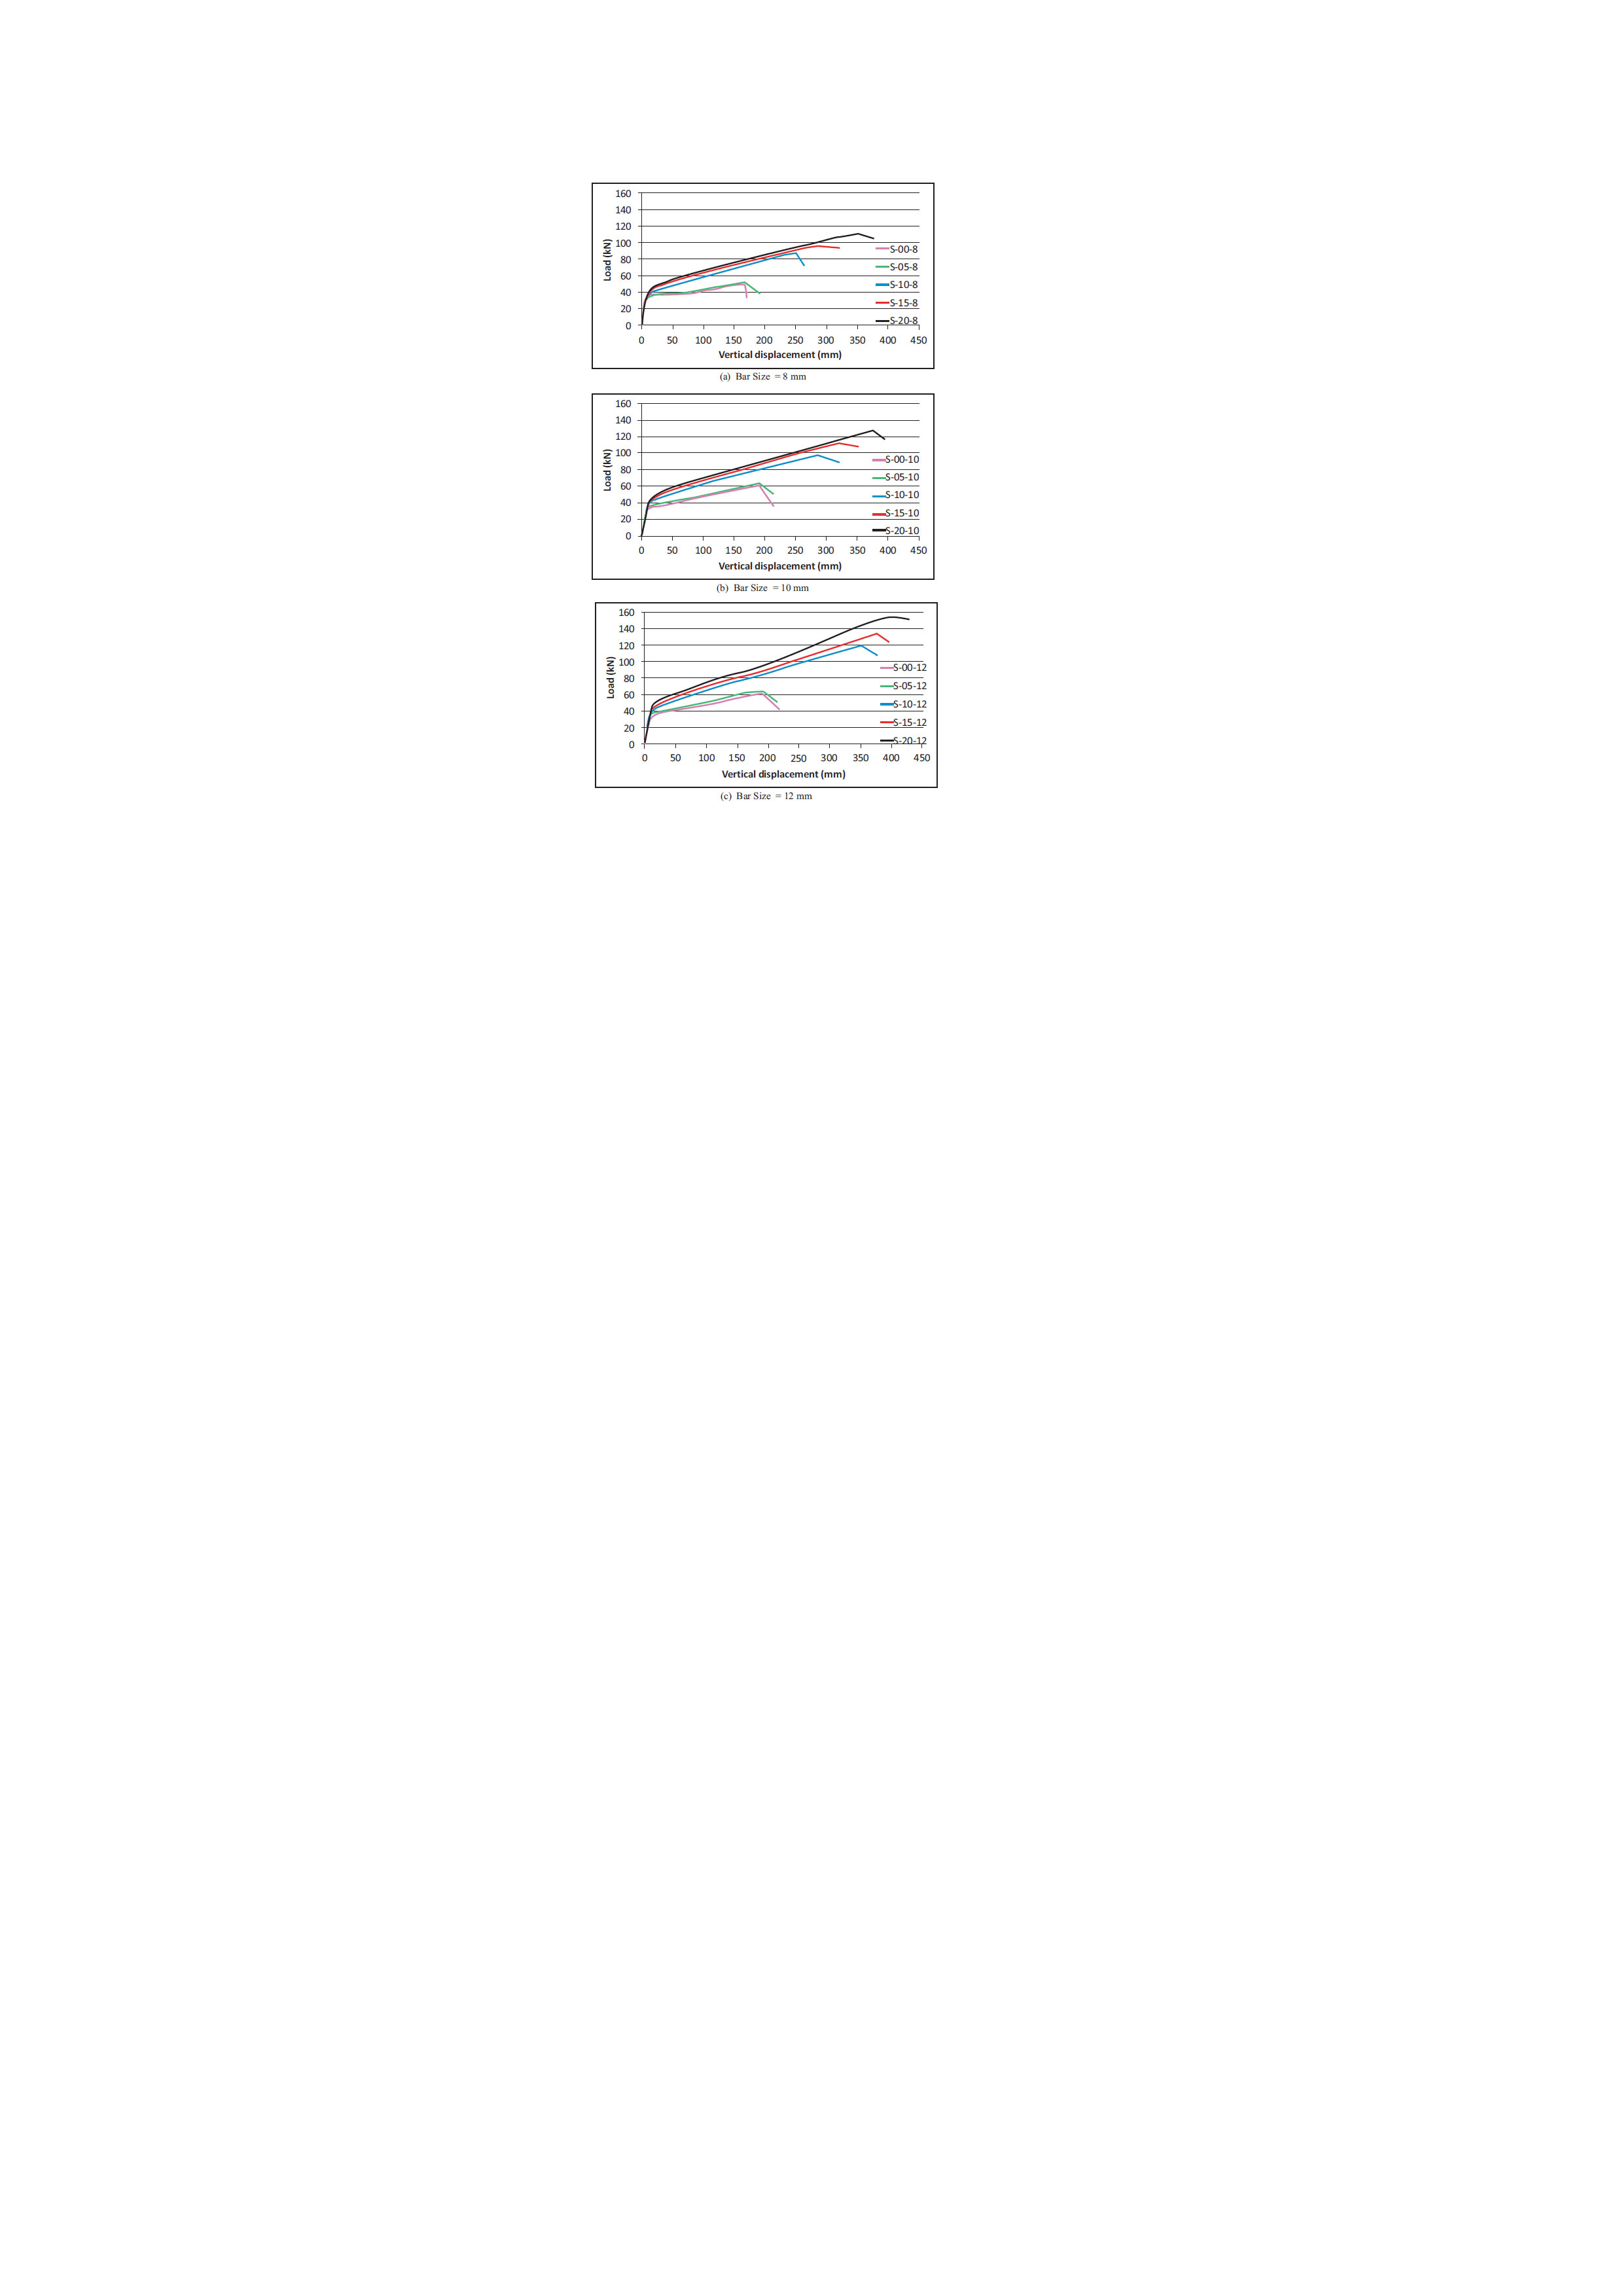
Load-displacement relationship for the specimens showing the effect of fiber volume ratio.
Load-displacement relationship for the specimens showing the effect of reinforcement bar size.
5.2. Torsional Moment-rotation Relationship
The current section outlines the torsional moment-rotation relationship. The following equation has been used to calculate the torsional moment (T) [8]:
 |
(8) |
where, T or mxy is the average torsional moment in the slab, P is the applied load in the corner C1, W represents the self-load of the slab, l=2.475 m is the lever arm of the applied load, and b=2.8 m. The slab rotation per unit length (θ) has been calculated from the following equation [6]:
 |
(9) |
where, L=3.5 m is the diagonal length of the slab.
Table 4 presents the data on torsional properties, including torsional cracking moment (Tcr) with its associated cracking rotation (θcr), torsional yielding moment (Ty) with its associated yielding rotation (θy), torsional stiffness at stage I (KTI), torsional stiffness at stage II (KTII), and their ratio. The values of torsional stiffness have been calculated using the following equations [6]:
 |
(10) |
 |
(11) |
Using fibers has been found to have an effect on the torsional cracking moment of the specimens, as this moment has increased between 27% to 35% by using a volume ratio of 2% of fibers, compared to the specimens without fibers in different groups. The maximum increase in the torsional cracking moment as the effect of using 2% of fibers has been found to be 35% (from 14.9 kN.m/m for S-00-12 to 20.2 kN.m/m for S-20-12), which has been obtained for the group of slabs with reinforcement bar size of 12 mm. Using fibers has also been found to have a significant effect on the torsional yielding moment of the specimens, as this moment has increased between 108% to 148% by using a volume ratio of 2% of fibers, compared to the specimens without fibers in different groups. The maximum increase in the torsional yielding moment as the effect of using 2% of fibers has been 148% (from 27.1 kN.m/m for S-00-12 to 67.2 kN.m/m for S-20-12), which has been obtained for the group with reinforcement bar size of 12 mm. The torsional stiffness in stage I (before cracking) has been significantly higher than the torsional stiffness in stage II (after cracking), and the ratio of KTI/KTII has ranged between 14.4 and 30.9 for the slabs in different groups. The inclusion of fibers has increased stiffness in both stages, but the increase has been more significant in stage II (after cracking). This has led to a smaller ratio of KTI/KTII when fibers have been added. For slabs with a 2% fiber volume ratio, the KTI/KTII ratio has ranged from 14.4 to 18.4, compared to a range of 19 to 27.3 for slabs without fibers. When comparing these findings to previous experimental studies, Peng and Wong [28] reported a ratio of KTI/KTII of 25 for reinforced concrete slabs without fibers, being consistent with the results of the current study.
Tables 5 and 6 present the torsional ultimate moment for all slabs. Table 5 has been arranged to present the effect of the fiber volume ratio on the torsional ultimate moment of the slabs. The slabs have been arranged in groups, and each group has exhibited a different reinforcement bar size. The last column of the table presents the percentage of the torsional ultimate moment of the specimens to the torsional ultimate moment of the case without fiber reinforcement for each group. Using fibers has been found to have a significant effect on the torsional ultimate moment of the specimens, as this moment has increased between 106% to 148% by using a volume ratio of 2% of fibers, compared to the specimens without fibers in different groups. The maximum increase in torsional ultimate moment as the effect of using 2% of fibers has been 148% (from 27.4 kN.m/m for S-00-12 to 67.9 kN.m/m for S-20-12), which has been obtained for the group of slabs with reinforcement bar size of 12 mm. On the other side, the torsional ultimate moment has increased only between 3% to 4% by using fibers with a volume ratio of 0.5%. Meanwhile, this moment has increased in the range of 58%-92% by using fibers with a volume ratio of 1%. This has suggested the proper volume ratio of fibers to improve the torsional ultimate moment of specimens included in the study to be between 1% to 2%. Table 6 has been arranged to present the effect of reinforcement bar size on the torsional ultimate moment of the slabs. The slabs have been arranged in groups, and each group has involved a different fiber volume ratio. The last column of the table presents the percentage of the torsional ultimate moment of the specimens to the torsional ultimate moment of the case of reinforcement bar size of 8 mm for each group. The torsional ultimate moment has been found to be increased with the increase in the bar size of the specimens. This moment has increased in the range of 24% -39% by using a bar size of 12 mm instead of 8 mm in different groups. A maximum increase in torsional ultimate moment as the effect of changing bar size from 8 mm to 12 mm has been 39% for both groups of slabs with a fiber volume ratio of 1.5% and 2%, respectively.
| Specimen No. |
Tcr (kN.m/m) |
θcr (rad/m) |
Ty (kN.m/m) |
θy (rad/m) |
KTI (kN/rad/m) |
KTII (kN/rad/m) |
KTI/KTII |
|---|---|---|---|---|---|---|---|
| S-00-8 | 14.7 | 0.0018 | 21.7 | 0.0253 | 8,048 | 295 | 27.3 |
| S-05-8 | 15.2 | 0.0018 | 22.8 | 0.0297 | 8,338 | 270 | 30.9 |
| S-10-8 | 16.4 | 0.0018 | 38.1 | 0.0396 | 8,967 | 574 | 15.6 |
| S-15-8 | 18.0 | 0.0018 | 41.9 | 0.0451 | 9,837 | 552 | 17.8 |
| S-20-8 | 18.7 | 0.0018 | 47.9 | 0.0544 | 10,200 | 555 | 18.4 |
| S-00-10 | 14.8 | 0.0018 | 26.7 | 0.0300 | 8,073 | 424 | 19.0 |
| S-05-10 | 15.6 | 0.0018 | 28.0 | 0.0307 | 8,556 | 428 | 20.0 |
| S-10-10 | 17.7 | 0.0018 | 42.9 | 0.0462 | 9,692 | 567 | 17.1 |
| S-15-10 | 18.5 | 0.0018 | 48.5 | 0.0507 | 10,103 | 615 | 16.4 |
| S-20-10 | 19.1 | 0.0018 | 55.6 | 0.0603 | 10,441 | 623 | 16.7 |
| S-00-12 | 14.9 | 0.0018 | 27.1 | 0.0303 | 8,169 | 426 | 19.2 |
| S-05-12 | 16.1 | 0.0018 | 28.0 | 0.0287 | 8,798 | 444 | 19.8 |
| S-10-12 | 18.1 | 0.0018 | 52.1 | 0.0560 | 9,909 | 626 | 15.8 |
| S-15-12 | 18.9 | 0.0018 | 58.7 | 0.0612 | 10,320 | 671 | 15.4 |
| S-20-12 | 20.2 | 0.0018 | 67.2 | 0.0631 | 11,045 | 768 | 14.4 |
|
Group No. |
Specimen No. |
fiber volume ratio vf % |
Reinforcement bar size (mm) |
Torsional Ultimate Moment Tult (kN.m/m) |
Tult/ Tult,f0 a |
|---|---|---|---|---|---|
| G1 | S-00-8 | 0 | 8 | 22.0 | 100% |
| S-05-8 | 0.5 | 8 | 22.9 | 104% | |
| S-10-8 | 1 | 8 | 38.5 | 175% | |
| S-15-8 | 1.5 | 8 | 42.5 | 193% | |
| S-20-8 | 2 | 8 | 48.7 | 221% | |
| G2 | S-00-10 | 0 | 10 | 27.2 | 100% |
| S-05-10 | 0.5 | 10 | 28.1 | 103% | |
| S-10-10 | 1 | 10 | 43.1 | 158% | |
| S-15-10 | 1.5 | 10 | 49.3 | 181% | |
| S-20-10 | 2 | 10 | 56.1 | 206% | |
| G3 | S-00-12 | 0 | 12 | 27.4 | 100% |
| S-05-12 | 0.5 | 12 | 28.4 | 104% | |
| S-10-12 | 1 | 12 | 52.7 | 192% | |
| S-15-12 | 1.5 | 12 | 58.9 | 215% | |
| S-20-12 | 2 | 12 | 67.9 | 248% |
| Specimen No. |
fiber volume ratio vf % |
Reinforcement bar size (mm) |
Torsional Ultimate Moment Tult (kN.m/m) |
Tult/ Tult,b8 a |
|---|---|---|---|---|
| S-00-8 | 0 | 8 | 22.0 | 100% |
| S-00-10 | 0 | 10 | 27.2 | 124% |
| S-00-12 | 0 | 12 | 27.4 | 125% |
| S-05-8 | 0.5 | 8 | 22.9 | 100% |
| S-05-10 | 0.5 | 10 | 28.1 | 123% |
| S-05-12 | 0.5 | 12 | 28.4 | 124% |
| S-10-8 | 1 | 8 | 38.5 | 100% |
| S-10-10 | 1 | 10 | 43.1 | 112% |
| S-10-12 | 1 | 12 | 52.7 | 137% |
| S-15-8 | 1.5 | 8 | 42.5 | 100% |
| S-15-10 | 1.5 | 10 | 49.3 | 116% |
| S-15-12 | 1.5 | 12 | 58.9 | 139% |
| S-20-8 | 2 | 8 | 48.7 | 100% |
| S-20-10 | 2 | 10 | 56.1 | 115% |
| S-20-12 | 2 | 12 | 67.9 | 139% |
Table 7 provides a comparison between the current study’s results and experimental findings from previous research studies regarding the effect of fiber inclusion on the torsional ultimate moment of structures. This comparison, presented as a percentage increase in torsional ultimate moment due to the use of fibers, has served to validate the finite element analysis model used in the present study. Since no experimental data on the effect of fibers on the torsional behavior of slabs are currently available, the table instead has provided reference studies on beams. The reviewed studies have indicated the torsional ultimate moment to be increased by 63% and 118% with fiber volume ratios of 1% and 2%, respectively. In comparison, the current study has found the average increase in torsional moment to be 75% and 125% for the same fiber volume ratios. These results have been found to closely align with previous experimental findings, confirming the accuracy of the FEA model used in this study.
Figs. (7 and 8) show the T-θ relationship for all slabs. Similar to the experimental studies by Lopes et al. [6] and Ibraheem and Mukhlif [11], these curves can be divided into three distinct stages, with the first stage representing the linear elastic phase before the occurrence of cracking, the second stage appearing following cracking and characterized by a decrease in the slope of the curves, and the third stage corresponding to the softening phase occurring beyond the peak torsional moment. Curves with a lower fiber volume ratio (Fig. 7) have been found to exhibit a more significant reduction in slope after cracking. Likewise, curves with lower reinforcement levels (Fig. 8) have been found to display a similar trend of a more pronounced slope reduction after cracking. This latter observation has been found to be consistent with the findings of Peng and Wong [28], who have reported lower reinforcement levels to lead to increased steel strains and, as a result, larger twist angles at the onset of cracking. Ibraheem and Mukhlif [11] have also observed similar patterns.
|
fiber volume ratio vf % |
Study |
Increase in Tult due to fiber reinf. % |
|---|---|---|
| 1 | Abdullah and Malik [13] | 63% |
| Current – Average of G1, G2, G3 | 75% | |
| 2 | Oettel [14] | 118% |
| Current – Average of G1, G2, G3 | 125% |
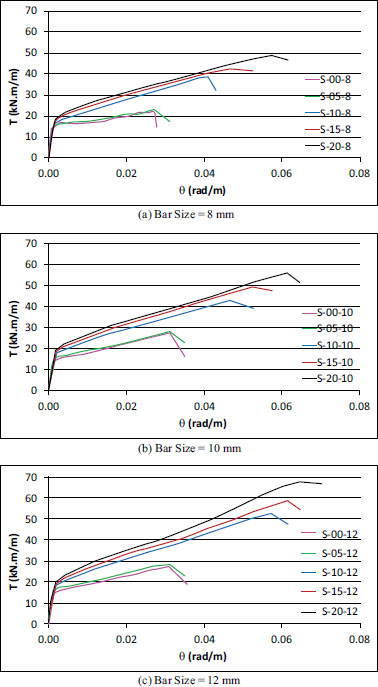
T-θ curves of the slabs showing the effect of fiber volume ratio.

T-θ curves of the slabs showing the effect of bar size.
CONCLUSION
Fundamental behavioral understanding has been obtained from the finite element analysis of fifteen fiber-reinforced concrete slabs, and the following main conclusions could be drawn:
- Using a volume ratio of 2% of steel fibers increased the torsional cracking moment of the slabs between 27% and 35%.
- Using fibers had a significant effect on the torsional yielding moment of the slabs, as this moment increased between 108% to 148% by using a volume ratio of 2% of fibers.
- The torsional stiffness in stage I (before cracking) was significantly higher than the torsional stiffness in stage II (after cracking), and the ratio of KTI/KTII ranged between 14.4 and 30.9.
- The ratio of KTI/KTII ranged between 14.4 and 18.4 for slabs with a volume ratio of 2% of steel fibers.
- The inclusion of fibers increased stiffness in both stages, but the increase was more significant in stage II.
- The torsional ultimate moment increased only between 3% to 4% by using fibers with a volume ratio of 0.5%, but it increased between 106% to 148% by using fibers with a volume ratio of 2%.
- The proper volume ratio of fibers to improve the torsional ultimate moment of specimens included in the study was between 1% to 2%.
- The maximum increase in the torsional ultimate moment as the effect of changing bar size from 8 mm to 12 mm was 39%.
LIST OF ABBREVIATIONS
| FEA | = Finite Element Analysis |
| FRC | = Fiber Reinforced Concrete |
| GFRP | = Glass Fiberreinforced Polymer |
| SCRC | = Selfcompacting Reinforced Concrete |


