All published articles of this journal are available on ScienceDirect.
Numerical Study on the Liquefaction Potential Analysis Using Constitutive Models for Sand and Silt in Mamuju, West Sulawesi
Abstract
Background
Sulawesi Island, located in the Eastern Indonesian archipelago, is known for its high seismic activity. In 2021, West Sulawesi experienced an earthquake with a mainshock of 6.2 MW, which resulted in liquefaction characterized by sand boil and lateral spreading at various locations, including near the North coast of Mamuju.
Objective
This study aims is to assess the potential for liquefaction at a nearshore location in Mamuju, West Sulawesi. The assessment focuses on the increase in pore water pressure in an area characterized by multiple layers of sand, silt, and clay soils.
Methods
Numerical analysis was conducted by modeling one-dimensional soil column using PM4Sand and PM4Silt constitutive models calibrated using PLAXIS 2D soil test feature with the Cyclic Direct Simple Shear (CDSS) test method. Furthermore, the study included spectral matching of the ground motion from the 2021 Mamuju earthquake to the spectral response at the research site as motion input.
Results
Analysis results indicate the potential for liquefaction in silty sand and sandy silt soils with sand-like behavior, as evidenced by an excess pore water pressure ratio exceeding 0.8. Meanwhile, sandy silt and sandy clay soils, with a plasticity index (PI) greater than 7, showed no liquefaction potential at a peak ground acceleration of 0.478 g.
Conclusion
In conclusion, soil relative density plays an important role in influencing pore water pressure and liquefaction susceptibility, which should be considered when planning and designing in earthquake-prone areas, shallow groundwater tables, sand, silt, and clay layers.
1. INTRODUCTION
Indonesia is characterized by susceptibility to a variety of potential natural disasters due to its geographical condition as the largest archipelago in the world. Surrounded by the Eurasian, Indo-Australian, Philippine Sea, and Pacific Plates, it is vulnerable to seismic activity. Therefore, Sulawesi Island, in the eastern part, tends to be at risk due to the extreme seismic activities [1]. This was caused by the location of the island at the convergence of the Philippine Sea, Sunda, and Australian plates [2].
One of the active faults in the western part of Sulawesi is the Makassar Strait Thrust (MST), a reserve fault divided into four segments, namely Somba (MSTS), Mamuju (MSTM), Central (MSTC), and North (MSTN) [3, 4]. The MST Mamuju and MST Somba segments exhibited the highest seismic activity compared to the others [1]. For example, major earthquake magnitudes of 7.0 in accordance with the moment magnitude scale (MW), were associated with these segments. In addition, the earthquakes reportedly occurred on February 23, 1969, and January 8, 1984, at depths of 15 km and 33 km, respectively [5, 6].
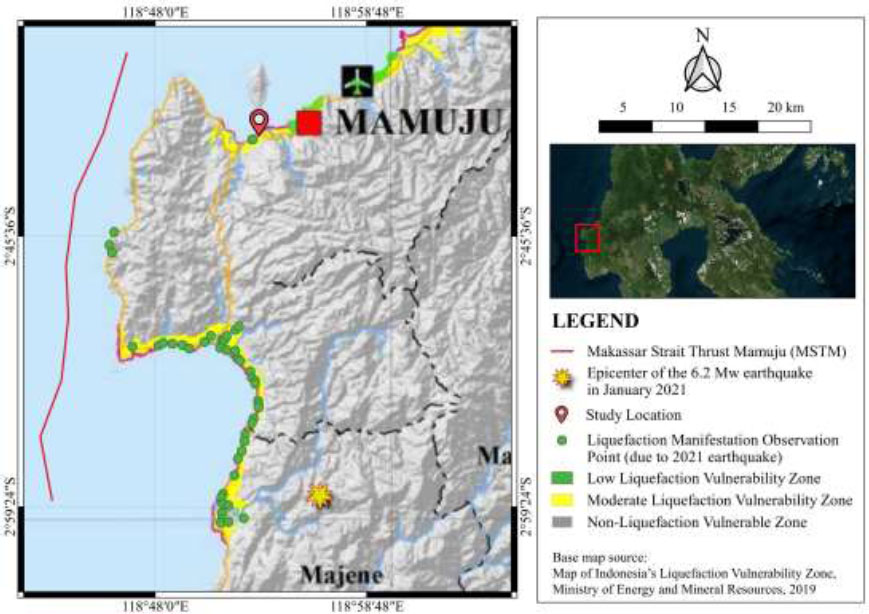
The United States Geological Survey (USGS) reported an earthquake on January 15, 2021, at 02:28 Central Indonesian Time (WITA), UTC+8, with mainshock of MW 6.2 in the western coast of Sulawesi, precisely between Mamuju and Majene, at a depth of 18 km [7]. This was a result of the ruptured fault plane associated with the MST segment off the west coast of Mamuju [4, 8, 9]. This seismic event led to various hazards, including lique-faction observed at 56 sites, characterized by sand boil and lateral spreading phenomena [10, 11]. Liquefaction was also observed near the coast of Mamuju Regency and adjacent to the grand mosque, which suffered severe damages, as shown in Fig. (1).
Based on the Indonesian Liquefaction Vulnerability Zone, West Sulawesi has several areas with low to high potential. A typical example is the Mamuju Regency, located on the northern coast, categorized as having moderate liquefaction potential [12], as shown in Fig. (1). Additionally, the area is characterized by a shallow groundwater table [13].
In current engineering practice, liquefaction potential is assessed using simplified methods based on in situ test results. This included the standard and cone penetration test proposed by Idriss and Boulanger [14]. Additionally, previous studies used these simplified methods to assess liquefaction potential [15, 16].
Another simplified method was the numerical analysis, commonly conducted to evaluate liquefaction potential. Toloza [17] conducted a study to verify the PM4Sand soil constitutive model, designed to simulate liquefaction in granular soils, using PLAXIS 2D software. The verification process showed that proper calibration of the PM4Sand model led to a satisfactory response in terms of stress path and pore water pressure generation. Chen [18] conducted a study to verify the PM4Sand and PM4Silt constitutive soil models with respect to the following three frameworks: OpenSees, FLAC, and PLAXIS 2D using stress point, element model, and 1D analysis. The results obtained from using PM4Sand for liquefaction-prone layers provided realistic and reasonable responses despite the limited soil information. However, further refinement of the input parameters was required for more accurate predictions.
Zakariya et al. [19] conducted a study on the liquefaction potential at Kretek 2 Bridge, close to a fault, using empirical and numerical methods with DEEPSOIL v7 software while considering the excess pore water pressure ratio. The results focused on the importance of cross-referencing numerical findings with empirical methods to evaluate liquefaction risk and structural integrity in earthquake-prone regions accurately. Kusmanto et al. [20] carried out a study on liquefaction potential in Ambon City, adopting a deterministic seismic method based on new faults and nonlinear analysis. This included the use of a two-dimensional finite element evaluated with QUAKE/W software. The numerical analysis showed a significant decrease in effective stress and an excessive increase in pore water pressure, especially in the saturated layer. Additionally, the study focused on the amplification of peak ground acceleration from bedrock to the surface, especially in alluvial soils and areas near faults.
The present study focused on identifying the potential for liquefaction at a nearshore area in Mamuju, West Sulawesi. The soil consisted of multiple layers, including sand, silt, and clay. Numerical analysis was performed by modeling a one-dimensional soil column using the PM4Sand and PM4Silt constitutive models in PLAXIS 2D software. Furthermore, the calibration process for the constitutive model was carried out using the soil test feature in PLAXIS 2D with the Cyclic Direct Simple Shear (CDSS) method. The 2021 Mamuju earthquake that had been spectrally matched served as input motion. The results of the modeling were used to determine the potential for liquefaction due to the influence of excess pore water pressure on soil during seismic loading events.
2. MATERIALS AND METHODS
2.1. Geological and Geotechnical Condition
A two-story building located in Mamuju Regency, approximately 320 m away from the shoreline, was investigated. It is also part of the government initiative to support the rehabilitation and reconstruction of structures following the 2021 earthquake. Meanwhile, among the affected buildings was the grand mosque. Additionally, Fig. (2) shows the locations of soil investigation from the 2022 survey. For this study, soil investigation will be conducted using the Standard Penetration Test (SPT) at three borehole locations.
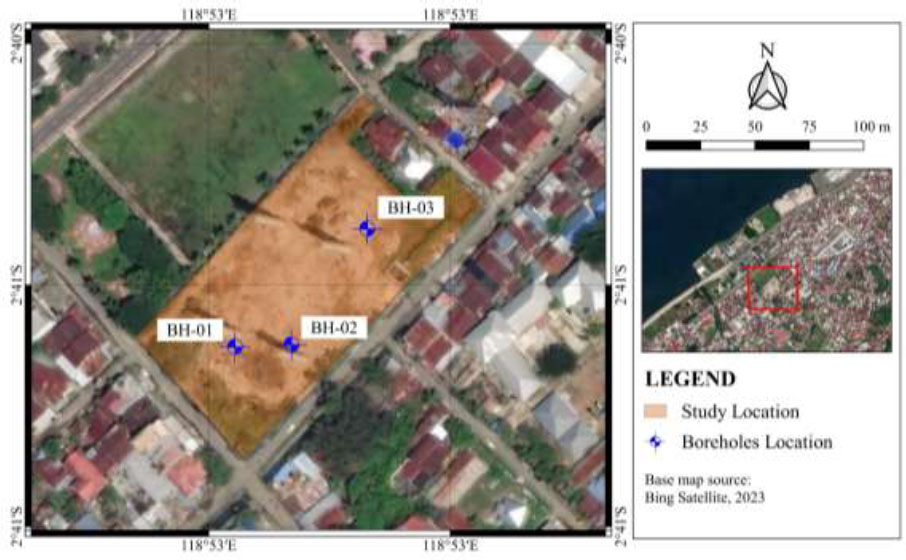
Distribution of boreholes at the study location.
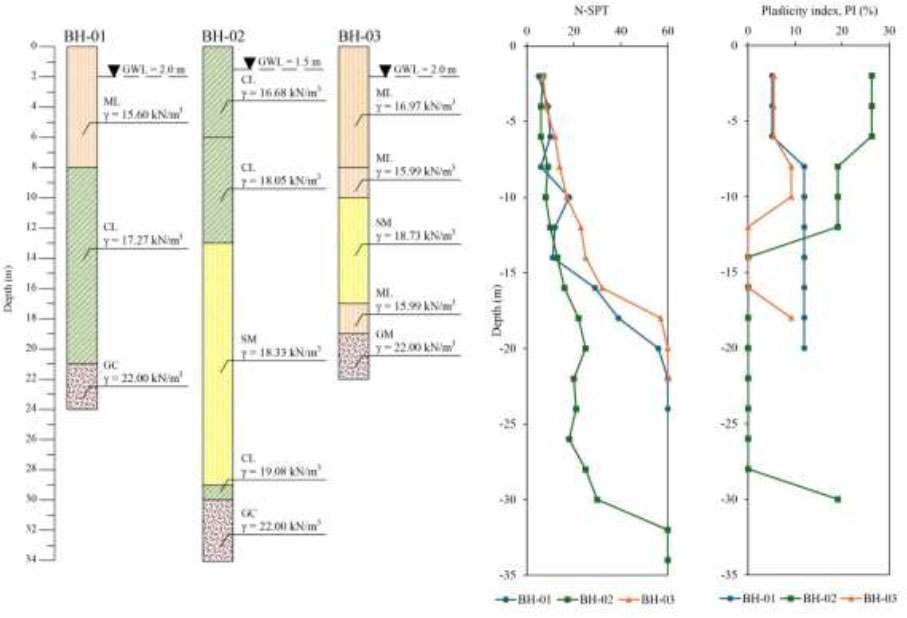
Soil investigation data and laboratory test results for BH-01, BH-02, and BH-03.
The geological conditions in Mamuju Regency comprised a combination of breakthrough, sedimentary, and volcanic rocks, as well as surface deposits. The sedimentary and volcanic rock formations are predominantly characterized by the following Adang (Tma) and Talaya volcanic rocks (Tmtv), as well as Mamuju formation (Tmm) and Tapalang members of Mamuju formation (Tmmt). The surface deposits in the coastal plains mainly constituted alluvial formation (Qa) and fan deposits (Qf). The study location near the coast was composed of Quaternary deposits in the form of alluvial formations (Qa) comprising boulders, crusts, pebbles, sand, silt, mud, and plant remains [21]. These quaternary deposits, subjected to weathering, were generally loose, soft, and less compact, thereby resulting in susceptibility to changes when subjected to external forces [11].
The soil layers were interpreted based on three drills and laboratory tests shown in Fig. (3). Moreover, it was reported several types of silt, clay, and sand layers characterized the study site. A silty sand layer (SM) was found at BH-02 and BH-03 with medium to dense density. The sandy silt layer (ML) at BH-01 and BH-03, ranging from 0 m to 8 m in depth, had a plasticity index (PI) value of less than 7 and was categorized as sand-like criteria [22]. However, the sandy clay (CL) layers at BH-01 and BH-02, with depths ranging from 8 m to 21 m and 0 m to 13 m, had PI values greater than 7, falling under clay-like criteria [22]. Hard soil was found starting at 19 m to 30 m depth. The study site had a potential for liquefaction due to the presence of a sand layer. Furthermore, silt and clay soils with CL, CL-ML, and ML classifications, exhibiting specific characteristics, also had the liquefaction potential [23].
Based on the result of soil investigation, the groundwater table at the study site is relatively shallow, ranging from 1.5 m to 2 m. This shallow depth is a significant factor in the potential occurrence of liquefaction, as a groundwater table less than 3 m deep had very high liquefaction susceptibility [24].
2.2. Developing Synthetic Ground Motion
Synthetic ground motion was generated because no ground motion recordings were available at the study location. This was realized using two methods, namely spectral matching and amplitude scaling [25]. In addition, spectral matching was performed because it enabled accurate matching of the target spectrum with the resulting time series. The method was also used to address discrepancies in frequency content between the initial time series and the target spectrum, which cannot be rectified through amplitude scaling [26].
The 2021 Mamuju earthquake was detected by 63 stations, and the closest to the epicenter was the Mamuju Sulawesi Transportation Agency Station (MMSN), situated 47.77 km away. Meanwhile, the Reis Watulimo Station (TDSR) was the farthest, located at 994.56 km. The study location was 4.5 km away from the nearest station, the MMSN, as shown in Fig. (4).
The ground motion data provided by BMKG was obtained only from the MMSN station, positioned in the highlands near the coast and characterized by a solid soil type with the site class SC. However, the motion was recorded in the following three components, horizontal East-West (HNE), horizontal North-South (HNN), and vertical (HNZ). The HNE component exhibited the highest maximum peak ground acceleration (PGAmax) value of 0.151 g, as shown in Fig. (5a, b) [27]. Ground motion parameters recorded at the MMSN station for the HNE component had a PGAmax, PGVmax, and PGDmax of 0.151 g, 15.38 cm/sec, and 4.47 cm, occurring at periods of 11.45 sec, 11.64 sec, and 11.42 sec, respectively.
Hanindya et al. [28] conducted a study on spectral matching using a target spectrum designed with DSHA. Meanwhile, Makrup et al. [29] performed spectral matching with a target spectrum based on the UBC 1997 code. This study adopted the Seismic Design Code of Indonesia (SNI 1726:2019). In addition, the target spectrum for the maximum earthquake considered risk-targeted (MCER) was assigned as the earthquake with a 2% probability of exceedance in 50 years and a return period of 2,475 years [30]. The target spectrum applicable to the study location, characterized by a soft soil (SE) site class, is shown in Fig. (6), corresponding to a PGA value of 0.619 g in bedrock [31].
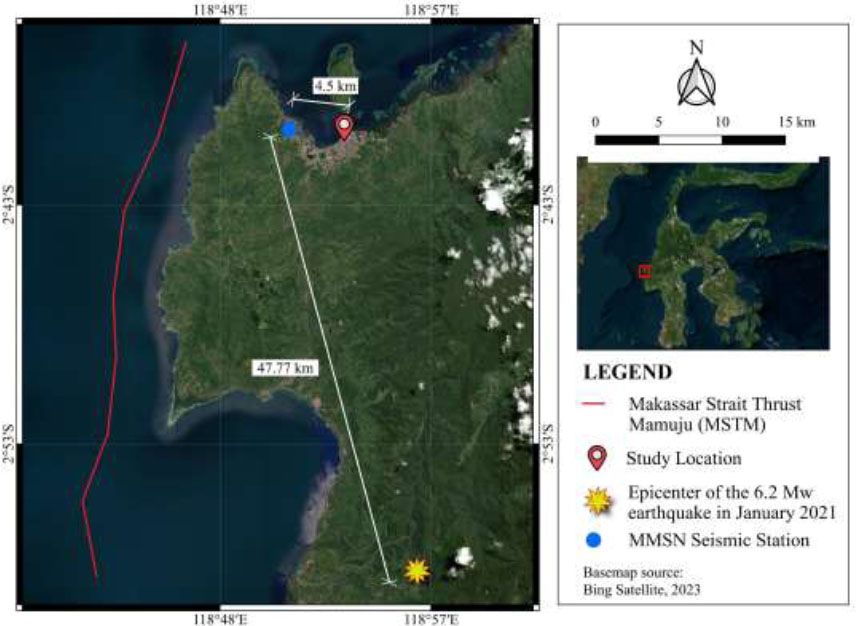
Location of the earthquake epicenter, MMSN seismic station, and study location.
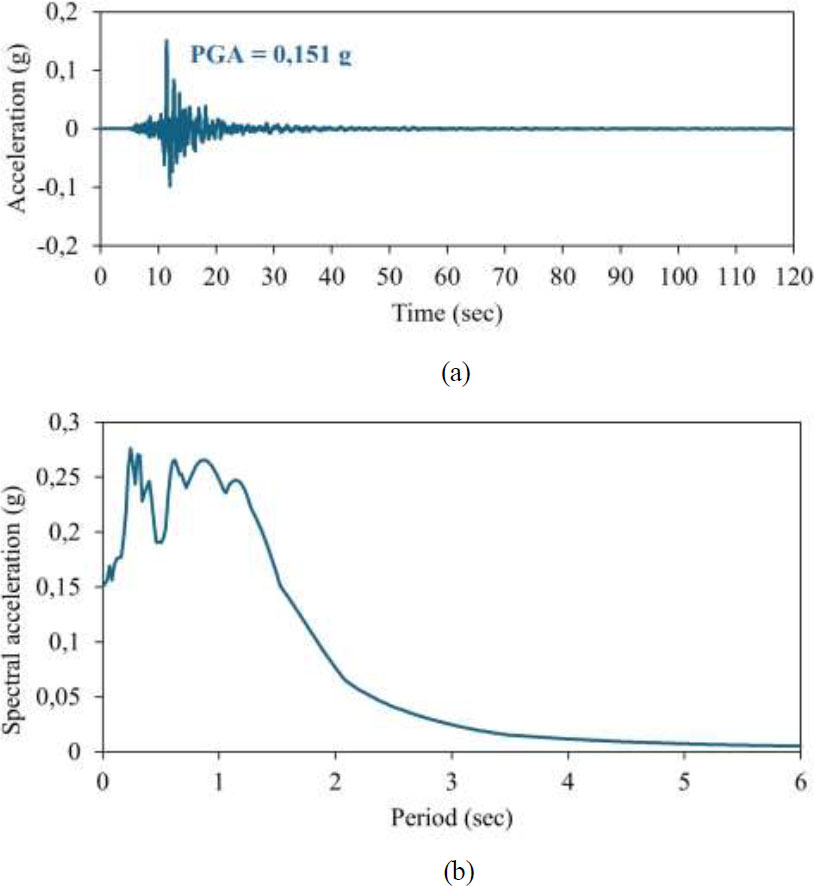
(a) Recorded ground motion and (b) spectral acceleration of the horizontal north-east (HNE) component at the MMSN station [27].
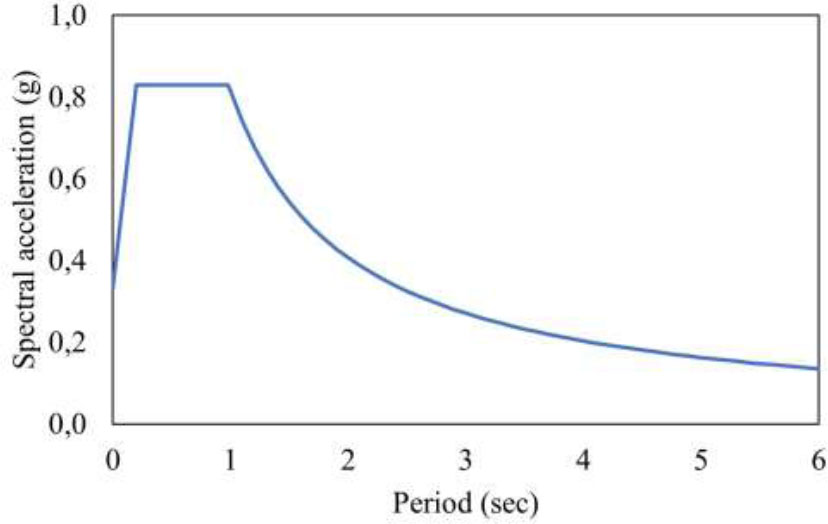
Target response spectrum at study location (Mamuju Regency, West Sulawesi) with site class SE [31].
There are several basic approaches to spectral matching, including frequency domain methods, frequency domain methods with Random Vibration Theory (RVT), and time domain methods [32]. Furthermore, the time domain method has been extensively studied and improved by various experts [26, 33-37]. This included adjusting the time series through the addition of wavelets. The method reportedly had good convergence properties and could maintain the non-stationary character of the initial time series [26]. Subsequently, the SeismoMatch [38] program was used to carry out spectral matching. This tool had the capability to modify the earthquake accelerogram to correspond with the response spectrum of a specific target by using the wavelet algorithm developed by [26, 37].
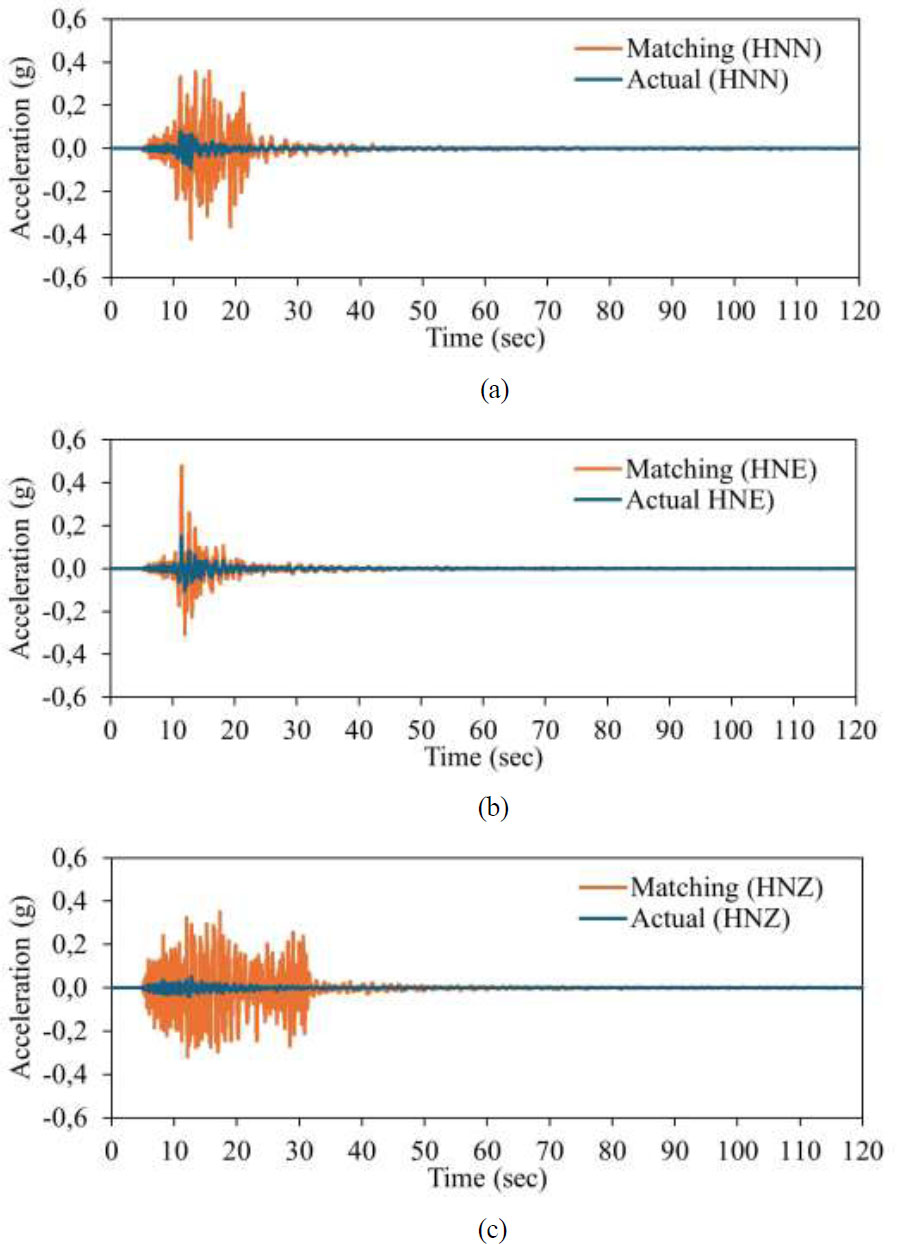
Time series comparison actual vs matched of recorded ground motion on (a) HNN (b) HNE (c) HNZ components.
Based on SNI 1726:2019, the spectral matching requirement proposed that each component of the ground motion must be matched within the range of 0.8 Tlower to 1.2 Tupper. In this case, Tlower and Tupper correspond to 0.031 sec and 0.805 sec, depicting the period for spectral matching ranging from 0.025 sec to 0.966 sec. The mismatch tolerance for the two algorithms were established at 0.3.
The spectral matching results of the 2021 Mamuju earthquake accelerogram, considering the three components with the target spectrum, are shown in Figs. (7 and 8). According to Table 1, while the Al Atik and Abrahamson [26] algorithm had a smaller misfit value, it required a higher number of iterations compared to the Hancock algorithm. The mean misfit for the three records using the Al Atik and Abrahamson [26] algorithm is 2.36%, while the Hancock [37] algorithm had a mean misfit value of 3.68%. Based on the misfit tolerance value, the ground motion served as the outcome of spectral matching using the Al Atik and Abrahamson [26] algorithm on the HNE component. The time history in Fig. (9) shows the spectral matching results used to analyze the liquefaction potential at the study location, considering PGA, PGV, and PGD values of 0.478 g, 34.71 cm/sec, and 7.25 cm, respectively.
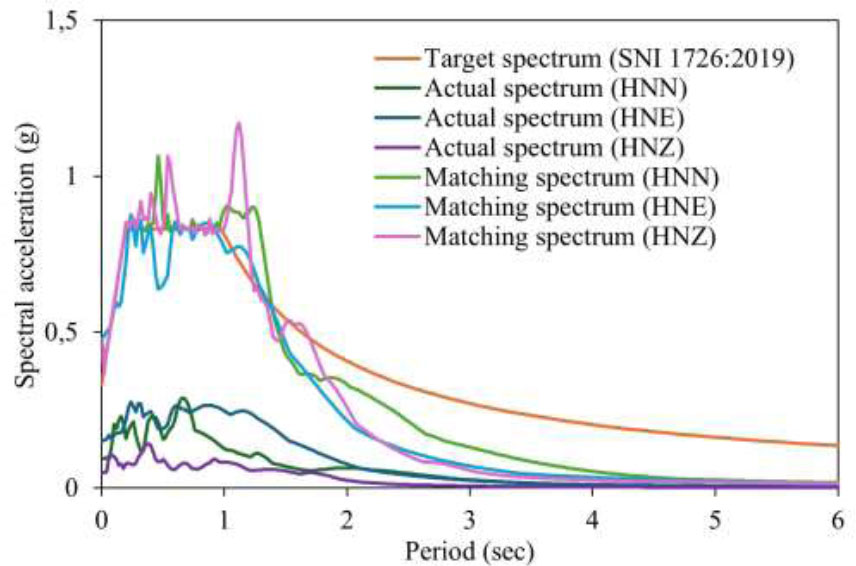
Result of spectral matching between target response spectrum and response spectrum of Mamuju earthquake on HNN, HNE, and HNZ component.
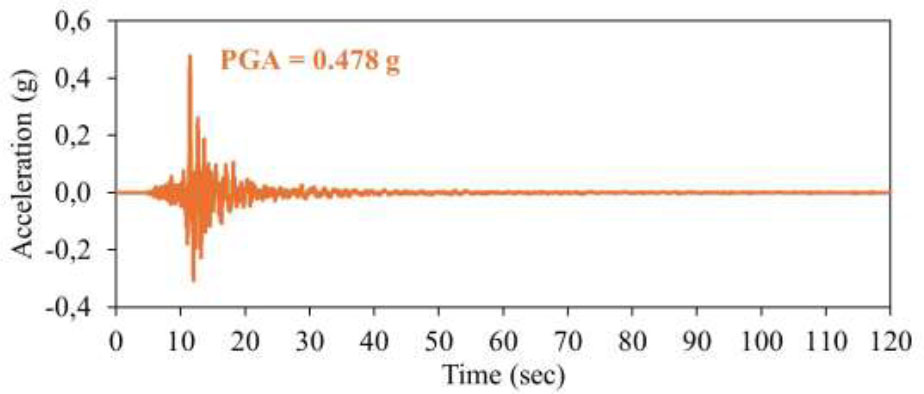
Synthetic ground motion using spectral matching.
2.3. Constitutive Model
Constitutive soil models are crucial elements of analytical frameworks in the geotechnical field. These were designed to reflect the most representative conditions of the original settings, particularly for liquefied soils. The models aided in the formulation of a mathematical framework to comprehend and forecast soil response to earthquake or dynamic loads. The selection of a constitutive soil model depended on factors such as the soil type, availability of existing data, and ease of implementation. Meanwhile, two constitutive models were selected, namely PM4Sand [39] and PM4Silt [40]. Considering the soil behavior criteria proposed by [22], PM4Sand was applied to simulate soil layers consisting of sandy silt and silty sand soil types with sand-like behavior. However, PM4Silt was used to represent soil layers with sandy clays and sandy silt soil types with clay-like behavior [41-43].
2.3.1. PM4Sand Constitutive Model
PM4Sand is a plasticity model specifically designed to analyze the behavior of soils under earthquake loading, with a focus on liquefaction. It was developed based on the fundamental principles of stress-ratio controlled and critical-state-based boundary surface plasticity models initially introduced and later refined by [44] and [45], respectively.
The PLAXIS 2D program was used for modeling. Furthermore, calibration was performed using four primary and nine secondary parameters with recommended default values that can be adjusted under specific circumstances [46]. The recommended default values for the secondary parameters were proposed in a previous study [39]. Moreover, the four primary parameters included relative density (Dr), shear modulus coefficient (G0), contraction rate parameter (hp0), and atmospheric pressure (pA).
The relative density (Dr) influences the dilatancy and stress-strain response characteristics, and is expressed as a ratio rather than a percentage. Dr values tend to be generally be estimated based on CPT or SPT penetration resistance. According to a previous study [14], the general form for Dr correlation based on SPT was represented by Eq. (1), where (N1)60 is the 1 atm overburden corrected SPT value, and the Cd value is determined based on the recommendation of 46.
 |
(1) |
- The shear modulus coefficient (G0) controls the elastic (or small-strain) shear modulus. According to [39], the value of G0 can be estimated based on the (N1)60 as in Eq. (2).
 |
(2) |
- The contraction rate parameter (hp0) was the last to be calibrated once all other have been adjusted. This parameter was used to modify the contractiveness, enabling calibration of the model to a specific value of the Cyclic Resistance Ratio (CRR). In addition, PLAXIS 2D soil test feature enabled calibration using the CDSS test. Liquefaction was presumed to occur when the peak shear strain reaches 3% after undergoing 15 uniform loading cycles during the CDSS test [39].
- The atmospheric pressure (pA) used was 101.3 kPa.
2.3.2. PM4Silt Constitutive Model
The previously discussed PMSand constitutive model is effective for describing sand-like behavior, and not clay-like behavior of soils. This led to the need for a model that can accurately represent the clay-like behavior of soils under earthquake loads. In another study, the PM4Silt constitutive model was developed based on the PM4Sand framework, with modifications [40] to enhance its ability to replicate the undrained monotonic and cyclic responses of silt and clay.
The PM4Silt model was also implemented into PLAXIS 2D as a user-defined model, presented in the form of a Dynamic Link Library (DLL) [47]. It required three primary parameters to calibrate and 17 secondary parameters. The PM4Silt model also recommended that default values modified in special circumstances, with the secondary parameter given [40]. Meanwhile, the three primary parameters include undrained strength at a critical state or undrained strength ratio (Su) or (Su, ratio), shear modulus coefficient (G0), and contraction rate parameter (hp0).
- The undrained strength in a critical state (Su) was determined using various methods such as consolidated undrained triaxial and DSS tests, including empirical correlations. Due to data limitations in this study, the Su value for soil types with PI ≤ 20 was estimated using empirical correlations based on corrected SPT values (N60), water content, PI, and liquid limit proposed by [48] as stated in Eq. (3).
 |
(3) |
The undrained strength ratio (Su, ratio) was calculated using Eq. (4), where σ'vc represents the effective vertical stress.
 |
(4) |
- The shear modulus coefficient (G0) was estimated using Eq. (5), where Eq. (6) was applied to determine the value of Gmax. In this case, ρ represents saturated density, p depicts effective stress, and nG has a value of 0.75 [40].
 |
(5) |
 |
(6) |
- Similar to PM4Sand, in PM4Silt, the contraction rate (hp0) was the final parameter to be calibrated after all others had been established. The calibration of the hp0 value for the PM4Silt model in this study was equated with the PM4Sand model using the CDSS test.
2.4. Numerical Modeling
Numerical modeling was conducted in this study using PLAXIS 2D software. The soil profile was modeled with a one-dimensional soil column with various layers in each borehole. The excess pore water pressure was determined by observing the mechanism of the soil column under cyclic loading [46, 47, 49].
Sand-like and clay-like soils were modeled using PM4Sand and PM4Silt, respectively. The Hardening Soil model was applied to soils assumed to have no possibility of liquefaction. The unavailability of bedrock depth information led to the assumption that the layer was located at the bottom of each borehole and therefore modeled with linear elastic material. The shear wave velocity value obtained for the engineering bedrock is 760 m/s [50]. The soil layer used for simulation, as well as the elevation of the groundwater table in each borehole, were adjusted based on the soil investigation results in Fig. (3).
The Rayleigh damping ratio values are α = 0.096, β = 0.00079 [46, 47], respectively. The values of G0, Dr, Su, ratio and hp0 in each soil layer are shown in Table 2.
The hp0 value in Table 2 was calibrated using the CDSS test in the PLAXIS 2D program. This test, which was conducted under undrained conditions, was essential for analyzing the liquefaction phenomenon. Meanwhile, the initial vertical stress value was set at 100 kPa. For the initial calibration, the number of cycles (NM) were determined using the Eq. (7) where MSF represented the magnitude scaling factor, NM=7.5 is 15, and coefficient b equivalent to 0.34 [46].
 |
(7) |
Correlation of (N1)60CS values in each soil layer to determine the cyclic stress ratio value proposed by [14] was performed to obtain the CRR value. Additionally, this was required to induce liquefaction in an equivalent number of uniform loading cycles, particularly when cyclic laboratory data are unavailable [46].
The results of the PM4Sand model calibration were validated using the curve in Fig. (10), showing the CSR value required to induce liquefaction or 3% shear strain against a uniform number of loading cycles at different Dr values. The curve conformed with the calibration performed by [39], depicting that larger Dr values require more cycles to achieve a specific CSR. It also proved that higher Dr values corresponded to greater soil resistance to liquefaction under equal loading. Additionally, the results of the calibration with the PM4Silt model were validated using the curve in Fig. (11), where the residual strength ratios of 0.45 closely matched the calibration curve performed by [40].
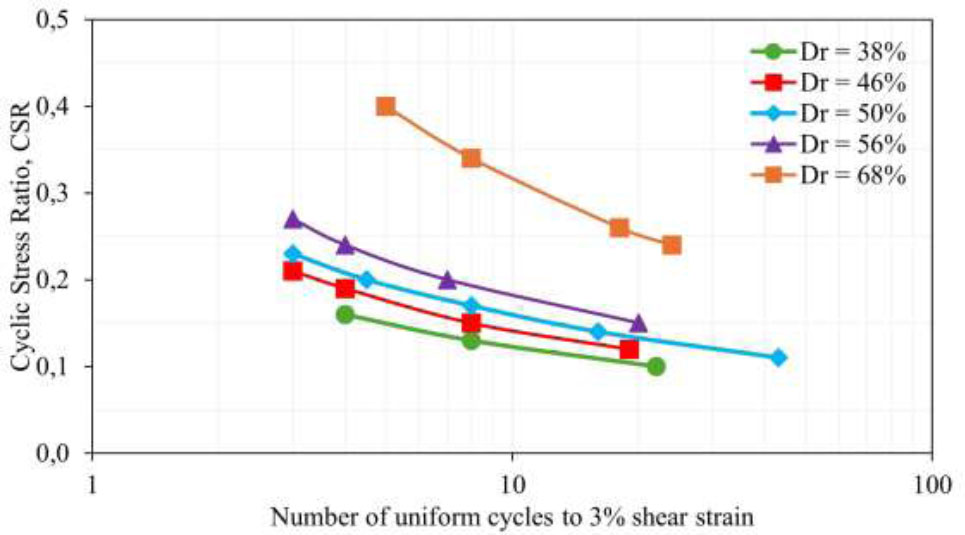
CSR-N curves of calibration results using PM4Sand constitutive model with different relative density (Dr).
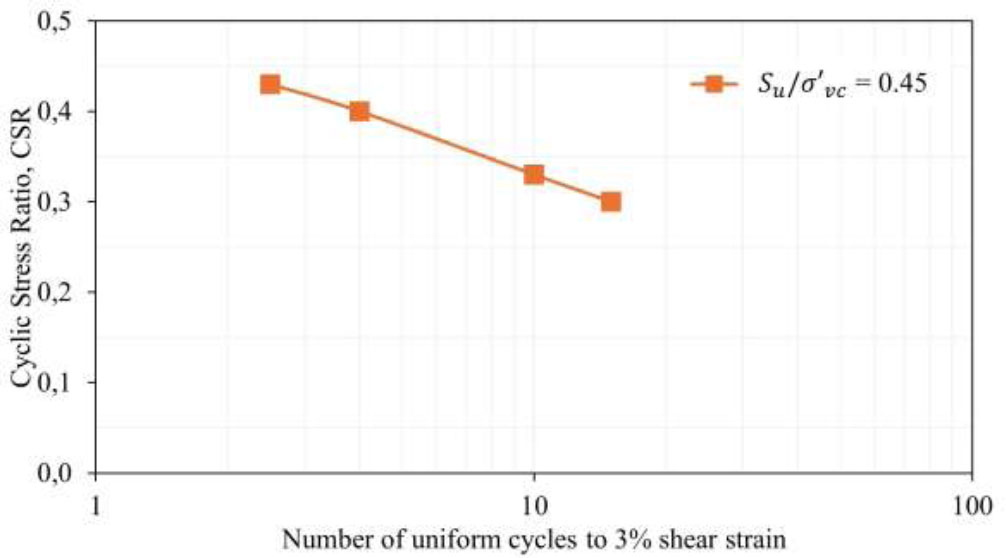
CSR-N curves of calibration results using PM4Silt constitutive model with residual strength ratio.
|
Depth (m) |
Soil Layer |
Model | Primary Parameter | ||||
|---|---|---|---|---|---|---|---|
| Dr(%) | G0 | Su(kPa) | Su/σ'vc | hp0 | |||
| BH-01 | |||||||
| 0 - 2 | ML-1 | PM4Sand | 38 | 578.67 | n.a | n.a | 0.95 |
| 2 - 6 | ML-2 | PM4Sand | 50 | 628.76 | n.a | n.a | 0.75 |
| 6 - 8 | ML-3 | PM4Sand | 38 | 501.94 | n.a | n.a | 0.95 |
| 8 - 14 | CL-1 | PM4Silt | n.a | 789.70 | 50.09 | 0.45 | 7.00 |
| BH-02 | |||||||
| 0 - 6 | CL-3 | PM4Silt | n.a | 670.04 | 41.78 | 0.68 | 6.00 |
| 6 - 13 | CL-4 | PM4Silt | n.a | 710.21 | 37.02 | 0.39 | 4.00 |
| 13 - 16 | SM-1a | PM4Sand | 53 | 650.92 | n.a | n.a | 0.52 |
| 16 - 20 | SM-1b | PM4Sand | 63 | 760.78 | n.a | n.a | 0.28 |
| 20 - 26 | SM-1a | PM4Sand | 53 | 650.92 | n.a | n.a | 0.52 |
| 26 - 29 | SM-1c | PM4Sand | 60 | 731.39 | n.a | n.a | 0.26 |
| 29 - 30 | CL-5 | PM4Silt | n.a | 743.77 | 78.14 | 0.26 | 2.00 |
| BH-03 | |||||||
| 0 - 4 | ML-4 | PM4Sand | 46 | 579.55 | n.a | n.a | 0.73 |
| 4 - 8 | ML-5 | PM4Sand | 56 | 683.97 | n.a | n.a | 0.59 |
| 8 - 10 | ML-6 | PM4Silt | n.a | 841.81 | 36.10 | 0.36 | 2.80 |
| 10 - 14 | SM-2 | PM4Sand | 68 | 818.61 | n.a | n.a | 1.20 |
| 14 - 17 | SM-3 | PM4Sand | 85 | 997.39 | n.a | n.a | 0.40 |
The numerical simulation was carried out in two stages. In the first, the K 0 procedure was used to initialize static stresses by fabricating the model in layers and then raising the water level to the desired level. Meanwhile, at this stage, the earthquake load was not activated.
In the second stage, the earthquake dynamic load in the form of ground motion, as shown in Fig. (9), was applied along the bottom of the numerical model. Furthermore, to prevent the amplitude of the motion from doubling when it reached the free surface, only half of the input motion was required by assigning a value of 0.5 m to the x component of the specified displacement while the y direction was fixed [46, 47, 51]. The deformation boundary was selected freely in the x direction, while in the y direction, the default from PLAXIS 2D was used. Tied degrees of freedom were applied on the left and right vertical boundaries, including compliant base conditions at the bottom, to perform a 1D wave propagation analysis. The period of the dynamic analysis was based on the duration of the ground motion. In order to enable excess pore water pressure analysis, undrained A soil drainage was used. The cavitation cut-off was set at 100 kPa during the undrained dynamic analysis to reduce unrealistic excess pore pressure and stress concentrations.
3. RESULTS AND DISCUSSION
The results of the analysis performed using a numerical model in PLAXIS 2D to identify the susceptible liquefaction layers in each borehole are shown in Figs. (12-14). The ru values for each constitutive model were depicted in separate diagrams due to software limitations. Meanwhile, the liquefaction points were depicted in a single diagram. Fig. (15) shows the ru values in each borehole at different depths. In line with this perspective, the threshold excess pore water pressure ratio (ru) for the layers prone to liquefaction was found to be greater than 0.8 [19].
Based on the analysis, the soil analyzed with the PM4Silt constitutive model in all boreholes showed no probable experience of liquefaction. However, in BH-02, at a depth of 7 m to 10 m, the ru value was approximately 0.8, ranging from 0.67 to 0.75. This showed that liquefaction may occur in that soil layer if the earthquake load applied exceeded the load used in this study, a peak ground acceleration greater than 0.478 g.
The PM4Sand constitutive model identified multiple layers susceptible to liquefaction. In the BH-01 site, the sandy silt (ML) layer with PI less than 7, situated below the groundwater table at a depth of 6 m to 8 m, exhibited liquefaction, characterized by an ru value of approximately 1. However, the soil layers above it showed no signs of liquefaction, with an average ru value of 0.3. This discrepancy was attributed to the ML soil layer at a depth of 3 m to 6 m, which has a higher Dr value of 50% compared to the Dr value of 38% at a depth of 6 m to 8 m.
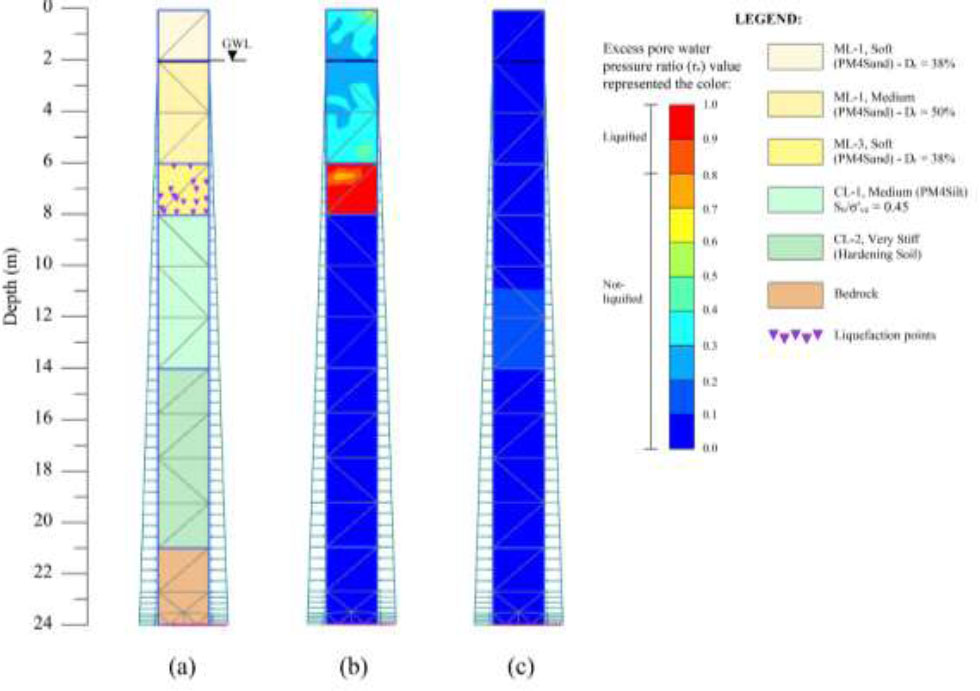
Numerical result for BH-01: (a) Liquefaction points on one-dimensional soil column marked with a triangle symbol, (b) Excess pore water pressure ratio for PM4Sand constitutive model, (c) Excess pore water pressure ratio for PM4Silt constitutive model.
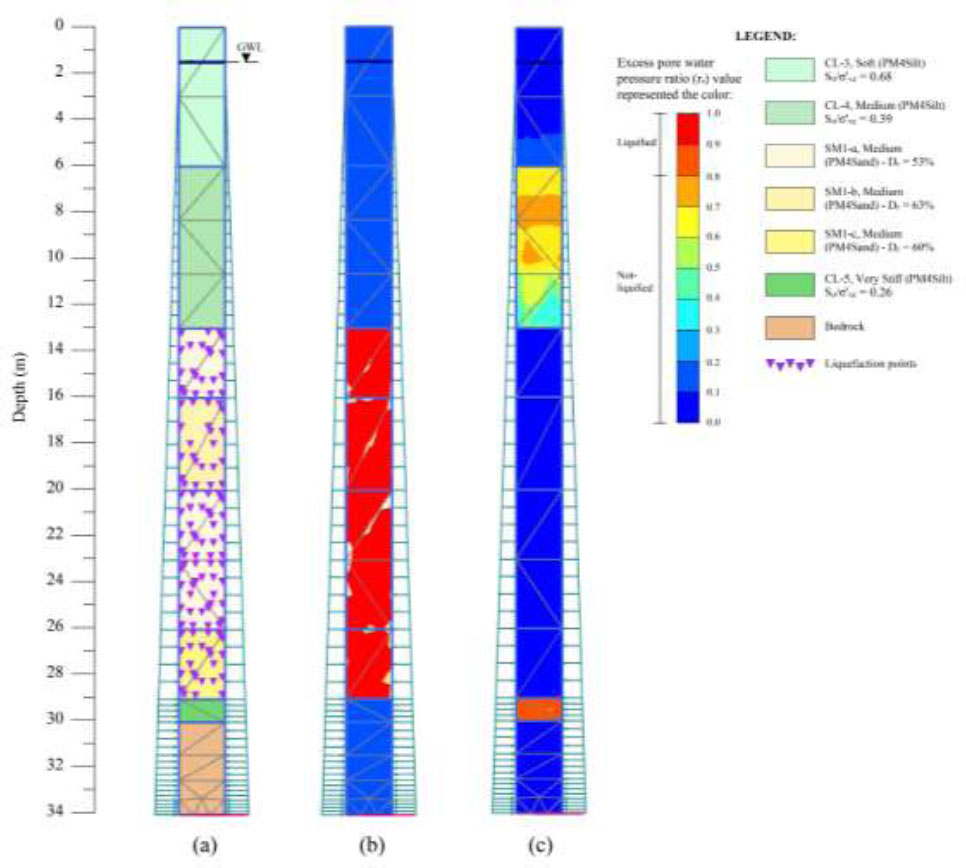
Numerical result for BH-02: (a) Liquefaction points on one-dimensional soil column marked with a triangle symbol, (b) Excess pore water pressure ratio for PM4Sand constitutive model, (c) Excess pore water pressure ratio for PM4Silt constitutive model.
At BH-02, the entire silty sand (SM) layer was liquefied with an ru value of 1. In PLAXIS 2D, depths exceeding 20 m depicted liquefaction in the soil. This was due to limitations in the modeling software, which provides results for all depths. However, these results were disregarded for soil liquefaction at depths greater than 20 meters in PLAXIS 2D, and they were considered non-liquefied. Therefore, the layer at BH-02, which had the liquefaction potential, was within a depth of 13 m to 20 m.
In BH-03, a layer of sandy silt (ML) with a PI less than 7 situated below the groundwater level was prone to liquefaction at depths of 3 m to 4 m and 7 m to 8 m with ru values ranging from 0.87 to 0.98. Additionally, the layer of silty sand (SM) at a depth of 10 m to 16 m did not experience liquefaction, possibly due to the high Dr values at 68% and 85%.
The study showed that relative density impacted the increase in pore water pressure. Specifically, layers with lower relative density experienced a greater increase in pore water pressure compared to layers with higher relative density values, consistent with the findings of [52].
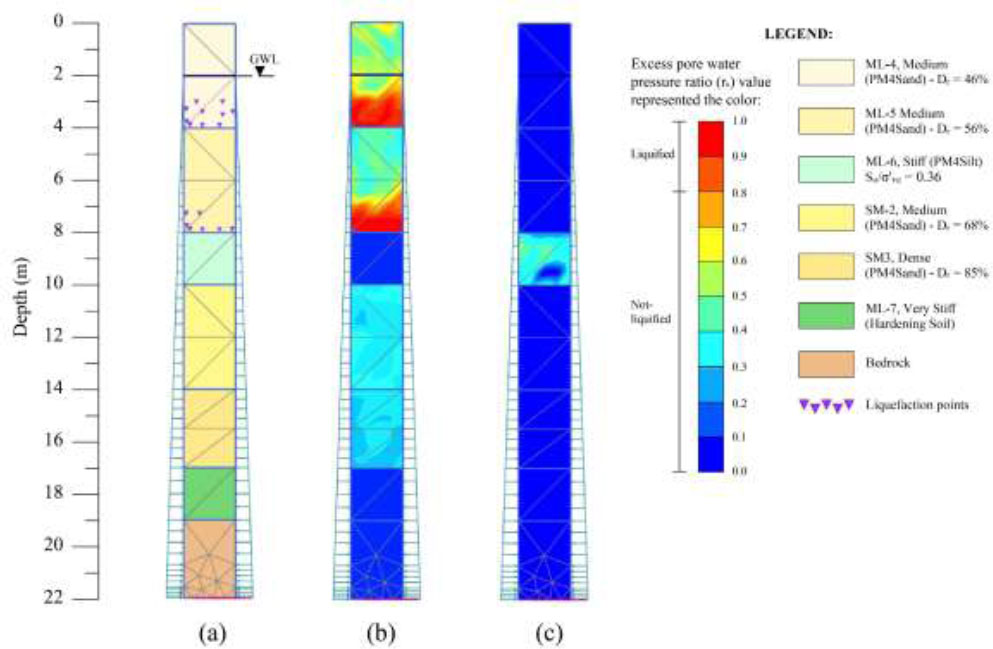
Numerical result for BH-03: (a) Liquefaction points on one-dimensional soil column marked with a triangle symbol, (b) Excess pore water pressure ratio for PM4Sand constitutive model, (c) Excess pore water pressure ratio for PM4Silt constitutive model.
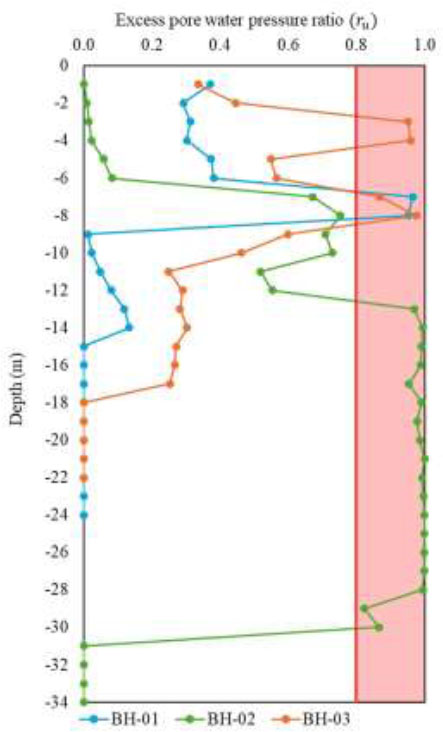
Excess pore water pressure ratio (ru) at different depth in BH-01, BH-02, and BH-03.
CONCLUSION
In conclusion, this study determined the potential for liquefaction in the nearshore area of Mamuju Regency, West Sulawesi, which comprised multiple soil layers, including sand, silt, and clay, with a shallow groundwater table. Numerical modeling and model calibration with two constitutive models using PLAXIS 2D software was performed. Ground motion parameters from the 2021 Mamuju earthquake, spectrally matched to the study site, were used. Additionally, soil behavior was evaluated under earthquake loading, particularly the increase in pore water pressure, which led to liquefaction.
Based on numerical analysis conducted using the PM4Sand and PM4Silt constitutive models on the one-dimensional soil column, it was observed that sandy clays (CL) and sandy silt (ML) soils with clay-like behavior, modeled using PM4Silt, did not liquefy during the event of an earthquake with a PGA value of 0.478 g. Silty sand (SM) and sandy silt (ML) soils with sand-like behavior showed liquefaction potential, which depended on the relative density values. Furthermore, the higher relative density of a layer implied greater soil resistance to liquefaction.
The present study provided important information about liquefaction potential and soil response to earthquakes in the nearshore area of Mamuju, which could be used as a reference for mitigation planning. However, future investigations need to use different methods, such as two-dimensional modeling along the three boreholes, to obtain more comprehensive insights regarding the impacts of earthquakes, such as ground settlement.
AUTHORS’ CONTRIBUTION
S.I., T.F.F.: Study conception and design; A.N.S.: Data collection analysis and interpretation of results.
LIST OF ABBREVIATIONS
| CDSS | = Cyclic Direct Simple Shear |
| PI | = Plasticity Index |
| MST | = Makassar Strait Thrust |
| MSTM | = Makassar Strait Thrust Mamuju |
| USGS | = United States Geological Survey |
| SPT | = Standard Penetration Test |
| MMSN | = Mamuju Sulawesi Transportation Agency Station |
| HNE | = Horizontal East-West |
| HNN | = Horizontal North-South |
| HNZ | = Vertical |
| PGA | = Peak Ground Acceleration |
| PGV | = Peak Ground Velocity |
| PGD | = Peak Ground Displacement |
AVAILABILITY OF DATA AND MATERIALS
The data supporting the findings of the article to Google Drive, available at the following link: https://drive. google.com/drive/folders/1Y_TwcXO3uC6d8xWmq8yE_CPP5xTAcNZm?usp=sharing.
FUNDING
This work was financially supported by the Ministry of Public Works and Housing of Indonesia, (Grant number 21310/UN1/ FTK/DTSL/HK.08.00/2023).
ACKNOWLEDGEMENTS
The authors are grateful to the Meteorological, Climatological, and Geophysical Agency (BMKG) for providing ground motion data. The authors are also grateful to the Ministry of Public Works and Housing and the Settlement Infrastructure Agency for the West Sulawesi Region, who have supported the data and all parts of this study.


