All published articles of this journal are available on ScienceDirect.

Finite Element Analysis of Fiber Reinforced Concrete Eccentric Anchorage Zone in Prestressed Girders
Abstract
Introduction
The anchorage zone, where the prestressing force is transmitted to the concrete, represents a critical component of prestressed girders. This research investigates the behavior of eccentric anchorage zones in prestressed girders constructed with fiber-reinforced concrete (FRC) using finite element analysis (FEA). The study specifically examines the impact of steel fiber volume ratio, bar size of the spiral in the local zone and bar size of the reinforcement in the general zone on the behavior of the anchorage zone.
Methods
A three-dimensional solid element model was created in ABAQUS software, employing non-linear analysis to replicate the structural behavior and strength characteristics of the eccentric anchorage zone when incorporating fiber-reinforced concrete. The analysis included different configurations of fiber volume ratios, the quantity of reinforcement in the local zone, and the quantity of reinforcement in the general zone.
Results
The results indicate that using steel fibers with a volume ratio of 1%-1.5% can replace either spiral or tie reinforcement but cannot substitute the entire reinforcement system. Using 2% steel fibers results in an ultimate load increase of 30%-50%.
Conclusion
Specimens with fibers demonstrate more ductile failure modes. A spiral bar size of 20 mm increases ultimate load between 21% and 31%. Tie bar size of 10 mm increases ultimate load between 24% and 32%, with greater ductile behavior observed in specimens with tie reinforcement.
1. INTRODUCTION
Recent studies have shown that the use of fiber-reinforced concrete (FRC) in prestressed concrete members can improve their durability and structural performance. FRC is a composite material consisting of cement, aggregates, and discrete, randomly distributed fibers that improve its mechanical properties. The use of FRC in prestressed concrete members can help reduce cracking and improve the ductility and energy dissipation capacity of the structure.
The anchorage zone, where the prestressing force is transmitted to the concrete, represents a critical component of prestressed girders. The eccentricity of the anchorage zone can result in significant stresses and deformations, which can affect the overall structural behavior of the member. The use of FRC in the anchorage zone can help improve its behavior under eccentric loading conditions.
Anchorage zone.
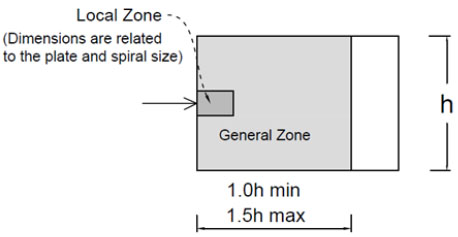
The anchorage zone experiences multiple stress types, including compressive stress near the anchor bearing plate, lateral tensile stress (commonly referred to as bursting stresses) at a certain distance from the anchor, and tensile spalling stress on the member's surface caused by displacement compatibility. In accordance with Fig. (1), the anchorage zone can be divided into the local and the general zones [1, 2]. The local zone refers to the area immediately preceding the anchorage device, where high compressive stresses are concentrated. Confinement, as spiral or tie reinforcement, is introduced in the local zone to withstand the intense bearing and compressive stresses. The remaining portion of the anchorage area is the general zone, where the tensile stresses arise due to the dispersion of the forces in tendons through the section. To counter the tensile bursting stresses, transverse reinforcement is utilized within this zone.
The behavior of prestressed concrete girders and the anchorage zone has been the subject of numerous studies over the years. In their study, Yettram and Robbins [3] investigated the eccentric single and multiple anchorages using linear elastic finite element analysis. Their research revealed that the equivalent-prism method provides a satisfactory representation of the magnitude and distribution of actual bursting stresses for design purposes. Burdet [4] utilized the linear elastic finite element method with the ABAQUS program to analyze anchorage zones. In eccentric configurations, the stress distribution in anchorage zones resembled that of concentrically loaded models when the load was applied within the kern of the section. The feasibility of incorporating fibers in post-tensioned anchorage zones to decrease the reliance on steel reinforcement has been investigated in a study by Yazdani et al. [5], focusing on the utilization of fiber-reinforced concrete within the anchorage zone. They found that steel fibers enhanced the properties of concrete, while the role of synthetic fibers was not as encouraging. Johnson [6] conducted an analytical study for the anchorage zone of the box girders. The study focused on the use of steel fibers to enhance the properties of concrete. The results indicated that a maximum reduction of 65% in the design of mild steel reinforcement could be achieved by replacing it with steel fiber with a ratio of 0.5% in the general zone. Tawfiq and Robinson [7] studied the incorporation of steel fiber-reinforced concrete in anchorage zones of bridge girders. Their findings demonstrated that the inclusion of steel fibers improved the efficiency of post-tensioned anchorage zones, minimizing the need for bursting and confinement reinforcement in these areas. A study conducted by Kim et al [8] focused on evaluating the mechanical behaviors of post-tensioned anchorages by utilizing ultra-high performance concrete (UHPC). The addition of steel fibers to UHPC reduced crack widths compared to ordinary concrete, attributed to the fiber bridging effect. Marchao et al. [9] investigated the efficiency of confinement reinforcement in anchorage zones using ordinary reinforced concrete (ORC) and high-performance fiber-reinforced concrete (HPFRC). Their research showed that the presence of fibers helped maintain the integrity of the specimen during testing and significantly reduced crack width. Jalal et al. [10] examined the behavior of the end zone of post-tensioned beams made of fiber-reinforced concrete under dynamic loading. Incorporating fibers led to a 50% reduction in reinforcement and improved the strain energy of the end zone. The findings suggested that FRC effectively controlled bursting and reduced strain along the length of the beam during full pre-stress force transfer. Li et al. [11] presented a study on the mechanical behavior of a diaphragm-blister integrated anchorage system used in prestressed ultra-high performance concrete box-girder bridges. Their research highlighted that the strain-hardening behavior of UHPC contributed to the loading capacity of the anchorage blister, emphasizing the importance of considering the tensile strain capacity of UHPC in design. Vavrus and Kralovanec [12] presented an analysis of the load-carrying capacity of anchorage zones using steel fiber-reinforced concrete. Results suggested that adding fiber-reinforced concrete with a higher content of fiber can increase load-bearing capacity, specifically with a quantity of fiber of 110 kg/m3 in the vicinity of the anchorage plate.
While FRC offers clear advantages in prestressed concrete members, further research is needed to comprehensively understand its behavior and potential benefits. In particular, the behavior of the eccentric anchorage zone in prestressed girders made of FRC has not been extensively investigated. Previous studies have largely focused on concentrically loaded anchorage zones or used fibers to reduce reinforcement in different parts of the concrete, but they have not adequately explored the combined effects of steel fibers, local zone spiral bar size, and general zone reinforcement in eccentric anchorage zone, which is very common in practice. This study fills this gap through finite element analysis of eccentric anchorage zones in prestressed girders made with fiber-reinforced concrete. The primary focus of this investigation is to analyze the influence of three crucial variables: the volume ratio of fibers, the quantity of reinforcement in the local zone, and the quantity of reinforcement in the general zone.
2. RESEARCH METHODOLOGY
ABAQUS software is used to conduct a numerical analysis to study the behavior of steel fiber-reinforced eccentric anchorage zones in prestressed girders. The research employs three-dimensional solid elements in a non-linear finite element analysis to comprehensively evaluate the performance and strength characteristics of the eccentric anchorage zone with fiber-reinforced concrete. The methodology involves developing a 3D model, defining material properties, applying loading conditions, performing non-linear analysis, and interpreting the results. This methodology provides a robust basis for thoroughly investigating the behavior and strength of steel fiber-reinforced eccentric anchorage zones, enabling a deeper understanding of their performance in prestressed girders.
3. STUDY SPECIMENS AND VARIABLES
The research includes finite element analysis for thirty eccentric anchorage zone blocks with dimensions of 1310x870x1850 mm. These dimensions were selected according to the American Association of State Highway Transportation Officials (AASHTO) approximate method section 5.8.4.5 [13]. As shown in Fig. (2), each block includes two anchorage devices type VSL E 5-19 [14, 15]. The anchorage devices are positioned in an eccentric manner, with a distance of 200 mm from the block's center. Consequently, the resultant of the forces applied to the anchorage heads of both devices will exhibit an eccentricity of 200 mm from the block's center. As illustrated in Fig. (3), each anchorage device's local zone is confined by a 365 mm diameter spiral of steel bars, with 6 turns of 50 mm pitch between the turns [14, 15]. Additionally, reinforcement is provided to withstand bursting tensile stresses within the general zone, covering the two directions. A single closed tie, 16 mm in diameter, was used as spalling reinforcement around both anchorage plates in the loaded area. End-hooked steel fibers measuring 0.3 mm in diameter and 25 mm in length have been used in this study. The study encompasses three variables: the fiber-to-concrete volume ratio, the local zone spiral bar size, and the general zone tie bar size. The study includes five groups of eccentric anchorage zone blocks with different fiber volume ratios, that range from 0% to 2%. Furthermore, each group consists of six blocks with varying sizes of reinforcement bars for both the local and general zones. Table 1 provides a detailed summary of the specimens and the variables considered in the study.
| Group No. | Specimen No. |
Fiber volume ratio vf % |
Spiral bar size (mm) |
Tie bar size (mm) |
|---|---|---|---|---|
| G1 | A-00-20-10 | 0 | 20 | 10 |
| A-00-16-10 | 16 | 10 | ||
| A-00-00-10 | 0 | 10 | ||
| A-00-20-08 | 20 | 8 | ||
| A-00-20-00 | 20 | 0 | ||
| A-00-00-00 | 0 | 0 | ||
| G2 | A-05-20-10 | 0.5 | 20 | 10 |
| A-05-16-10 | 16 | 10 | ||
| A-05-00-10 | 0 | 10 | ||
| A-05-20-08 | 20 | 8 | ||
| A-05-20-00 | 20 | 0 | ||
| A-05-00-00 | 0 | 0 | ||
| G3 | A-10-20-10 | 1 | 20 | 10 |
| A-10-16-10 | 16 | 10 | ||
| A-10-00-10 | 0 | 10 | ||
| A-10-20-08 | 20 | 8 | ||
| A-10-20-00 | 20 | 0 | ||
| A-10-00-00 | 0 | 0 | ||
| G4 | A-15-20-10 | 1.5 | 20 | 10 |
| A-15-16-10 | 16 | 10 | ||
| A-15-00-10 | 0 | 10 | ||
| A-15-20-08 | 20 | 8 | ||
| A-15-20-00 | 20 | 0 | ||
| A-15-00-00 | 0 | 0 | ||
| G5 | A-20-20-10 | 2 | 20 | 10 |
| A-20-16-10 | 16 | 10 | ||
| A-20-00-10 | 0 | 10 | ||
| A-20-20-08 | 20 | 8 | ||
| A-20-20-00 | 20 | 0 | ||
| A-20-00-00 | 0 | 0 |
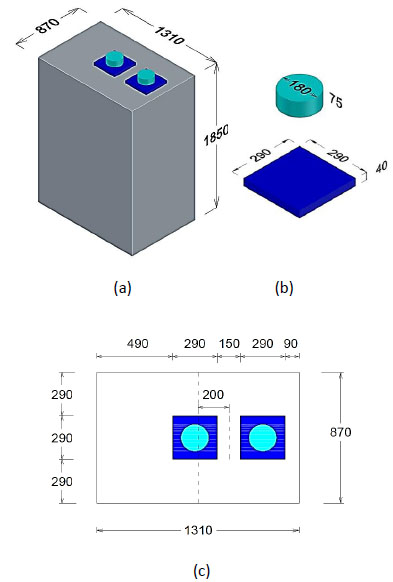
Dimensions of the specimens (mm), (a) concrete block, (b) anchorage plate and wedge plate, (c) top view showing location of the anchorage plate.
4. NUMERICAL FINITE ELEMENT ANALYSIS OF THE ECCENTRIC ANCHORAGE ZONE BLOCK
This research employs ABAQUS, a versatile software capable of addressing a broad spectrum of nonlinear and linear problems, to conduct finite element analysis on the eccentric anchorage zone blocks of prestressed girders made of fiber-reinforced concrete.
4.1. Geometric Modeling and Boundary Conditions
The anchorage plate, wedge plate and concrete block were modeled using three-dimensional solid elements. To represent the reinforcements, parts of deformable “wire” were employed, where a wire is depicted as a line in ABAQUS/CAE. The model’s bottom surface was fixed in the Y direction, while an axial load was applied through a specified vertical displacement on the anchorage heads (wedge plates), using an amplitude function (smooth step). The analysis was conducted in Step-1 (Dynamic, Explicit), following the initial step of simulation setup.
4.2. Material Modeling
Once the geometric input was completed, the next step was to input the material properties into ABAQUS. The forthcoming sub-sections present a comprehensive account of the procedures undertaken during this phase.
4.2.1. Fibrous Concrete
The model of Concrete Damage Plasticity (CDP), a feature in ABAQUS, was employed to characterize the response of concrete under various loading conditions. This model incorporates concrete degradation and considers both primary failure modes: crushing under uniaxial compression and cracking under uniaxial tension. To define the plasticity behavior of concrete, several parameters were necessary, including the concrete plastic potential eccentricity, the dilation angle (ψ), the ratio of compressive stress in the biaxial state to that in the uniaxial state (fbo / fco), the shape factor of the yielding surface (K), and the viscosity parameter. The required CDP parameters used in this study are provided in Table 2 [16-20].
| CDP parameters | Value |
|---|---|
| Dilation angle (ψ) | 31° |
| Eccentricity | 0.1 |
| biaxial/uniaxial ratio (fbo / fco) | 1.16 |
| K | 0.667 |
| Viscosity parameter | 0 |
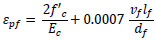
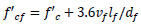
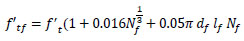
For the stress-strain relationship of the fibrous concrete in compression, a strain-hardening methodology was employed in this research. The material model initially responds linearly up to 30% of the compressive strength of fiber-reinforced concrete, transitioning to a parabolic stress-strain curve until the effective stress reaches the compressive strength. After this threshold, the material was assumed to behave with perfect plastic until crushing took place [20-22]. The relationship is defined by the following equations [21, 23, 24]:
 |
(1) |
 |
(2) |
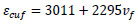 |
(3) |
where εpf is the strain at peak stress (f’cf), f’c is the cylinder compressive strength of plain concrete, εcuf is the maximum compressive strain, Ec is the elastic modulus of plain concrete, vf is the fiber volume ratio, lf is the fiber length and df is the fiber diameter.
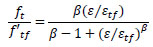
The following equation was used for the tensile stress-strain relationship of fibrous concrete [21, 25-27]:
 |
(4) |
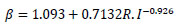
where ε is the tensile strain at stress ft, εtf is the strain at peak stress, f’tf is the tensile strength of fibrous concrete, and ß is a fiber parameter, which for hooked fibers can be calculated from the following equation [28]:
 |
(5) |
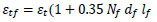
where R.I is a reinforcing index that is equal to wf lf /df;wf represents the ratio of the fibers' weight to the concrete weight. The following equations are used to calculate εtf and f’tf [23]:
 |
(6) |
 |
(7) |
where f’t and εt are the tensile strength and cracking strain of plain concrete, respectively, Nf is the number of fibers per unit area, which is equal to ƞo(4vf/πdf2), ƞo represents the orientation factor, which can be assumed to be 0.5 [23].
Concrete degradation in tension is determined by the damage parameter dt, defined as the ratio of the tensile stress after cracking to the ultimate tensile stress [18]. Additionally, a compressive stiffness recovery factor of wc=0.8 was applied, assuming that the compressive stiffness is largely restored when the crack closes as the load transitions from tension to compression.
4.2.2. Reinforcement
The reinforcement was simulated as an embedded region in the concrete structure. Its material properties were defined using a linear elastic-perfectly plastic model, with an elastic modulus set to 200 GPa.
4.2.3. Plates
The wedge and anchorage plates were modeled with linear elastic material properties, where the elastic modulus was set to 200 GPa. To represent the interactions between the anchorage plates and both the concrete and the wedge plate, “Tie constraints” were employed [19].
4.3. Element Types and Mesh Generation
As illustrated in Fig. (4), all the solid members (anchorage plates, wedge plates and concrete) were discretized utilizing the first-order hexahedral elements. The C3D8R element was used for this purpose, which consists of eight nodes and incorporates reduced integration and hourglass control. These elements are known for providing accurate results while keeping computational costs at a minimum for three-dimensional analyses. The reinforcement was modeled using a two-node, three-dimensional truss element designated as T3D2. A general element size of 100 mm was employed in this analysis [19].
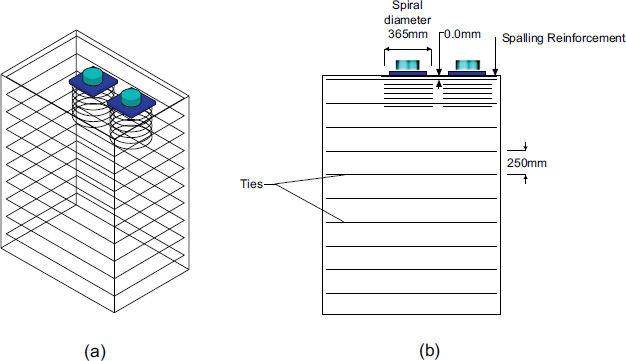
Reinforcement details of the specimens, (a) 3-d view, (b) longitudinal section.
Elements and meshing.
5. RESULTS AND DISCUSSION
The subsequent sections provide the results, highlighting the impact of various study parameters on the ultimate load capacity and the load-displacement behavior of the specimens. The included displacement in this relationship is the vertical displacement of the anchorage head.
5.1. Effect of Fiber Volume Ratio
Table 3 presents the ultimate load for all specimens, organized to highlight the influence of fiber volume ratio on their performance. The specimens are grouped based on the bar size used for spiral/tie reinforcement. The last column of the table provides the percentage comparison of the ultimate load for fiber-reinforced specimens relative to those without fiber reinforcement within each group. Incorporating fibers had a pronounced impact, as the ultimate load of specimens increased by 30% to 50% with a fiber volume ratio of 2%, compared to the non-fiber-reinforced counterparts. The highest observed enhancement, as the effect of using 2% of fibers, was a 50% increase in ultimate load (from 9,987 kN for A-00-00-00 to 14,948 kN for A-20-00-00), and occurred in the group without any spiral or tie reinforcement. The bridging effect of steel fibers enhances the tensile strength of various sections in this group, which lack conventional reinforcement. The table also presents that most of the improvement in the ultimate load of the specimens is for a volume ratio of 1.5% of fibers, as the ultimate load increased between 26% to 47% for this volume ratio. On the other hand, using fibers with a volume ratio of 0.5% resulted in only a slight increase in the ultimate load, ranging from 1% to 8%. This indicates that the optimal fiber volume ratio for enhancing the ultimate load of the specimens examined in this study lies between 1% and 1.5%.
| Specimen No. |
Fiber volume ratio vf % |
Spiral bar size (mm) |
Tie bar size (mm) |
Ultimate load Pult (kN) |
Pult/ Pult,f0a % |
|---|---|---|---|---|---|
| A-00-20-10 | 0 | 20 | 10 | 17,799 | 100% |
| A-05-20-10 | 0.5 | 19,096 | 107% | ||
| A-10-20-10 | 1 | 22,597 | 127% | ||
| A-15-20-10 | 1.5 | 23,565 | 132% | ||
| A-20-20-10 | 2 | 24,197 | 136% | ||
| A-00-16-10 | 0 | 16 | 10 | 17,794 | 100% |
| A-05-16-10 | 0.5 | 19,025 | 107% | ||
| A-10-16-10 | 1 | 20,750 | 117% | ||
| A-15-16-10 | 1.5 | 22,682 | 127% | ||
| A-20-16-10 | 2 | 23,261 | 131% | ||
| A-00-00-10 | 0 | 0 | 10 | 14,659 | 100% |
| A-05-00-10 | 0.5 | 15,541 | 106% | ||
| A-10-00-10 | 1 | 17,311 | 118% | ||
| A-15-00-10 | 1.5 | 19,009 | 130% | ||
| A-20-00-10 | 2 | 19,078 | 130% | ||
| A-00-20-08 | 0 | 20 | 8 | 16,495 | 100% |
| A-05-20-08 | 0.5 | 17,784 | 108% | ||
| A-10-20-08 | 1 | 19,908 | 121% | ||
| A-15-20-08 | 1.5 | 22,163 | 134% | ||
| A-20-20-08 | 2 | 23,168 | 140% | ||
| A-00-20-00 | 0 | 20 | 0 | 14,313 | 100% |
| A-05-20-00 | 0.5 | 15,081 | 105% | ||
| A-10-20-00 | 1 | 17,091 | 119% | ||
| A-15-20-00 | 1.5 | 18,010 | 126% | ||
| A-20-20-00 | 2 | 19,218 | 134% | ||
| A-00-00-00 | 0 | 0 | 0 | 9,987 | 100% |
| A-05-00-00 | 0.5 | 10,104 | 101% | ||
| A-10-00-00 | 1 | 13,501 | 135% | ||
| A-15-00-00 | 1.5 | 14,713 | 147% | ||
| A-20-00-00 | 2 | 14,948 | 150% |
In an examination to test whether the fibers can completely replace reinforcement using the spiral/tie reinforcement, a comparison has been made between the fiber-reinforced specimens without spiral/tie reinforcement with the control specimen that has spiral/tie reinforcement but without fibers. The specimen A-00-20-10 has no fibers and is reinforced with spirals and ties with a bar size of 20 mm and 10 mm, respectively, and is taken as a control specimen for this comparison. The ultimate load for this specimen is 17,799 kN. The first comparison is made to check if the fibers can replace either the spiral or ties and the second comparison is to check if fibers can replace the entire reinforcement, which includes both spiral and ties. To test if the steel fibers can completely replace reinforcement using spiral reinforcement, specimen A-10-00-10 is used, which is fiber fiber-reinforced specimen with a volume ratio of 1%, with a tie bar size of 10 mm, and without spiral reinforcement. The value of ultimate load for this specimen is 17,311 kN which is close to the ultimate load of the control specimen. Meanwhile, specimen A15-00-10, which is similar to A-10-00-10, but with a fiber volume ratio of 1.5%, has an ultimate load of 19,009 kN, which is more than the ultimate load of the control specimen. These findings suggest that the optimal fiber volume ratio for maximizing the ultimate load of the tested specimens is between 1% and 1.5%.
Similarly, and to test if the steel fibers can completely replace reinforcement using tie reinforcement, A-10-20-00 is used, which is a fiber-reinforced specimen with a volume ratio of 1%, with a spiral bar size of 20 mm, but without tie reinforcement. The ultimate load for this specimen is 17,091 kN, which is close to the ultimate load of the control specimen. Specimen A15-20-00 is similar to A-10-20-00, but with fiber volume ratio of 1.5%, and has an ultimate load of 18,010 kN, which is more than the ultimate load of the control specimen. Hence, steel fibers with a volume ratio of 1%-1.5% can completely replace reinforcement using the tie reinforcement of the specimens included in the study.
To check if the fibers can completely replace reinforcement using the entire reinforcement (spiral and tie), specimen A-20-00-00 is compared with the control specimen. Specimen A-20-00-00 has no spiral or tie reinforcement but is fiber-reinforced with a volume ratio of 2%. The ultimate load of this specimen is 14,948 kN, representing 84% of the ultimate load of the control specimen. This means using up to 2% of steel fibers for the studied specimen cannot replace the entire reinforcement, but 84% of the ultimate load of a reinforced specimen can be reached.
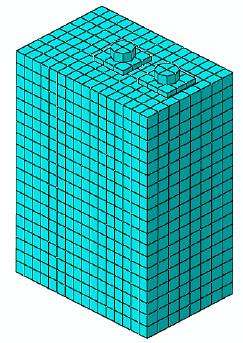
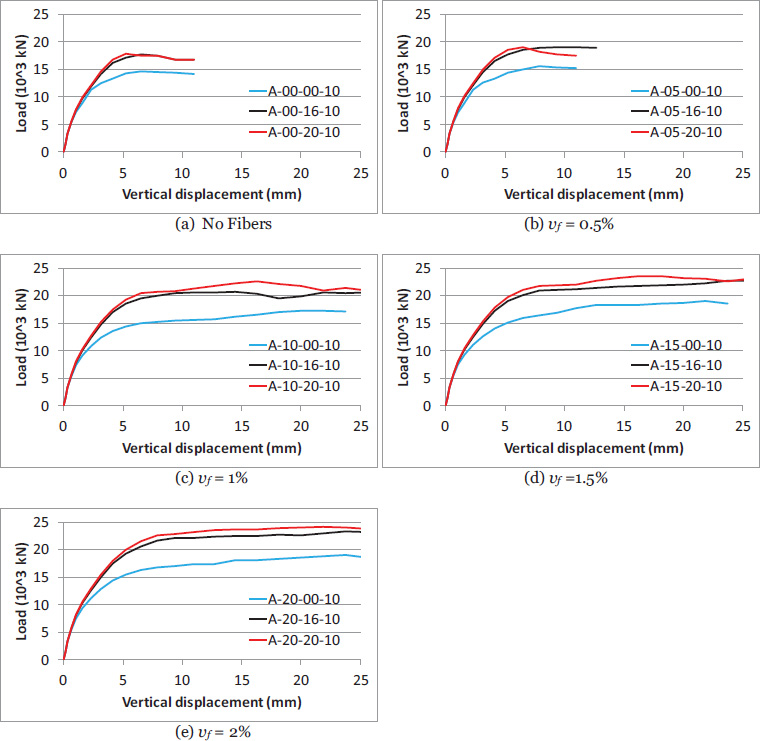
Fig. (5) shows the load-vertical displacement curves for the specimens across different groups. During the initial linear phase, the specimens displayed similar responses, but then some different behavior after that range. Specimens reinforced with fibers exhibited flatter load-displacement curves, indicating a more ductile failure mode compared to those without fibers.
Load-displacement relationship for the specimens showing the effect of fiber volume ratio.
5.2. Effect of Spiral Reinforcement
Table 4 presents the influence of spiral reinforcement on the ultimate load of the specimens in different groups. All the specimens in this table have the same tie bar size of 10 mm. The final column of the table shows the percentage of the specimens' ultimate load relative to the ultimate load of the case without spiral reinforcement for each group. The ultimate load of the specimens tends to increase as the spiral bar size increases. With a 20 mm spiral bar size, the load increased by 21% to 31% compared to the specimens without this reinforcement. The lowest observed increase (21%) occurred in the group of specimens without fiber reinforcement. For the various specimen groups, increasing the spiral bar size from 16 mm to 20 mm resulted in an ultimate load increase ranging from 0% to 11%.
Fig. (6) shows the effect of spiral reinforcement on the load-vertical displacement curves of the specimens. During the initial linear phase, the specimens displayed similar responses and then a close behavior after that range. Regardless of the bar size of the spirals, the value of vertical displacement at ultimate load is more for the groups with fiber reinforcement.
| Specimen No. | Fiber volume ratiovf % |
Spiral bar size (mm) |
Ultimate load Pult (kN) |
Pult/ Pult,s0a % |
|---|---|---|---|---|
| A-00-00-10 | 0 | 0 | 14,659 | 100% |
| A-00-16-10 | 16 | 17,794 | 121% | |
| A-00-20-10 | 20 | 17,799 | 121% | |
| A-05-00-10 | 0.5 | 0 | 15,541 | 100% |
| A-05-16-10 | 16 | 19,025 | 122% | |
| A-05-20-10 | 20 | 19,096 | 123% | |
| A-10-00-10 | 1 | 0 | 17,311 | 100% |
| A-10-16-10 | 16 | 20,750 | 120% | |
| A-10-20-10 | 20 | 22,597 | 131% | |
| A-15-00-10 | 1.5 | 0 | 19,009 | 100% |
| A-15-16-10 | 16 | 22,682 | 119% | |
| A-15-20-10 | 20 | 23,565 | 124% | |
| A-20-00-10 | 2 | 0 | 19,078 | 100% |
| A-20-16-10 | 16 | 23,261 | 122% | |
| A-20-20-10 | 20 | 24,197 | 127% |
Load-displacement relationship for the specimens showing the effect of spiral reinforcement.
5.3. Effect of Tie Reinforcement
Table 5 presents the influence of tie reinforcement on the ultimate load of the specimens in different groups. All the specimens in this table have the same spiral bar size of 20 mm. The final column of the table shows the percentage of the specimens' ultimate load relative to the ultimate load of the case without tie reinforcement for each group. The specimens’ ultimate load increases with an increase in tie bar size. Compared to the case of specimens without tie reinforcement, the ultimate load increased in the range between 24% (from 14,313 kN for A-00-20-00 to 17,799 kN for A-00-20-10) and 32% (from 17,091 kN for A-10-20-00 to 22,597 kN for A-10-20-10) by using tie bar size of 10 mm. This increase in the ultimate load is attributed to the tie's ability to effectively resist tensile stresses in the general zone. This reinforcement prevents the formation of brittle tensile cracks, thereby enhancing both the load-carrying capacity and the structural integrity of the specimens under loading. Again, the minimum increase of the ultimate load for this case (24%), as the result of using tie reinforcement, was for the group of specimens without fiber reinforcement.
| Specimen No. |
Fiber volume ratio vf % |
Tie bar size (mm) |
Ultimate load Pult (kN) |
Pult/ Pult,t0a % |
|---|---|---|---|---|
| A-00-20-00 | 0 | 0 | 14,313 | 100% |
| A-00-20-08 | 8 | 16,495 | 115% | |
| A-00-20-10 | 10 | 17,799 | 124% | |
| A-05-20-00 | 0.5 | 0 | 15,081 | 100% |
| A-05-20-08 | 8 | 17,784 | 118% | |
| A-05-20-10 | 10 | 19,096 | 127% | |
| A-10-20-00 | 1 | 0 | 17,091 | 100% |
| A-10-20-08 | 8 | 19,908 | 116% | |
| A-10-20-10 | 10 | 22,597 | 132% | |
| A-15-20-00 | 1.5 | 0 | 18,010 | 100% |
| A-15-20-08 | 8 | 22,163 | 123% | |
| A-15-20-10 | 10 | 23,565 | 131% | |
| A-20-20-00 | 2 | 0 | 19,218 | 100% |
| A-20-20-08 | 8 | 23,168 | 121% | |
| A-20-20-10 | 10 | 24,197 | 126% |
Fig. (7) shows the effect of tie reinforcement on the load-vertical displacement curves of the specimens. During the initial linear phase, the specimens displayed similar responses and then some different behavior after that range. Specimens with tie reinforcement exhibit flatter load-displacement curves compared to those without ties. This behavior reflects enhanced energy dissipation and ductility attributed to the tie reinforcement's ability to restrain crack propagation effectively. Positioned in the general zone, tie reinforcement resists tensile stresses in this region, thereby mitigating the risk of brittle tensile failure.
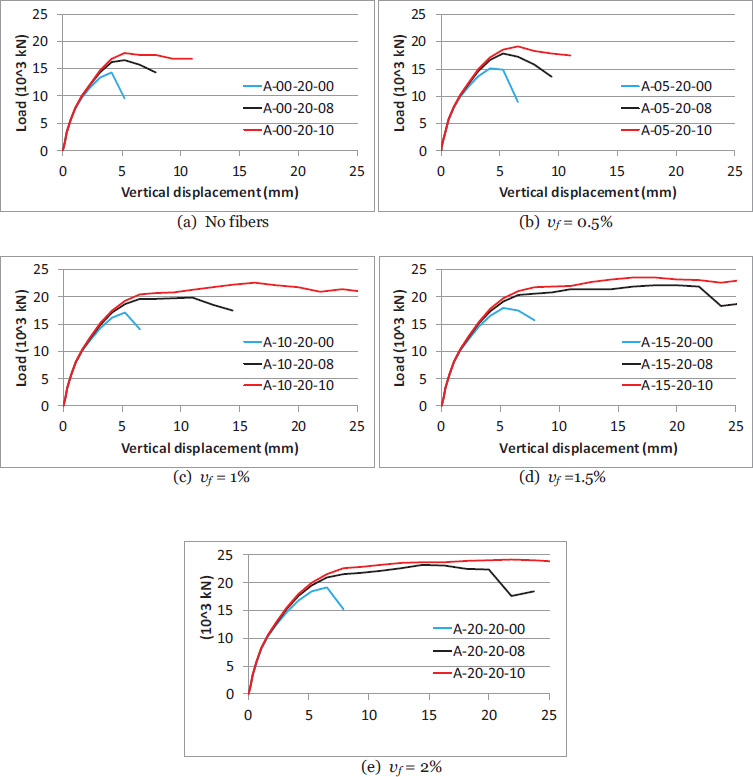
Load-displacement relationship for the specimens showing the effect of tie reinforcement.
5.4. Bursting Stresses
Fig. (8) shows the contours for bursting stresses in the elastic stage at the model surfaces in both the long and short directions for two specimens: A-00-16-10 (without fibers) and A-15-16-10 (with a volume ratio of 1.5% of fibers). In the longitudinal direction, bursting stresses spread across the area between the two anchorage devices. Furthermore, these stresses are primarily concentrated in the general zone, and are distributed in a depth approximately equal to the length of each respective direction. These stress results align with previous studies [1, 5, 19, 30], which reported similar distributions and locations. The bursting stress patterns were nearly identical for all specimens, suggesting that the variables included in the study had no influence on this stress type within the elastic range. Only results for these two specimens are shown in Fig. (8), and the other specimens demonstrated a similar distribution of these stresses.
5.5. Cracking Pattern
The ABAQUS program lacks a specific tool for displaying crack extent in the model; however, parameters such as logarithmic strain, plastic strain, or tensile damage can serve as indicators of crack formation. In the current study, the tensile damage parameter (DAMAGET) was employed to indicate the propagation of cracks, with results for a typical specimen shown in Fig. (9) from two perspectives. In this specimen, the red areas indicate that tensile damage is in the range of 58%–64% in certain elements. It is evident that cracks in both directions start from the anchorage devices and are primarily concentrated at the top of the specimens, within the local zone. Additionally, a horizontal crack is visible on the side away from loading, attributed to tension caused by load eccentricity. Notably, the crack patterns in this study align closely with those reported in previous studies [4, 19, 31].
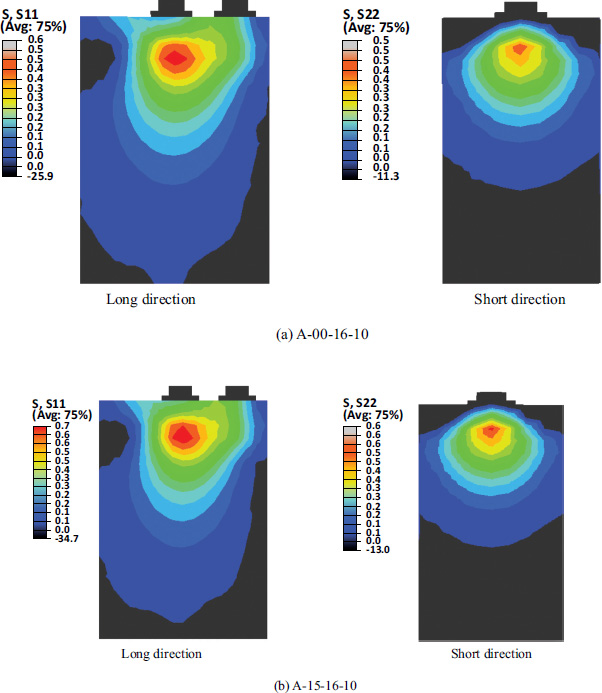
Bursting stress contours (MPa).
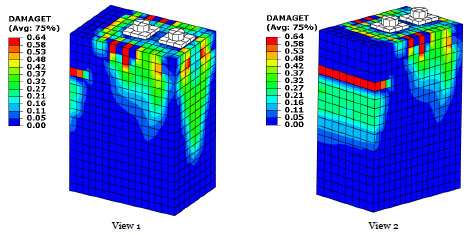
Cracking patterns for specimens.
| Specimen No. | Ultimate load (kN) | Pult/ Pult,b | |
|---|---|---|---|
|
Current Study Pult |
Roberts Eq. Pult,b |
||
| A-00-16-10 | 17,794 | 15,116 | 1.17 |
| A-00-20-10 | 17,799 | 15,258 | 1.16 |
5.6. Validation of the FEA Model
To verify the FEA model and assess its accuracy, the results for two specimens from the current study were compared with the ultimate load capacity prediction from Roberts' equation [29], which is based on experimental work. Roberts’ work was a part of the study carried out in the early 1990s at the University of Texas at Austin with backing from the National Cooperative Highway Research Program (NCHRP) [1, 29, 30], which is regarded as a foundational study in the field of anchorage zones. In applying this equation, the specimens from the current study were modeled with two anchorage zones, each with an effective supporting area of 400x400 mm. As shown in Table 6, the ultimate load results from the current study align closely with those predicted by Roberts' equation, with a ratio ranging from 1.16 to 1.17. The slightly higher ultimate load in the current study is likely due to the larger effective supporting area in the FEA model compared to that used in Roberts' equation calculations. Additionally, both studies indicate a minimal effect on the ultimate load by raising the size of the bar for the spiral reinforcement from 16 mm to 20 mm. This limited effect is due to the maximum lateral confining strength, capped at 8.3 MPa in Roberts' equation, beyond which increasing the spiral bar size has no impact. Similarly, the FEA results from the current study show only a slight increase in ultimate load between the two specimens in Table 6 when the spiral bar size is increased from 16 mm to 20 mm, which is consistent with Roberts' equation results and further validates the FEA model.
CONCLUSION
Key insights into the behavior were gained through finite element analysis of thirty fiber-reinforced eccentric anchorage zone specimens, leading to the following primary conclusions:
- The incorporation of steel fibers notably enhances the ultimate load of eccentric anchorage zone specimens, with increases ranging from 30% to 50% observed at a steel fiber volume ratio of 2%.
- The maximum increase in the ultimate load due to the use of 2% steel fibers was for the group of specimens lacking spiral or tie reinforcement.
- The majority of the ultimate load enhancement occurred at a steel fiber volume ratio of 1.5%, with increases ranging from 26% to 47%. The optimal volume ratio of steel fibers for improving the ultimate load of the studied specimens was determined to be between 1% and 1.5%.
- Using steel fibers with a volume ratio of 1%-1.5% can replace using either the spiral, or tie reinforcement for the specimens included in the study.
- Using steel fibers with a volume ratio of up to 2% could not replace the entire reinforcement, but it allowed the specimens to reach 84% of the ultimate load of a reinforced specimen.
- The fiber-reinforced specimens demonstrated more ductile failure modes compared to those without fibers.
- The ultimate load of the specimens increased between 21% and 31% by utilizing a bar size of 20 mm for the spiral reinforcement, with the minimum increase in this load for the group of specimens without fiber reinforcement.
- Using a tie bar size of 10 mm enhanced the specimens' ultimate load by 24% to 32%, with the smallest improvement observed in specimens lacking fiber reinforcement.
- The specimens with tie reinforcement had more ductile failure compared to the specimens without ties.
AUTHORS' CONTRIBUTION
The author confirms sole responsibility for the following: study conception and design, data collection, analysis and interpretation of results, and manuscript preparation.
LIST OF ABBREVIATIONS
| FRC | = Fiber-reinforced concrete |
| ORC | = Ordinary reinforced concrete |
| UHPC | = Ultra-high performance concrete |
| HPFRC | = High-performance fiber-reinforced concrete |
| AASHTO | = American Association of State Highway Transportation Officials |
| CDP | = Concrete Damage Plasticity |
AVAILABILITY OF DATA AND MATERIALS
The data and supportive information are available within the article.
ACKNOWLEDGEMENTS
Declared none.

