All published articles of this journal are available on ScienceDirect.

Ability of Technologies to Collect the Positioning and Occupancy of Work Crews and Resources on Construction Job Sites
Abstract
Introduction
Efficiently updating construction schedules is vital for managing dynamic workflows. Traditional methods like Gantt charts rely on manual updates, but newer approaches, such as Chronographic Modelling and Dynamic Modelling of Occupancy Rate Scheduling (DMORS), require tracking spatial positioning and occupancy rates of teams and resources. Given the complexity of these tasks, emerging technologies are being adopted to enhance data collection.
Methods
This study reviews recent advancements in tracking construction site occupancy and spatial positioning. It categorizes these technologies into three main types: image and video capture, 3D point cloud generation, and sensor-based tracking systems. Each method is evaluated based on seven essential criteria: data collection speed, portability, accuracy, worksite impact, post-processing time, accessibility, and technology maturity.
Results
The research provides a selection framework for contractors, helping them choose the most suitable tools based on project size and complexity. High-precision tools like LiDAR and laser scanning are ideal for large contractors requiring detailed modelling, while smaller firms may prefer cost-effective solutions such as manual data collection with photos or videos.
Discussion
This research highlights that no single technology meets all needs for tracking construction site occupancy. High-precision tools offer accuracy but may disrupt work, while simpler methods are easier to use but less detailed. So, depending on the size of the contractor or the project, the best technology may vary.
Conclusion
Ultimately, this paper supports the integration of space planning schedules in construction management by offering a structured approach to implementing modern data capture technologies. The study also highlights future trends, advocating for multi-technology integration to improve accuracy and exploring the potential of artificial intelligence for automated data analysis.
1. INTRODUCTION
Updating the construction schedule is an essential step in the smooth running of any project. This regular update will allow the contractor to quickly detect deviations from the game plan and therefore, to promptly take the necessary measures to bring the project back on time. This requires collecting information on the actual course of tasks. For a Gantt schedule, this task is well integrated into specialized software. This update is therefore well integrated into the contractors' management processes.
However, new planning techniques and methodologies have been proposed in recent years, such as the Chronographic Modelling and the Dynamic Modelling of Occupancy Rate Schedule (DMORS) both using space planning [1-4]. When updating a schedule based on space planning, it is crucial to consider not only the actual dates, but also the positioning of on-site resources and, in the case of DMORS, their occupancy. However, regularly recording the positioning of work teams on a site can quickly prove to be a considerable task. Thus, using technology could offer a solution to optimize the updating of a schedule based on space planning.
This article first reviews the most recent literature on technologies that make it possible to identify the positioning of work teams and resources. Then, a series of criteria is proposed to evaluate the performance of these technologies. This will allow a contractor to prioritize these criteria and choose the survey technology best suited for their needs.
1.1. Background and Justification
When it comes to data collection on construction sites, the topic of construction 4.0 and its principles is a good place to start [5-7]. Especially in the face of the digitalization of construction, which seems to be in construction 4.0 concepts, which therefore encompasses the entire construction project, from the initial idea to the final delivery to the customer. However, this research is more specific to a space planning schedule.
According to Rankohi et al. the Internet of Things or IoT, associated with tracking technologies, can improve automation through real-time capturing, accessing, tracking, and sharing information, which ultimately leads to more decentralized decision-making [8]. More specifically, Raza [9] points out that monitoring in construction offers the following advantages: i) Detection: simple presence of objects, ii) Identification: by class of object or unique instance, iii) Location information: specific co-ordinates or by area, iv) Object tracking: whether an object is moving or not, v) Object properties: information on shape, weight, speed, ownership, supplier information, etc., vi) Memory representation: historic data on object behaviours, and vii) Application specific processes: using tracking tags to manage objects, control them or capture alternate data.
In addition, Boton et al. highlighted the importance of choosing technological equipment that meets the criteria of durability, resistance and versatility, in addition to traditional needs such as the operating system, performance and storage capacity [10]. Also, with the rapid evolution of technologies, the last 20 years have seen a multitude of literature reviews seeking to study and classify the technologies used to collect information. El-Omari and Moselhi outlined the design of an IT platform aimed at automating data collection from construction sites to enhance time and cost tracking, as well as overall project control [11, 12]. So, they examined their capa-bilities to collect information on labour, material, equip-ment, quantity, task progress, weather conditions and productivity, problem areas, etc.
Later, Omar and Nehdi mentioned that there are three types of RFID tags: active, passive, and hybrid. Active tags have their own power supply and transmit signals to the reader [13]. Passive tags, on the other hand, rely on energy received through induction from the reader and are effective at distances up to about 15 metres. In contrast, active tags offer a much greater range, up to 500 metres, and can store more information. Hybrid tags can transmit signals but require activation by an external signal, such as a satellite. Omar and Nehdi also demonstrated group technologies and evaluated them with the following criteria: setup and cost, automation level, automated analysis, applicability, training required, pre-processing level, integrated readiness, meaningful support for decision-makers, computational cost, project size and comments [13].
Moselhi, et al. drew a detailed portrait of capture technologies and listed their capabilities, limitations and accuracy [14]. In fact, vision-based technologies, such as laser scanning and photogrammetry or their integration, are good choices to generate point cloud data. However, they need post-processing steps for 3D modelling, which is time-consuming. Above all, they studied research that merges collection technologies to combine their capabilities. Finally, they mentioned that literature indicates that relying on a single source of sensory data is insufficient for assessing the status of onsite construction operations. For instance, laser scanner point cloud data require a direct line-of-sight and become less effective as the project progresses and the site becomes more congested. Employing additional data acquisition technologies could mitigate the limitations of relying solely on one type of remote sensing technology during various phases of the project.
Although Artificial Intelligence (AI) was not part of this study, AI could eventually lend a hand in making the identification process more efficient. But the integration of AI in the construction industry still faces some challenges. Regona et al. [15]. highlighted key challenges of AI in construction, including the need for continuous algorithm training, data acquisition issues due to industry fragmentation, incompatibility with current practices, and the ongoing investment required to maintain accurate data. Additionally, many studies have noted that applying AI technologies in the construction industry is difficult due to low accuracy caused by limited data availability [16]. Datta et al. emphasized that AI and ML have the potential to transform productivity in construction by leveraging growing data and digital advancements to improve processes across the sector [17].
2. METHODOLOGY
2.1. Research Goal and Objectives
If you want to promote the adoption of space planning by the construction industry, you need to be able to track and update the schedule. As explained in the introduction, it is necessary to record the positioning and, if possible, the space occupied by resources and work teams. However, it is worth mentioning that since space planning is not applied on a large scale on construction projects, it is difficult to question the needs of contractors on this topic. This does not prevent us from asking the question, reviewing the state of current technologies and determining their abilities according to the needs of the contractors. The goal of this research is therefore to offer a platform and a methodology that will allow contractors to choose the capture technology that is best suited to their needs.
2.2. Research Methodology
For this research, a literature review of the most recent developments in the available technologies to determine the positioning of resources and work teams was carried out. Thus, the first-known and established technologies, such as manual note-taking and photos and videos, are presented. Then, the latest developments are presented on technologies that allow the performance of 3D reconstructions (RGB, RGB-D and stereo camera images), 3D scans (LiDAR and laser scanning) and sensors (GPS, UWB and RFID). Then, the performance of each of these technologies is evaluated according to seven (7) criteria, which allows an entrepreneur to prioritize these criteria and choose the technology that will be best suited to their needs. A validation was therefore carried out by presenting examples of prioritization and technological choices according to the size of the company and the projects.
2.3. Research Constraints and Limits
It should be mentioned that the goal is not to identify all the technologies available, nor to automatically detect items on construction sites, but rather to take stock of the state of the technologies at the time of writing this article. Thus, during this literature review, we focused on the essential points allowing contractors to choose the best technology to collect the positioning of work teams and resources to update a schedule using space planning.
Moreover, the implementation of a new technology by a contractor generally requires a significant investment on their part, not only for the purchase of the technology itself, but also in terms of the internal resources needed to ensure its successful deployment, making the cost evaluation a complex task. Therefore, the direct costs associated with acquiring these technologies will not be addressed.
In addition, it was decided to study the application of technologies individually, rather than in combination. The authors also acknowledge that following the movement of the workers on the construction site represents a moral dilemma for their privacy. Thus, the workers and the unions should always be consulted when implementing those technologies.
3. RESULTS
3.1. Traditional Methods
3.1.1. Manual Takeoff
A first option would be to simply walk through the entire site and take notes on paper or with a digital tablet. Although digital tablets are getting lighter, a good-sized screen can be an asset, which can reduce portability. However, there is a multitude of tablet accessories available that can make using the tablets on construction sites more enjoyable. The impact on the work is therefore minimal, if not non-existent, because it is easy to go around the site and take notes without disturbing the work teams.
The time it takes to complete a takeoff depends on the level of detail that has been noted. The more details that are written during the takeoff, the longer the takeoff will take, but it will also be more accurate. The processing will therefore be minimal because it is done as the notes are taken. It should be noted that after the survey, it will be difficult, if not impossible, to extract more information than what has been noted.
If you use pen and paper, you will need to scan the statement if you want to share it, but phones usually have apps that allow you to scan documents. Otherwise, if you write on a digital tablet, the readings will be directly available, especially since the tools that allow you to write on a tablet or a computer screen are becoming more and more sophisticated and efficient. In addition, considering that all phones, tablets and computers can read PDFs, accessing the information is almost instantaneous.
3.1.2. Pictures and Videos
Contractors are already used to taking photos of certain parts of the site. However, as part of the update of the space planning schedule, it is necessary to photograph the entire project in detail. Also, most cameras can be programmed to take photos at regular intervals. In this situation, you just have to program the camera and walk through the whole project. Although there are cameras (standard and spherical) specially designed to be portable, the quality of photos and videos may not be sufficient. However, high-quality cameras tend to be larger, especially in the case of cameras specialized in taking spherical photos and videos.
The quality of the survey depends mainly on the quality of the camera used and the number of photos taken. In addition, some cameras and lenses can distort the image (Fig. 1), and if you just walk on the construction site with a camera in automatic mode, you may have several blurry photos that will be impossible to process (Fig. 2). Filming the construction site as a whole could help with this problem. However, the resolution of a movie is often lower than that of photos. There could therefore be a loss of detail in certain situations. But in any case, the impact on the work is minimal.
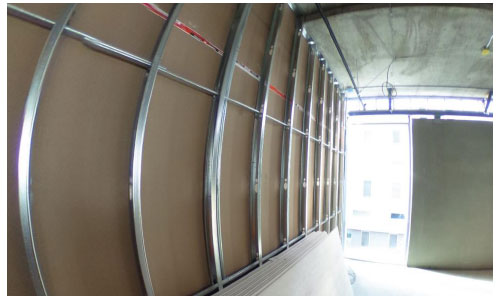
Distortion from a spherical image.
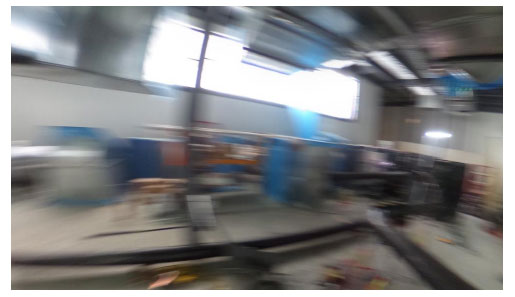
Blurry image from a camera in automatic mode.
After the survey, the processing will be long because it is necessary for a person to analyze each of the photos taken to extract the information. For standard photo processing, there is a multitude of software for viewing photos, which have various functionalities. However, spherical photo processing is more complex, as software to process spherical photos is rarer, so it is usually dependent on the software provided by the camera manufacturer.
Accessing photos (standard or spherical) is usually simple, as there are a multitude of solutions, whether local, on a network or on the cloud, to store and consult them. However, photographing the entire project, every time you want to analyze the positioning of the resources, will generate a very large number of photos. This requires considerable storage space, which can easily exceed one (1) terabyte (TB). Again, one solution would be to film the entire construction site, but the higher the quality and frame rate of the video, the larger the video size will be.
3.2. 3D Reconstruction
Several research projects already propose solutions that use computer vision to automatically detect the installation of building components monitor the movements and performance of workers compare 3D reconstruction to the 3D BIM model or dynamically detect workspaces [18-26]. However, in the context of 3D reconstruction, the goal is to use photogrammetry, stereo cameras or Time of Flight (ToF) cameras and specialized algorithms to create a large-scale 3D model of the project under construction. These solutions are usually designed to perform a 3D reconstruction of a limited number of objects with the help of specialized algorithms. As part of this research, we seek to identify the positioning of several objects directly on these 3D reconstructions. This requires producing the most detailed 3D reconstruction possible of the entire site.
According to Schöps et al. 3D reconstruction has numerous applications, including augmented reality, 3D modelling, and architecture [27]. The ability to create dense 3D models in real time or near real time on mobile devices, such as smartphones and tablets, is crucial for making 3D reconstruction accessible to non-expert users. Real-time feedback from the device enables users to assess the current quality of the reconstruction and identify areas where additional data is needed.
By analyzing the applicability of image-based 3D reconstruction for civil engineering projects, Fathi, et al. highlighted the emergence of many efficient and inexpensive technologies, particularly those utilizing computer vision techniques for capturing and modelling reality [28]. Generally, these techniques involve three major steps: i) collecting optical sensor data, ii) processing the raw sensor data into 3D points, and iii) modelling and extracting measurements from the generated 3D points. However, Fathi, et al. also mentioned that several factors can influence the quality of reconstruction (e.g., large-scale, far range, cluttered, poorly textured, repetitive patterns, etc.) and that there are still several major challenges that will have to be overcome before these capture methods can be applied to an entire site [28].
Scalable geometry reconstruction and understanding continue to be significant challenges. Existing methods often struggle with false loop closures in scenes with similar-looking rooms and typically lack the capability for live scene understanding [29]. Additionally, the high computational complexity of repeatedly generating the entire dense model results in poor scalability [30].
However, we cannot ignore the continuous increase in the computing capacity of processors and the continuous development of 3D reconstruction algorithms, such as the BuildingFusion, developed by Zheng et al. which proposes a semantic-aware structural building-scale reconstruction system that enables collaborative dense reconstruction at the building scale and provides real-time semantic and structural information [29]. This makes large-scale 3D reconstruction an interesting option.
3.2.1. Photogrammetry and RGB Images
If we focus more specifically on photogrammetry and the use of RGB photos, this section can be seen as a continuation of the section 3.1.2, as the goal is to take a series of RGB photos of an object and use a specialized algorithm to produce a 3D model, and there are a multitude of algorithms that can be used to produce a 3D reconstruction from photos. This technology, known as monocular RGB, is used in Simultaneous Localization and Mapping (SLAM), Visual Odometry (VO), or Structure from Motion (SFM) to achieve 3D reconstructions of the environments [31].
This type of 3D reconstruction requires photographing the site with even more precision and quality photos, so that the specialized algorithm can convert the photos taken into a 3D model. As mentioned above, this kind of processing is usually time-consuming and requires a lot of computing resources, even for small objects. This makes its application, with the algorithms available at the time of writing this article, for a complete building, unrealistic.
Good quality cameras are already available on the market and several software, both paid and free, are also available to process the photos and to generate and view the 3D model, which is usually available as a point cloud. You can even find smartphone applications that can directly generate 3D models. But this requires taking a very large quantity of good-quality photos of the site, the chances of the photographer hindering the work are not negligible.
The quality of the 3D reconstruction depends on the quality of the photos and the settings of the software used. This makes it difficult to assess the quality before the 3D model is generated. But it is still possible to generate a good-quality 3D model using this technology. Finally, portability depends on the size of the camera used, but generally, cameras that can take quality photos tend to be larger.
3.2.2. Stereo Camera
A first solution to the problems mentioned in section 6.1 is to use a stereo camera. This type of camera, often used in machine vision, uses two (2), or more, sensors and specialized software to simulate human 3D vision. When properly configured, it is possible to generate a real-time 3D reconstruction with this technology. Stereo cameras offer superior depth detection for 3D reconstruction compared to single-image systems and are already commercially available. However, the modelling solutions provided by these camera manufacturers are typically designed for technology developers and industrial applications, necessitating advanced computer programming knowledge for effective use [32]. But by using a good stereoscopic camera, it is possible to get a good-quality 3D model. However, although stereoscopic cameras are portable, they must be connected to a computer in order to process the information generated by this type of camera.
3.2.3. Time-of-Flight (ToF) Cameras, Depth Cameras, and RGB-D Images
Another solution is to use RGB-D images. These images are standard RGB images with the distance added as additional information. Obtaining RGB-D images can be done with the help of technologies such as the Kinect from Microsoft, Google’s Project Tango and the ToF camera.
ToF cameras involve active illumination and deliver range (or depth) data by measuring the time needed for a light signal to travel from the camera light source to the scene and back to the camera sensor. Unlike vision-based approaches that generate depth maps from standard camera images, depth sensors can measure depth in uniformly or weakly textured regions, which often dominate indoor scenes [27]. So, He and Chen raise several interesting properties that differentiate ToF cameras from other technologies that allow you to obtain RGB-D images: i) video-rate image acquisition, ii) compact and fixed structure, iii) illumination adaptation, iv) self-registration of dense depth data and colour images, v) small and light weight [33].
ToF cameras use active illumination to provide range (or depth) data by measuring the time it takes for a light signal to travel from the camera's light source to the scene and back to the camera sensor. Unlike vision-based approaches that create depth maps from standard camera images, depth sensors can measure depth in uniformly or weakly textured areas, which are common in indoor scenes [27]. In these systems, users walk around with a handheld device to reconstruct the scene, allowing them to add data where needed. However, these sensors are typically limited to indoor use due to strong background illumination from the sun and have a restricted depth range [34].
Additionally, Anderson, et al. [35] emphasized that the primary algorithmic challenge in implementing this idea is the same reason why ToF cameras have not yet dominated the 3D scanning market. ToF sensors suffer from very low X/Y resolution, adverse random noise behaviour, and a significant systematic measurement bias. Furthermore, since ToF cameras are active devices with their own illumination source, special precautions are necessary when operating multiple cameras simultaneously [36]. Additionally, despite improvements in signal-to-noise ratio (SNR) through various methods, superfluous noise remains a concern. Furthermore, challenges such as phase wrapping continue to require better solutions [33]. Even high-end phase-based depth cameras can experience deviations. This is why Frangez, Salido-Monzú, and Wieser [37] examined these deviations in distance measurements (Fig. 3).
Zollhöfer demonstrated that it is possible to have user-friendly methods that enable real-time 3D reconstruction while walking on site, using equipment readily available to users [38]. This makes scanning accessible even to non-technical staff and allows users to immediately address scanning errors (Fig. 4) during the reconstruction capture.
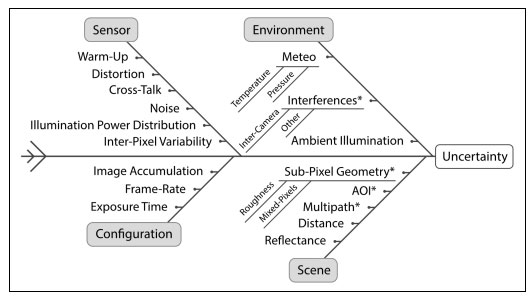
Sources of uncertainty for the distance measurements of ToF depth cameras [37].
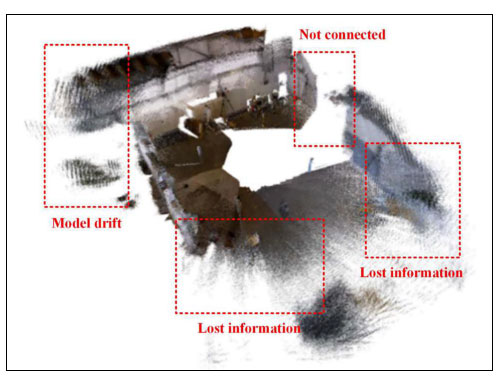
Common problems of 3D reconstruction using RGB-D images [39].
Kähler, et al. highlighted that while offline and real-time dense reconstruction are quite mature, real-time dense modelling and reconstruction have become feasible [30]. This is due to the availability of affordable RGB-D sensors and the performance of modern graphics processors. Rapid delivery of dense and highly detailed 3D environment reconstructions is currently one of the main frontiers in computer vision. Also, Hou, et al. proposed algorithms that can find optimal solutions for rapid movements, long-loop closing, multiple rotations, and large-scale reconstructions, thereby enabling the gene-ration of accurate and complete models [39].
3.3. 3D Scan
3.3.1. Laser Scanner
Another possibility is using a long-distance laser scanner, also known as a Ladar, to make a high-precision, full-colour 3D scan of the scene. Especially, its use is already widespread in the construction industry, among other things, to detect certain construction defects and deformations in structures (Fig. 5). Also, several models of laser scanners are available on the market. The challenge with laser scans is, therefore, to use their precision to control various parts of the construction process by generating a digital twin by comparing the scan with a 3D model of the building or to improve communication [40-45].
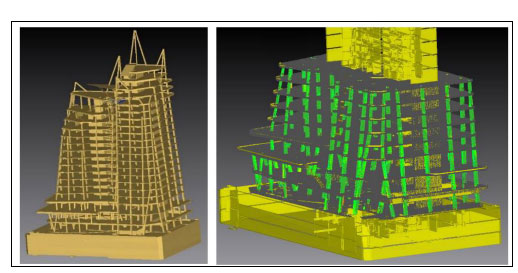
Left: 3D BIM model, right: 3D models and measured point cloud [44].
Most of these types of scanners need to be stationary when the scan is performed, this can have a significant impact on the work. In addition, they do not work very well when objects are moving during the scan process. However, it generates a high-precision 3D scan. For this reason, the effective and efficient collection of laser scan data can be carried out with the help of a prior optimization process, which can be called Scan Planning (P4S). Aryan, explain that some experts in the field have formalized the P4S problem as determining the minimum number of predefined viewpoints necessary to ensure complete scan coverage while meeting data quality requirements [46]. Thus, motivated by the need for automated P4S methods for applications in the building sector, they carried out a detailed review of the types of performance criteria that these methods must meet (accuracy, level of detail, level of completeness and registrability) as well as the parameters influencing these criteria.
3.3.2. LiDAR
LiDAR, which is the abbreviation for Light Detection and Ranging, is a technology that is specifically designed to make a high-precision 3D scan in real time, minimizing the impact on the work when the survey is carried out. However, this technology alone does not collect the colour of the elements, and colour can be an important factor in the identification of materials. But the fact that LiDAR is compact and fast makes it particularly efficient for scanning while on the move. Its use is widespread in the field of autonomous vehicle driving. On the construction side, it is possible to add LiDAR to Boston Dynamics' SPOT robot [47].
However, LiDAR is usually reserved for developers of systems and technologies who need its use. But combined technologies are starting to appear on the market, such as computer equipment manufacturers who have started to integrate Lidar into digital tablets [48]. Because of its quality and speed, LiDAR is well-suited for quickly producing accurate 3D reconstructions.
Its inability to collect the colour of items is a serious disadvantage. To overcome this limitation and to obtain a colour 3D model, in recent years, several research and technology developers have sought to merge LiDAR with other technologies, such as cameras, in order to add colour to scanner elements. Thus, the combination of these 2 technologies offers the potential to combine the advantages of LiDAR with those of cameras [49]. In this situation, the quality depends on the scanner used, and at the time of writing this article, the quality and accuracy of compact and handheld scanners may be questionable when used within the scope described in this article. Scanners that allow good accuracy are currently large and difficult to carry.
3.4. Position Sensors
Unlike the technologies presented above, which require moving around the entire construction site to obtain the position of assets, sensors offer the possibility of monitoring the position of assets and workers in real time directly from the office. However, it is necessary to install a sensor on each item you want to track and to make sure that it remains installed and avoids damage throughout its use. Sensors also tend to be susceptible to interference from electrical devices and metallic materials [50]. It should be noted, however, that the sensors do not directly determine the area occupied. This area must be determined indirectly, usually by noting the size of the object on which the sensor has been installed.
3.4.1. GPS
The Global Positioning System (GPS) is an interesting option, especially for outdoor environments. However, GPS requires a clear line of sight to orbiting satellites, so its application inside a building may be limited [51]. This means that its proper functioning depends on the reception of the signal from the satellites in orbit [12]. The standard GPS accuracy is 10-15 meters, 95% of the time [52].
Despite these particularities, with GPS, it is possible to obtain the position in real time, without the need to travel to the site. Especially since many computer items are already equipped with GPS sensors, their impact on the progress of the work is therefore negligible.
3.4.2. Ultra-Wideband (UWB)
The use of Ultra-wideband (UWB) sensors requires the installation of sensors and the use of stations (fixed or mobile) to obtain the position of the elements on which a sensor has been installed. They can be used both inside and outside a building. Cho, et al. mentioned that using this type of sensor to determine a fixed location (e.g., a ceiling, a wall, and a column) is not an easy task when construction is underway [53]. To apply this technology on construction sites, base stations (sensor nodes) must either be frequently moved to another location or be mobile. In addition, the network cables connecting all the stations can be cumbersome for the work teams on the construction site. Cho, also pointed out that UWB sensors have better signal penetration capability and high resistance to multipath distortion, and can therefore achieve better position accuracy [53].
UWB has several advantages over other tracking and positioning technologies [54]: i) has longer read ranges than laser or vision-based detection and tracking systems (up to 1000 m); (ii) can operate both indoors and outdoors; iii) requires a low average power consumption due to the low pulsation rate; and (iv) compared to RFID systems, UWB does not need to be integrated with other technologies to provide accurate 3D position estimation. In a search for UWB capabilities, Shahi et al. [54] achieved laboratory accuracy between 0.1 m and 2.0 m. Their data also showed that not only did the magnitude and variability of the error increase as the site became congested, but the direction of the error also changed.
3.4.3. RFID
In the manufacturing industry, radio-frequency identification (RFID) systems exist for the identification of objects on conveyors [50]. There are three types of RFID tags: active, passive, and hybrid. Passive tags obtain the required energy by induction from the readers, with a reading distance of up to 15m. The active tags, on the other hand, incorporate a battery which provides the necessary power for their circuits to propagate the signal to the reader and has a range of up to 500 m and can store a significant amount of information. Hybrid tags can transmit, but they must be activated by a signal, which can be a satellite.
According to El-Omari and Moselhi the use of RFID depends on the need to read data remotely and update the information stored on RFID tags [11]. They therefore pointed out that the application of RFID to identify work teams is important because they can easily be tracked as they move from one activity to another. However, this requires that RFID readers be installed around the construction site to track the movements of personnel and equipment, so that relevant information regarding their work activity and time spent is automatically collected. We would therefore be faced with the same problem as for UWB. Their main advantage is the ability to use handheld readers to read the information on the labels, making the reading faster and more efficient.
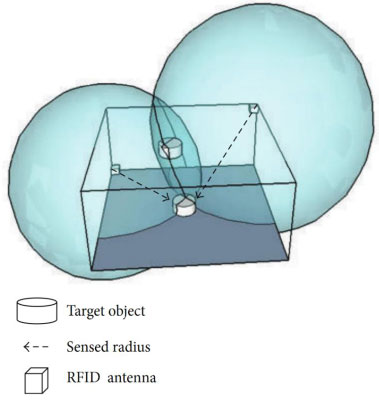
Trilateration method to calculate an object location using RFID [55].
However, as mentioned by Arif et al. marking all components is neither practical nor economical [50]. Furthermore, they mention that small-scale metal building materials pose challenges for the application and use of RFID tracking technology. RFID tags applied can suffer damage due to the inherent harsh nature of the building environment. When used on enclosed or partially covered construction sites, RFID tags experience a net decrease in communication range in the presence of metals in the vicinity [13]. One solution would be to identify only the piles of materials and certain important tools to limit the risk of damage and loss of the RFID tag.
Another one of the major flaws of RFIDs is that they have not been specifically designed to locate elements in space (3D location). This has not prevented some research from proposing solutions to locate RFID tags in space. So, Ko [55] developed a 3D RFID position detection algorithm using a trilateration method that calculates the position of the target object using the distances between the RFID antennas and the target object (Fig. 6). While Maneesilp et al. developed separate solutions for passive RFID tags and active tags [56]. However, their studies have shown that the application of the RFID system for 3D localization of materials on site encounters certain difficulties, as a high density of reference tags is required.
3.5. Capability
Remember that the objective is to help contractors find technology that will help them update a schedule using space planning. The technology should allow the contractor to regularly collect the position and occupancy of work teams and resources on the site. Several factors can influence the choice of the technology that will be the most advantageous for a contractor, such as the size of the site, the size of the contractor, the ability of the contractor to train his staff, the desire of the contractor to participate in the development of emerging technologies, and more. This is the main reason why the cost of the technologies was left out of this study. For a contractor, the large-scale implementation of a new technology represents a significant investment in money and resources. This generally requires a detailed cost analysis to make sure that this investment will be profitable.
3.5.1. Performance index (P-index)
The seven (7) parameters presented are therefore intended to rank the performance (P-index) of the technologies. The classification of the technologies is mainly based on the literature benchmarks presented in this paper. Contractors will then be able to use this P-index to choose the collection technology that best meets their priorities. The following sections will detail the performance of the technologies presented in Table 1.
3.5.2. Collect Speed
Collect speed refers to how quickly technology can perform a complete takeoff. Because the bigger a site is, the longer a complete takeoff will take. This will therefore have a direct impact on the time required to make a complete takeoff. Especially since it would be inefficient to take more than a day to carry out a complete survey.
On the UWB and GPS side, once the sensor is installed, it is possible to obtain its position instantaneously. Whereas if you use a portable RFID reader, you must walk through the construction site to get the positioning.
| P-index* | Collect Speed | Equipment Portability | Quality and Precision | Worksite Impact | Post-processing Time | Information Access | Maturity |
|---|---|---|---|---|---|---|---|
| 1 | UWB | UWB | Laser scanner | GPS | UWB | Manual takeoff | Manual takeoff |
| 2 | GPS | GPS | LiDAR | RFID | RFID | Pictures & videos | Pictures & videos |
| 3 | RFID | RFID | RGB 3D | LiDAR | GPS | Laser scanner | GPS |
| 4 | LiDAR | Pictures & videos | Stereo camera | Manual takeoff | Manual takeoff | LiDAR | Laser scanner |
| 5 | Pictures & videos | RGB 3D | RGB-D 3D | Pictures & videos | LiDAR | RGB 3D | UWB |
| 6 | RGB-D 3D | Manual takeoff | Pictures & videos | RGB-D 3D | Stereo camera | RGB-D 3D | RGB 3D |
| 7 | Stereo camera | Stereo camera | UWB | Stereo camera | RGB-D 3D | Stereo camera | RGB-D 3D |
| 8 | RGB 3D | RGD-D 3D | Manual takeoff | RGB 3D | Laser scanner | GPS | LiDAR |
| 9 | Manual takeoff | LiDAR | GPS | UWB | RGB 3D | UWB | Stereo camera |
| 10 | Laser scanner | Laser scanner | RFID | Laser scanner | Pictures & videos | RFID | RFID |
The ability of LiDAR to do a 3D scan while on the go makes it interesting if you want to do a 3D scan. Compared to laser scans where the station must be repositioned, scanning an entire building is therefore a very time-consuming task. For photos and videos, and 3D reconstructions, these technologies require the entire site to be walked, so their collection times are similar.
3.5.3. Equipment Portability
To perform a takeoff, it may be necessary to walk a long distance with the device. Thus, the size and weight of the device used will impact the choice, since a lightweight and portable technology could be an asset by making it more pleasant to use.
Again, UWB and GPS are the most interesting on this point, since it is possible to obtain the positioning without walking on the construction site. For RFID, photos and 3D RGB reconstruction, it is possible to walk the construction site with a simple handheld device. Compared to stereo cameras, RGB-D 3D reconstructions and LiDAR need to be connected to a computer system to work properly. Finally, the laser scanner usually needs to be in a fixed location for a few seconds, usually on a tripod, to perform the scan.
3.5.4. Quality and Precision
Ultimately, the main objective is to carry out a quality takeoff that will be accurate, because this will have an impact on the quality of the update of the space planning schedule.
On this point, laser scans and LiDARs have a good advantage because they allow you to obtain a high-precision 3D scan, allowing you to obtain the position and the space occupied. The only point is that the LiDARs alone cannot collect the colour of the items. On the 3D reconstruction side, although it is possible to obtain a 3D rendering of the site to take measurements, a multitude of factors can influence the quality of the 3D reconstruction. But this is still an advantage to comparing taking photos and videos alone, which need to be analyzed in detail to extract more information. It is also possible to be precise with UWB, but several factors, such as the presence of metal elements, can interfere with this accuracy. GPS is in a similar situation where the buildings can block the signal. Finally, although there are solutions to obtain their positioning, RFID is not designed for this.
3.5.5. Worksite Impact
Maintaining a consistent flow of work on the job site is essential for the smooth running of the construction, especially if you want the takeoff to reflect that flow. It is therefore preferable, even essential, that the takeoff does not have a negative impact on the work in progress. Thus, it is good to mention that, for several technologies, it will be necessary to walk on the entire site to carry out a complete takeoff. In this context and depending on the nature of the work carried out, some parts of the site may not be available. This is therefore an advantage of using a GPS, since you can access their position without having to walk through the site. It is like RFID, which can be detected remotely. Although this is also the case for UWB, once the sensors are installed, multiple receivers must be installed on the construction site, and these receivers can interfere with the workflow.
3.5.6. Post-Processing Time
Regardless of the takeoff technology chosen, a period will be required to process the information collected so that it is available to the management team for the schedule update. A contractor will therefore have to devote the necessary resources to this processing, making these resources unavailable to perform other tasks, especially if it is labour. This means that a long post-survey processing time is required, such as the analysis of individual photos and videos, which could increase the cost of using the chosen technology. UWB, GPS and RFID still have the advantage because it is possible to obtain their position directly. Then, for LiDAR, stereo cameras and 3D RGB-D reconstruction, if they are well configured, it is possible to obtain real-time 3D reconstruction. This is not the case with 3D RGB reconstruction and laser scans, where the data must be processed after collection.
3.5.7. Information Access
It is crucial to ensure that the information collected remains accessible during and after the project. Additionally, since some technologies require specialized software to process and visualize this information, it is essential to ensure the long-term availability and compatibility of this software. This is why manual notes and photos have an advantage, as many computers, phones and tablets can view PDF documents, photos and videos. For 3D scans and reconstructions, the information is usually available in the form of a point cloud, and although their use is more specialized, applications are available to visualize point clouds. Finally, for GPS, UWB and RFID, it is generally necessary to use the tools provided by the developer of this technology to visualize the information collected.
3.5.8. Maturity
The goal of this research project is not to develop these survey technologies. On the contrary, one of the criteria is to ensure that the technology is available, applicable, reliable, accessible and requires a minimum of development. In this regard, the maturity acts as a reference point for the contractors to make a rough estimation of how work has to be done to implement the technology, thus impacting the overall implementation cost.
On this point, manual surveys and photos and videos have another advantage because anyone can use these technologies without requiring training. It is a bit the same thing for GPS, which is now installed by default in a variety of computer equipment. Although the use of laser scanners is now widespread in construction, it requires good training for the user. On the UWB side, although systems are available, proper use requires special attention to ensure that the sensors and stations are properly positioned, and to limit interference. Finally, the use of other technologies to collect positioning requires the user to have good computer knowledge.
3.6. Validation and Technology Selection
To demonstrate the different technology selections, two example cases are presented. The first is that of a small general contractor working in the residential sector, and another is that of a large general contractor that handles private and public contracts regularly exceeding $250 million. Each of them will have different priorities (Table 2) with respect to the criteria presented in section 9. Based on those priorities, each contractor can now look at the performance of each technology (Table 1) and make a short list of a few interesting technologies and further evaluate their implementation cost and effects in the management process of their construction projects.
On the side of small contractors, they mainly deal with small residential projects, single-family houses and small apartment blocks. Due to the small size of the projects, takeoffs are generally short to complete, and the time to perform a takeoff will not be a priority. In addition, since there is rarely more than one work team in each building under construction, there is less fear of impacting the work during takeoff. However, its resources are limited for procurement, training, and data processing. Thus, matu-rity, post-processing time and access to information would be the priority. Based on these priorities, if we look at the three (3) best-performing technologies for each of the criteria presented in Table 1, a combination of manual surveys and photos and videos would be a good solution.
For the large contractor, due to the size and duration of the project, he could decide to prioritize the impact on the work and the speed and quality of the survey, which would promote a smooth workflow. Since it has the necessary resources, maturity and post-processing time are less of a priority. So, still looking at the three (3) best-performing technologies in Table 1, LiDAR could prove to be a good solution. However, its inability to collect the colour of the elements could be a significant problem. RFID could be another solution, but since it is not designed to accurately collect the position of items, the quality of the reading may not be up to par.
It must be noted that even if LiDAR and RFID can be a good solution for a large contractor, they both have major drawbacks that could be a deal breaker for their adoption. So, looking a little further down in the performance, doing a 3D RGB-D reconstruction could be the solution. Although this technology is not the best for any of the criteria, it performs relatively well everywhere. Thus, with some development, the manager in charge of doing the survey could go around the site with a ToF camera and a computer and thus make a complete takeoff in a reasonable time. In addition, the quality would be sufficient to extract the positioning and occupancy of items on the site.
4. DISCUSSION
With the emergence of new spatiotemporal planning techniques, such as Chronographic Modelling and DMORS, which rely primarily on the positioning and occupancy of resources to build the project schedule, the process of updating this schedule requires the collection of actual spatiotemporal information as the work progresses. In this regard, information technologies can provide valuable support. But those information technologies are evolving very rapidly, and new innovative technologies are regularly being developed. For contractors, choosing the technology that best fits their needs can be a considerable challenge, especially when it comes to the potential impact on the smooth progress of construction work.
Based on a literature review of the most recent developments in the available technologies to determine the positioning of resources and work teams, this article proposes a novel framework to help contractors select the technology that best fits their needs. This paper analyzes several technologies that make it possible to collect the position and occupancy of work crews and resources on the site. First, a literature review of the most recent developments was carried out for each of the proposed technologies. Subsequently, seven (7) performance criteria reflecting the needs of contractors are used to evaluate the technologies.
| Priority No. | Small Contractor | Large Contractor |
|---|---|---|
| 1 | Maturity | Worksite impact |
| 2 | Post-processing time | Collect speed |
| 3 | Information access | Quality and precision |
| 4 | Quality and precision | Information access |
| 5 | Collect speed | Equipment portability |
| 6 | Worksite impact | Maturity |
| 7 | Equipment portability | Post-processing time |
Depending on the priorities and capabilities of each contractor, the most suitable survey technology may vary. Examples for small and large contractors are used to demonstrate the process of selecting the most suitable technology. For a small contractor, traditional techniques such as taking manual notes and photos and videos are still the best solution because their use is well known and generally well established in the contractor management process.
However, for a large contractor, the size of construction projects makes choosing technology more difficult. The sensors (section 3.4) have the advantage of being fast without the need to move around the entire site when you want to take a reading. However, their accuracy can vary greatly depending on the conditions on the site and it is not possible to directly determine the occupancy of the elements detected.
The 3D reconstruction (section 3.2), with RGB, RGB-D images and stereo cameras, performs relatively well. However, there is still development to be made to make them more accurate and effective. The increase in computing power makes it possible to use increasingly efficient algorithms. Therefore, there’s a good chance that these technologies will become more refined over the years.
On the 3D scanning side (section 3.3), laser scans and LiDAR allow you to make very precise readings, and it is on this point that they have an advantage over 3D reconstructions. Currently, LiDAR, with its speed and accuracy, seems to offer the best possibilities, but it cannot collect the colour of the elements, which laser scans can do. However, the fact that the laser scans must remain fixed during the scan can hinder the smooth running of the work.
If used individually, this study shows that for many technologies, although they can have a good P-index for some capabilities, they also have a very poor P-index for the other capabilities. If we take UWB for example, this technology has a good P-index for collection speed, equipment portability and post-processing time, but also a bad P-index for work-site impact and information access. A potential solution could be to use more than one technology together to mitigate their poor P-index.
CONCLUSION
This research provides a comprehensive framework for evaluating and selecting data acquisition technologies to support the implementation of spatial planning methodologies, such as Chronographic Modelling and DMORS, in construction project management. These methodologies require accurate, real-time data on the positioning and occupancy of work crews and resources, which presents significant challenges in dynamic and complex construction environments.
Through an extensive literature review, the study categorizes and assesses a wide range of technologies, including manual methods, image & video capture, 3D reconstruction, laser scanning, LiDAR, and sensor-based systems (GPS, UWB, RFID), against seven performance criteria: data collection speed, portability, accuracy, worksite impact, post-processing time, information accessibility, and technology maturity. This multi-criteria evaluation enables contractors to align technology choices with their operational scale, resource availability, and strategic priorities.
The findings reveal that while high-precision technologies like LiDAR and laser scanning offer superior spatial accuracy, they often come with trade-offs in terms of portability, cost, and worksite disruption. Conversely, traditional methods such as manual note-taking and photographic documentation remain highly accessible and mature, making them suitable for small-scale contractors with limited resources. Mid-range solutions like RGB-D and stereo camera-based 3D reconstruction offer a promising balance between accuracy and usability, particularly as computational capabilities and algorithmic efficiency continue to improve.
Importantly, the study highlights that no single technology excels across all performance dimensions. Therefore, a hybrid approach, integrating complementary technologies, may offer the most robust and scalable solution for real-time spatial data acquisition. For instance, combining LiDAR with RGB imaging can overcome the limitations of color capture, while integrating sensor-based tracking with 3D reconstruction can enhance both spatial accuracy and temporal resolution.
By offering a structured, criteria-based evaluation framework, this study contributes to bridging the gap between emerging technological capabilities and practical implementation in construction management, ultimately supporting more efficient, data-driven decision-making in the planning and execution of construction projects.
FUTURE RESEARCH
The performance of each of the technologies evaluated in this article varies greatly, and this presents a challenge when it comes to doing a takeoff on a large construction site using only one technology. One solution that is regularly proposed is to combine several technologies. The next step would be to study the effects and capabilities that could be achieved by pairing several technologies together. In addition, there is a moral dilemma in always tracking the movement of workers. It is therefore necessary to study the receptivity of workers and unions when work teams are constantly monitored when they arrive at a site.
AUTHORS’ CONTRIBUTIONS
The authors confirm their contribution to the paper as follows: A.F.: validation; S.M.P.: Manuscript draft;. All authors reviewed the results and approved the final version of the manuscript.
AVAILABILITY OF DATA AND MATERIALS
The data sets used and/or analysed during this study are available from the corresponding author [S.M.P] upon request.
ACKNOWLEDGEMENTS
Declared none.
DISCLOSURE
Part of this article has previously been published in the thesis Stéphane MORIN PÉPIN, “Développement d’une modélisation spatiotemporelle et d’artéfacts pour l’évaluation dynamique du taux d’occupation pour la planification des projets de construction de bâtiments” (2024). ÉCOLE DE TECHNOLOGIE SUPÉRIEURE UNIVERSITÉ DU QUÉBEC. https://espace.etsmtl.ca/id/ eprint/3572

