All published articles of this journal are available on ScienceDirect.

Temperature Development and Heat Control Analysis In Palu Bridge Pile Cap And Pillar
Authors Info & Affiliations
Abstract
Aim
The research aims to evaluate the efficiency of multi-stage pouring and internal cooling water circulation in mitigating thermal cracking in the Palu Bridge's pile cap and pillar. Using 3D finite element analysis (FEA), it assesses compliance with ACI 301 standards and provides practical guidance for optimizing mass concrete construction based on time and budget constraints.
Background
Mass concrete structures, like the pile cap and pillar of the Palu Bridge, face significant risks of thermal cracking due to the heat of cement hydration. Such thermal stress compromises structural integrity, necessitating effective temperature management strategies.
Objective
This study aims to analyze and compare the efficiency of two temperature control methods—multi-stage concrete pouring and internal cooling water circulation—in maintaining temperature levels within ACI 301 standards during the construction of the Palu Bridge pile cap and pillar.
Methods
A 3D finite element analysis (FEA) was conducted to simulate temperature profiles during concrete hydration. Simulations were validated using a small-scale physical model, and scenarios incorporating staged pouring and cooling pipes were evaluated for compliance with industry temperature thresholds.
Results
The staged pouring method resulted in a maximum core temperature of 68.81°C and a differential temperature of 20.93°C while cooling pipes reduced the maximum temperature to 58.69°C with a differential of 13.16°C. Both approaches kept temperature levels below ACI 301 standards, ensuring structural integrity. The physical model closely mirrored the FEA results, validating the methodology.
Conclusion
Both temperature control strategies effectively mitigate thermal cracking risks. Staged pouring is cost-efficient but time-intensive, whereas cooling pipes offer faster construction at a higher cost. The selection of methods should consider project budget and timeline constraints.
1. INTRODUCTION
Mass concrete is widely applied in constructing concrete pile caps and pillars on a long-span bridge with large pillar dimensions. According to ACI 207.1R-05, mass concrete is any volume of concrete with dimensions sufficiently large to necessitate implementing measures to manage heat generation from cement hydration and the resulting volume change to minimize cracking [1]. In general, structural members with a minimum dimension larger than 1.22 m (4 ft.) are classified in this category.
The substantial degree of cement hydration during the hardening process of mass concrete could lead to the formation of cracks. The presence of an initial crack on the bridge pillar might reduce the structural integrity and durability of the bridge, thereby compromising its safety. High mass concrete temperature might induce thermal stress within the structure. Also, an excessive cooling rate might lead to shrinkage cracks in the concrete. Furthermore, the limited thermal conductivity of concrete leads to a rapid increase in the core temperature. This process could lead to substantial temperature differences between the core and surface of the concrete, leading to the development of significant thermal stress [2-6]. Subjecting concrete to thermal stress above its tensile strength greatly enhances the probability of cracking, especially in the early stages. Hence, it is crucial to thoroughly account for temperature development while designing mass concrete components, which can be assessed using simulations, calculations, and other methodologies [7-10].
Various preventive measures are implemented to mitigate the possibility of cracking. These include substituting cement portions with supplementary cementitious materials (e.g., fly ash, slag cement, and silica fume), aggregates and water cooling before concrete mixing, employing icy water or liquid nitrogen, cooling pipes, and insulation blankets. Several studies have demonstrated that substituting cement components with supplementary cementitious materials can significantly mitigate the heat of hydration [11-15]. Due to the slower reactivity of most supplemental cementitious materials than the clinker phase, their addition can effectively decrease the heat released during cement hydration. However, depending on the thickness of the concrete and the weather, it may be necessary to install cooling pipelines or insulation blankets to regulate the temperature even when using low-heat concrete mixes. Furthermore, several methods have proved effective, including aggregates and water cooling before the pouring, reducing the temperature of the concrete with ice water, and employing insulation coverings to cover the structure from direct sunlight and slow its cooling rate [16-18].
Hui et al. [19] examined the temperature disparity between the inside and exterior concrete of the primary tower cap of the No. 3 Jinsha River Bridge. Numerical simulations are essential to ensure quality and prevent temperature stress in mass concrete structures. Key measures include optimizing the mix ratio, cooling the concrete before pouring, using a water cycling system, and applying proper insulation. These steps help control and prevent temperature-related cracks.
Li et al. [3] conducted a study on constructing a large-scale concrete tunnel in Shantou City, China. An initial theoretical analysis was conducted to assess the components' thermal performance and evaluate the cracking risk. Additionally, the impact of cooling water pipes was assessed. Subsequently, the temperature progression of each element was consistently observed throughout the concrete curing process, and two strategies for preventing cracks (gradient concrete and plastic anti-crack grid) were suggested. The gradient concrete method demonstrated higher efficacy in crack management than the plastic anti-crack grid method while effectively reducing the component's temperature.
Sun et al. [20] investigated temperature control during the Wentang Bridge pier pile cap construction under winter conditions using finite element analysis with MIDAS FEA software. Initially, a three-dimensional finite element model is created to represent the temperature distribution caused by hydration heat. Subsequently, the temperature changes in the hydration heat temperature field of Wentang Bridge are determined using experimental measurements. The research findings demonstrate that the calculation model can accurately simulate the concrete hydration process. Additional research indicates that finite element analysis may precisely replicate the concrete hydration process. Tahersima and Tiklasky [21] experimented by comparing thermocouple measurements at the construction site with the findings obtained from a commonly used commercial finite element model. Xie and Yang [22] employed a differential and analog evolution algorithm to address the adiabatic temperature coefficient and cooling water's impact. The authors undertook secondary development based on the ABAQUS software platform, involving stress field computation, back analysis calculations, and cooling pipe processing.
In modeling the temperature of mass concrete, 3D Finite Element Analysis (FEA) analysis is essential for accurately predicting thermal behavior and addressing the challenges associated with heat generation and dissipation. FEA modeling captures the complexities of heat conduction within the concrete, the effects of boundary conditions like ambient temperature and insulation, and variations in material properties.
This paper innovatively applies FEA simulation to analyze temperature control in the Palu Bridge’s pile cap and pillar, providing localized insights into thermal challenges in mass concrete. Comparing two temperature control methods—staged pouring and internal water-cooling—offers practical guidance on choosing techniques based on budget and time constraints. The study accurately predicts thermal behavior using detailed transient 3D conduction modeling, aiding in proactive construction planning to reduce thermal stress and cracking risks. Validated against ACI 301 standards, the findings provide reliable, widely applicable methods. Additionally, the tailored use of MIDAS FEA software for soil-concrete interaction and cooling pipe modeling highlights advanced simulation capabilities.
2. MATERIALS AND METHODS
2.1. Project Overview
The Palu IV Bridge Ponulele (Palu Bridge), located in the Central Sulawesi Province of Indonesia, was significantly damaged by the earthquake and tsunami. The Palu Bridge rehabilitation program was launched to restore the city of Palu's accessibility and mobility, which was impacted by the earthquake on September 28, 2018. The new bridge was constructed using the balanced cantilever structure, which involved bridge pillars and pile cap structures. These components were built as mass concrete structures. Fig. (1) describes the dimensions of the pile cap and pillar. The concrete grade was fc'35 MPa; the pile cap size was 17m × 17m × 4m, with the concrete volume reaching 1156 m3. The pillar had the same concrete strength as the pile cap; it was 11 m in height and 11.90 m in width and had a hollow section in its core.
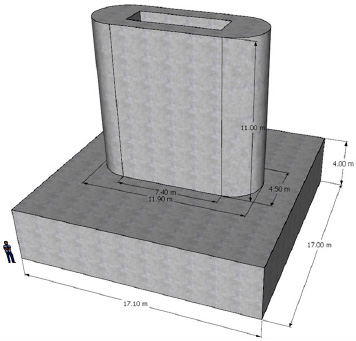
Pile cap and pillar dimensions.
2.2. Temperature Control Scenario
Managing thermal behavior in mass concrete is essential for structural integrity, especially in large structures like bridge pillars and pile caps. Mass concrete creates temperature gradients between the core and surface, which can lead to cracking and weakened structural integrity if the gradient is too high. Research (e.g., by Wang et al. [2] and Hui et al. [19]) shows that cracking is likely when thermal stress exceeds the concrete’s tensile strength. Temperature control strategies such as pre-cooling, staged pouring, and cooling pipes are implemented to manage risks effectively. Pre-cooling involves lowering the initial temperature using cold water or ice. Staged pouring, which is utilized in this case, helps limit temperature rises by alternating layers of poured material with cooling periods in between. Cooling pipes offer a quicker and more direct solution by circulating cool water, allowing for a single-stage pour while effectively managing the core temperature. Studies by Lu et al. [11], Sun et al. [20], and Xie et al. [10] support these methods' effectiveness in reducing temperature differentials. Finite Element Analysis (FEA) is crucial for accurate temperature modeling in mass concrete. This study used MIDAS FEA software (MIDAS) to simulate temperature profiles for staged pouring and cooling pipe scenarios, considering factors like ambient conditions and concrete properties. The simulations provided valuable insights and confirmed compliance with ACI standards, including a maximum core temperature of 71°C and a differential limit of 21°C. Both scenarios met these thresholds, demonstrating the effectiveness of temperature control strategies in maintaining concrete integrity.
2.3. Concrete Mix Design
The raw materials and mixing ratio of fc'35 MPa concrete for the pile cap and Pillar of Palu Bridge are shown in Table 3. The cement used in this mix design is Portland Composite Cement (PCC) type. PCC is formed by grinding Portland cement slag and gypsum with one or more inorganic ingredients. The inorganic components include blast furnace slag, pozzolan, silicate compounds, and limestone. These minerals collectively comprise 6% to 35% of the mass of PCC [23]. Generally, PCC generates relatively low to moderate heat during hydration and is strongly resistant to sulfate attacks. A superplasticizer and water-reducing agent were used to increase the concrete's workability.
| Item | Value |
|---|---|
| Concrete strength | fc' 35 MPa |
| Cement type | PCC* |
| Target slump | 8 – 12 cm |
| Maximum aggregate size (fine) | 9.5 mm |
| Maximum aggregate size (coarse) | 20 mm |
| Free water/cement ratio | 0.247 |
| Consumption for concrete per m3 | |
| Water | 120 kg |
| Cement | 485 kg |
| Fine aggregate | 640 kg |
| Coarse aggregate | 1020 kg |
| Admixture (superplasticizer and water reducer) | 1.5 l |
2.4. Calculation Parameters and Model in Scenario 1
This section will examine the heat generated during the hydration process in concrete, explicitly focusing on the construction phase of the pile cap and pillar structure. The MIDAS will be used to simulate the heat of hydration using the transient heat hydration method (Fig. 2a). In addition, hexahedral meshing models were employed to combine elements with a maximum size of 250 mm x 250 mm (Fig. 2b). The bottom side is a meshing model representing soil material and acts as a heat absorber through hydration caused by the mass concrete. The simulation of this mass concrete is carried out in multiple stages. The pile cap concrete is poured in four stages, while the pillar is poured in eight stages. Each layer of the pile cap has a thickness of 1 meter, with a three-day interval between castings. Whereas the pillar casting occurs in 1.5-meter-thick layers, also with a three-day interval between each session. The pile cap and concrete pillars are treated as a single continuous structure. Several measures have been implemented to ensure the integrity between the pile cap and pillars, including roughening the surface, applying a bonding agent, and installing shear connectors.
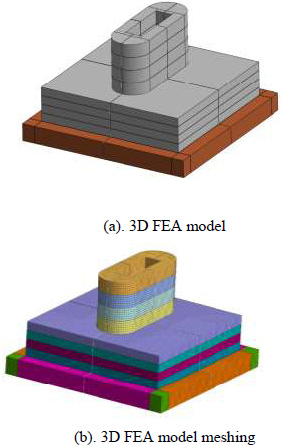
3D FEA model, (b). 3D FEA model meshing.
Table 2 displays the thermal and mechanical parameters of concrete for the pile cap and pillar. The standard value for the Portland cement concrete mix ratio is determined based on the mechanical parameters of concrete. The specific heat, convention coefficient, coefficient of thermal expansion, and maximum heat of cement hydration were studied [24]. The ambient temperature was chosen based on the concrete and casting temperatures. The initial selected ambient temperature was calculated to be 27°C. The temperature of the concrete entering the mold was temporarily established at 27°C for this calculation. Temperature control in pile cap and pillar construction was determined based on the actual casting temperature of concrete. Adiabatic behavior in concrete could be defined using the “Function” menu in MIDAS. The function determine the highest temperature of the concrete mixture based on the 2012 JSCE standard [25]. This study utilizes standard plastic constitutive equations, effectively determining stress increments through the elastic component of strain increments. When materials are subjected to temperature changes, they experience thermal expansion or contraction, which can induce stress. If these stresses exceed the material's yield strength, plastic deformation occurs, and constitutive equations are used to model the transition from elastic to plastic behavior. This is particularly important in coupled thermo-mechanical analyses, where thermal gradients and mechanical forces interact.
| Parameters | Concrete | Soil |
|---|---|---|
| Coefficient of thermal conductivity, (W/(m.°C)) | 2.67 | 1.98 |
| Specific heat (kJ/kg.°C) | 0.95 | 0.85 |
| Density (kg/m3) | 2,400 | 1,800 |
| Convection coefficient (W/m2 .°C) | 12 | 13.5 |
| Elastic modulus (MPa) | 29,725.41 | 18,000 |
| Coefficient of thermal expansion (1/°C) | 1x10 -5 | 1x10 -5 |
| Poisson's ratio | 0.15 | 0.25 |
| Max. heat of cement hydration, 28 days (J/g) | 305 | - |
| Concrete compressive strength, 28 days, (MPa) | 35 | - |
After modeling and defining the material properties, a temperature load is applied to the model. This load includes the prescribed temperature, the heat source, and convection. The prescribed temperature represents the constant and uniform temperature of the exposed soil model. The heat source reflects the hydration heat generated from the concrete core based on the initial temperature outlined in the plan. Convection refers to the external air temperature, which helps dissipate the hydration heat from the concrete core.
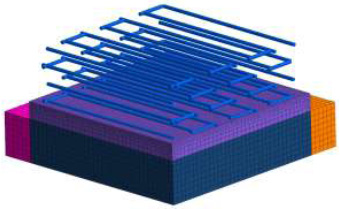
3D finite element model of pipe cooling in pile cap.
2.5. Calculation Parameters and Model in Scenario 2
In the second scenario, concrete is cast in a single stage, requiring pipe cooling to manage excess heat in the pile cap. Due to high installation costs and time, the pipe cooling system is implemented only in the larger pile cap, which is 4 meters thick and features four layers of cooling pipes spaced 0.8 meters apart (Fig. 3).
The water in the cooling pipe shall be regarded as cooled water; its temperature shall not exceed 15°C; during the heating phase, the flow shall be 600 m3/hr. To meet these requirements, the inlet flow rate and temperature must be modified during the temperature control process. The physical parameter of the concrete used is the same as in scenario 1 (Table 2), while the pipe cooling specifications are explained in Table 3.
3. RESULTS AND DISCUSSION
3.1. Stage Construction Scenario 1
The analysis results will display the heat development obtained in the pile cap and pillar elements. These results are displayed as heat contours from simulating each pouring stage. Therefore, the heat hydration output can be received at each construction stage. The heat development at the 1st—5th pouring stage is shown in Figs. (4-8), respectively.
| No. | Parameters | Specification |
|---|---|---|
| 1 | Pipe Diameter | 0.05 m |
| 2 | Coefficient | 1,338,120 J/(m2 hr [°C]) |
| 3 | Specific Heat | 4,186 J/(kg [°C]) |
| 4 | Mass Density | 1,000 kg/m3 |
| 5 | Flow Rate | 600 m3/hr |
| 6 | Inlet Temperature | 15 °C |
| 7 | Number of Layers | 4 |
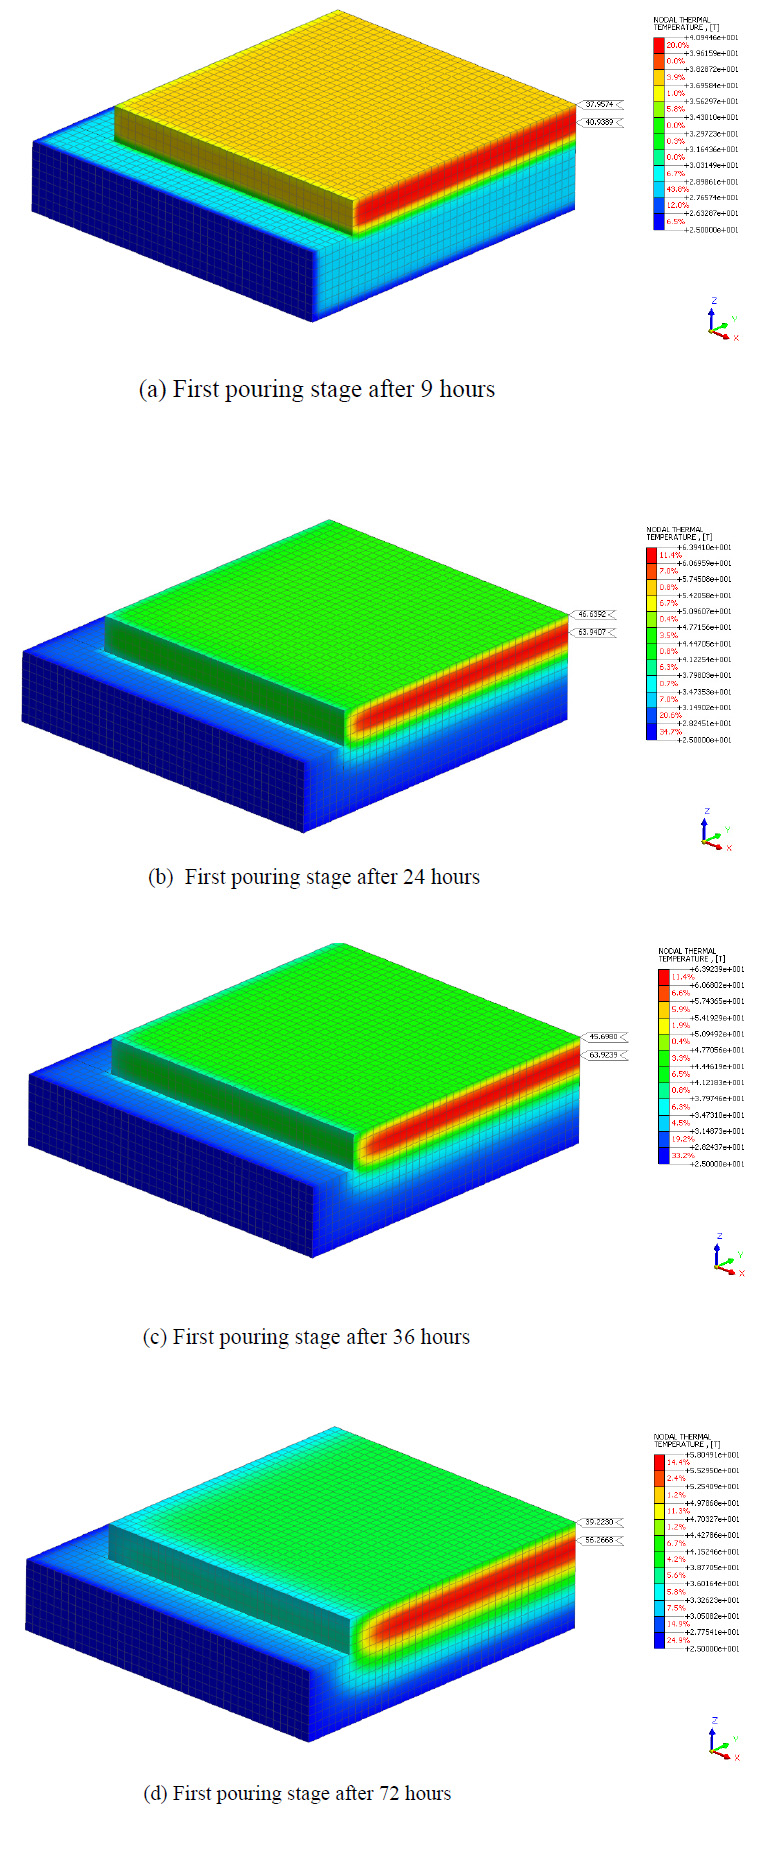
The heat development of the first pouring stage in the pile cap.
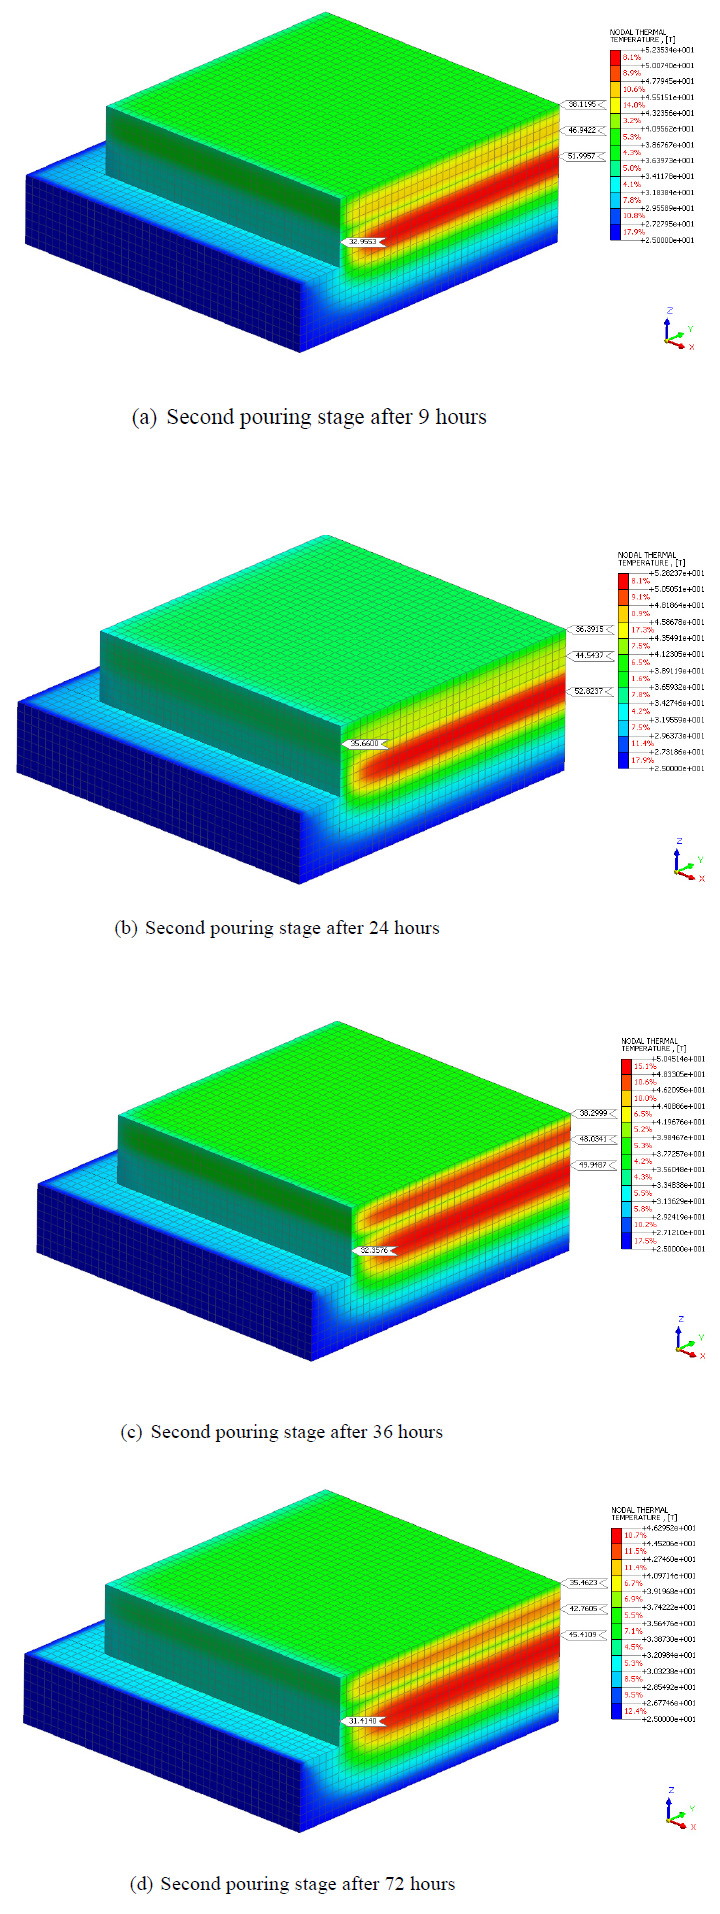
The heat development of the second pouring stage in the pile cap.
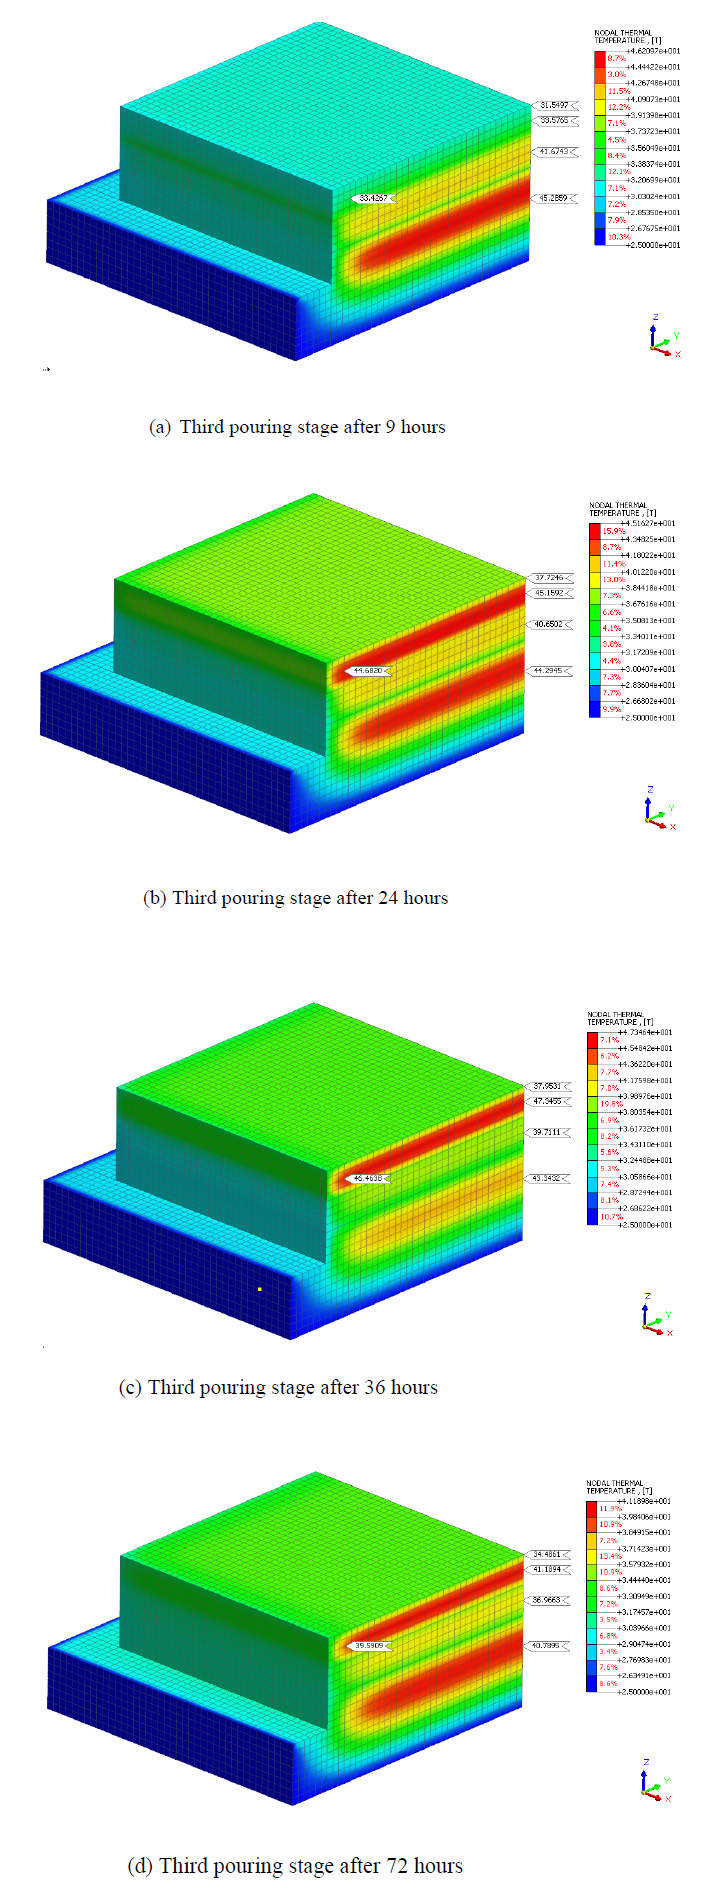
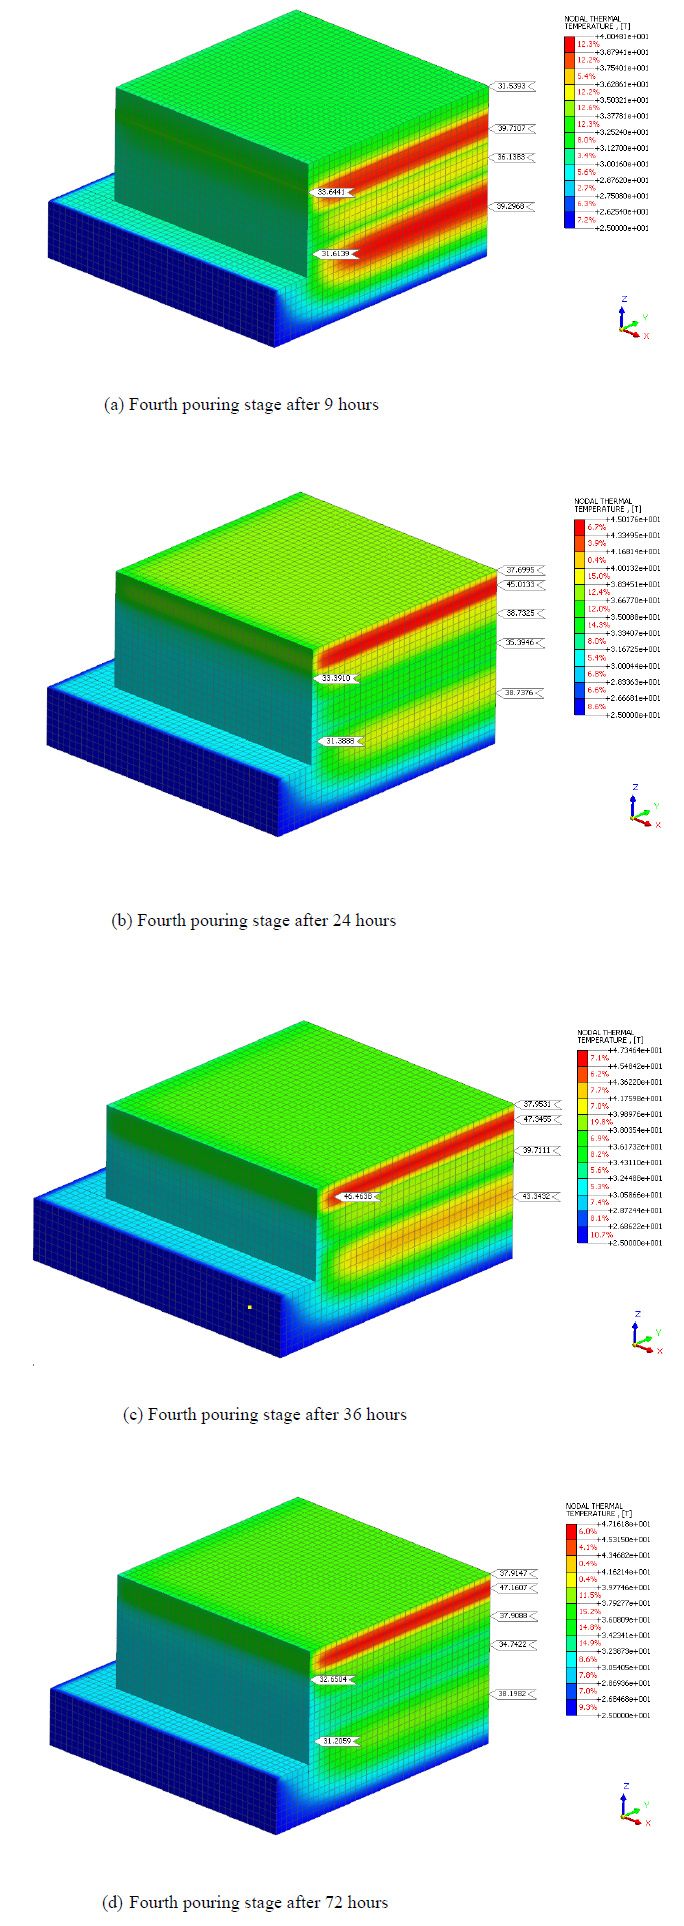
Figs. (4-8) show that the maximum temperature occurs 72 hours after concrete pouring for the first pouring stage, whereas the second to fifth stage occurs at 36 hours. The longer time in the first pouring stage occurs because the bottom part of the concrete is laid on the soil while others stage on the concrete; the coefficient of thermal conductivity for soil is lower than concrete. Thus, it takes a longer time to absorb the heat. For example, at the first pouring stage, after 9 hours, the concrete shows a temperature of 37.9 °C at the top side and 40.9 °C at the core. Thus, after 72 hours, the concrete temperature rose to 49.2 °C at the top side and 66.9 °C at the core (Fig. 4); furthermore, after 88 hours (Fig. 5a), the concrete temperature at the core decreased to 51.9 °C. Therefore, the following pouring stage should be conducted after 72 hours, when the concrete reaches its peaks and starts declining afterward.
Figs. (4-8) show that the concrete core temperature from the first pouring cooled longer than other stages. It takes 240 hours from the peak temperature of 66.9 °C to cool down to the normal concrete temperature of 31–35 °C, whereas the second to fifth pouring stage takes less time than other stages. The longer time in the first pouring stage occurs because it keeps receiving thermal heat from the layers above during the pouring sequence. Therefore, the heat at its core could not be released in the free air.
The temperature of the concrete will be checked at each simulated pouring stage. The maximum temperature taken is divided into three specific locations: inside the concrete core, the top surface, and the side surface of the concrete. The temperature development of each pouring stage is shown in Table 4. Stages 1–4 were shown as the pouring stage for the pile cap, whereas stages 5 were for the pillars. The differential temperatures were taken from adjacent layers' highest and lowest temperatures.
| Stage | Maximum Temperature (°C) |
Differential Temperature (°C) |
||
|---|---|---|---|---|
| Side | Top | Core | ||
| 1 | 47.06 | 45.48 | 66.98 | 19.92 |
| 2 | 47.79 | 47.07 | 68.03 | 20.24 |
| 3 | 47.77 | 47.03 | 67.73 | 19.97 |
| 4 | 47.76 | 46.03 | 67.69 | 19.92 |
| 5 | 47.34 | 48.09 | 68.27 | 20.93 |
| 6 | 47.34 | 48.09 | 68.27 | 20.93 |
| 7 | 48.10 | 47.34 | 68.81 | 20.71 |
| 8 | 48.09 | 47.26 | 68.54 | 20.45 |
The heat development of the second pouring stage in the pile cap.
The heat development of the second pouring stage in the pile cap.
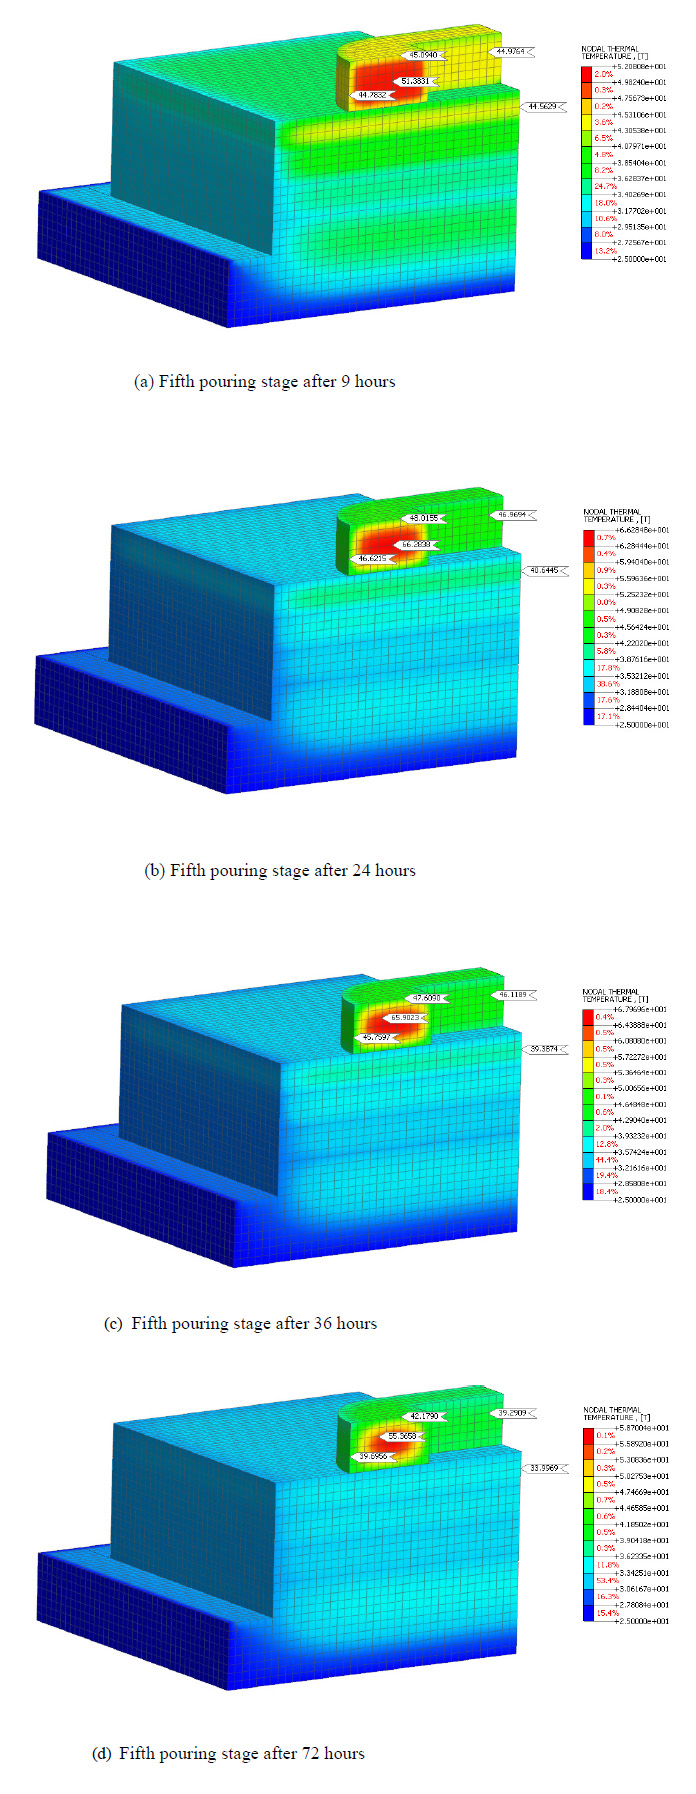
The heat development of the fifth pouring stage in the pillar.
After recapitulating the maximum temperature in the pile cap and pillar in Table 4, we obtained a maximum temperature value of 68.81°C, which does not exceed the requirement of 71°C [1]. Moreover, the highest differential temperature is 20.93°C, which does not exceed the requirement of 21°C [1]. Therefore, the staging strategy in the first scenario succeeded in keeping the heat of hydration during concrete hardening below the heat limitation set by ACI 301.
The additional cost of implementing Scenario 1 arises from applying a bonding agent to the hardened concrete surface before the next concrete pour. This ensures proper integration between the old and new concrete. The unit cost of epoxy-based bonding agent application is $25 per m2. For a pile cap surface of 289 m2, with four stages of application, the total cost is $28,900.
Scenario 1, which employs staged pouring for temperature control, is a cost-effective method compared to alternatives like cooling pipe systems. This approach avoids the need for specialized equipment or materials, relying instead on careful scheduling and standard materials, making it suitable for budget-constrained projects. However, the method is time-intensive, requiring waiting periods between pours (e.g., 72 hours) to allow sufficient cooling of previous layers, which can prolong the construction timeline. It is particularly applicable in projects where extended timelines are acceptable and ambient conditions favor gradual cooling. Despite its cost benefits, the method has limitations, including the risk of thermal accumulation in base layers, complex scheduling requirements, and dependence on environmental factors such as temperature and wind. These factors may restrict its effectiveness in projects with tight deadlines or regions with high ambient temperatures that hinder efficient cooling. Overall, Scenario 1 offers a low-cost solution for managing thermal stress but is best suited for projects with flexible schedules and favorable external conditions.
3.2. Construction Stage Scenario 2
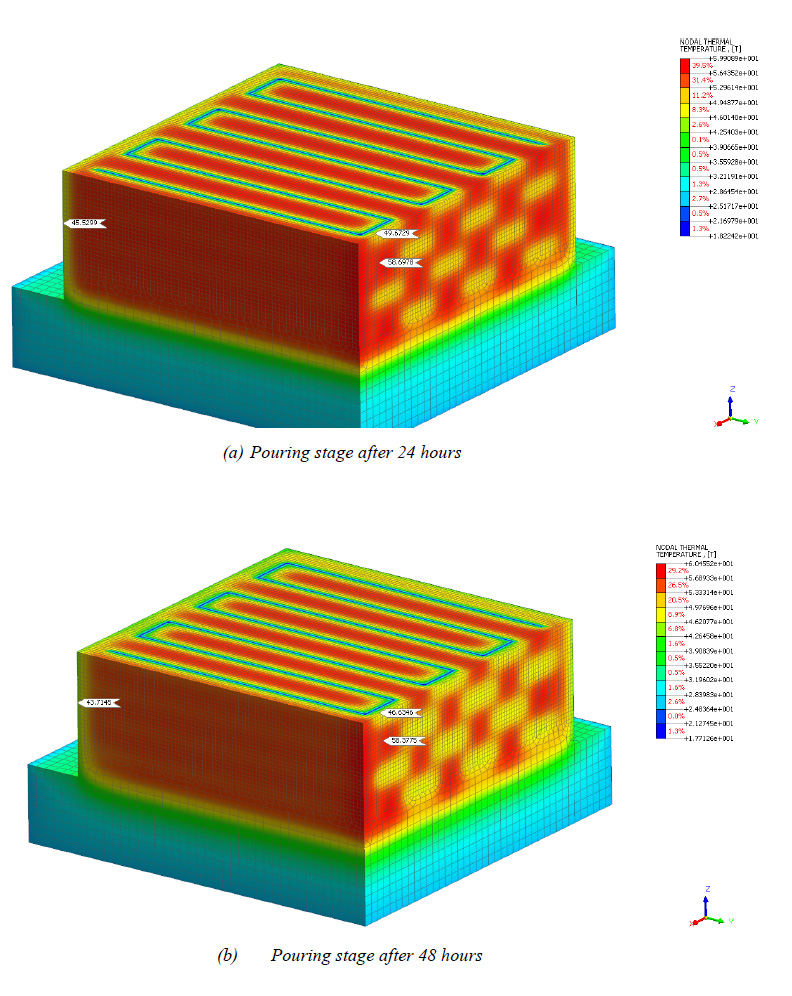
Scenario 2 was employed to accelerate the concrete casting process for the pile cap. This scenario introduces two primary changes compared to Scenario 1: adding a cooling pipe and modifying the casting process from four stages to a single stage. In scenario 2, the pile cap is cast in a single continuous operation to a height of four meters. This approach is expected to reduce the overall casting time.
Fig. (9) displays the temperature development of pile cap concrete pouring within 24 and 48 hours. The temperature development shows constant values at 24 and 48 hours because the casting stages were conducted in one stage. Moreover, the cooling pipe was installed inside the concrete, where the heat was absorbed by pumping the water inside the pipe at a constant rate. The maximum temperature at 48 hours is shown in Table 5. The maximum temperature value was obtained at 58.69°C, which does not exceed the requirements of 71°C [1]. At the maximum differential temperature, the value obtained is 13.16°C, which does not exceed the requirement of 21°C [1]. Therefore, the pipe cooling strategy in the second scenario succeeded in keeping the heat of hydration during concrete hardening below the heat limitation set by ACI 301.
The stage construction in pile cap and pillar.
| Temperature (°C) | Max. Temp. (°C) |
Differential Temperature (°C) |
||
|---|---|---|---|---|
| Side | Top | Core | ||
| 45.53 | 49.67 | 58.69 | 58.69 | 13.16 |
The additional cost of implementing Scenario 2 is due to the application of a concrete cooling pipe system, which consists of steel pipes, a pump, and concrete grouting poured into the pipes after the process is complete. The 4-layer steel pipes have a total length of 544 m, with a unit cost of $30 per meter for the installation and materials of 2” SCH 40 steel pipes, resulting in a total piping cost of $16,320. The pump rental for 2 days is $1,500. The grouting required to fill the pipes amounts to 1.5 m3, with a unit cost of $250 per m3, resulting in a total grouting cost of $375. This brings the additional cost for scenario 2 to $18,195.
Scenario 2, utilizing cooling pipes, effectively controls heat in mass concrete structures, enabling faster single-stage casting and making it ideal for large, time-sensitive projects. It suits environments with extreme temperatures but requires skilled personnel, reliable energy, and significant upfront costs. While efficient, its higher expense and complexity may limit use in budget-constrained or smaller projects.
3.3. Concrete Physical Modeling
A small-scale physical model was constructed for this study to validate the FEA results. The physical model consisted of a concrete block measuring 1,5 meters in width, 1,5 meters in length, and 1,5 meters in height (Fig. 10). The concrete mix design followed the specifications in Table 1. Thermocouples were installed at 10 cm from the surface (top position) and 50 cm from the surface (core position). As shown in Fig. (10)., the platform height was set to 1.5 meters to accommodate the pouring stage in scenario 1, with concrete poured in 1-meter stages.
Temperature readings were recorded every 12 hours at both the top and core positions, and the results are presented in Table 6. The peak temperature observed in the physical model was 66.7°C, with a differential temperature of 16.5°C. These values are slightly lower than those obtained from the FEA, which showed a maximum temperature of 68.81°C and a differential temperature of 20.93°C. The slight differences can be attributed to the continuous pouring assumed in the FEA simulation, where the heat generated from the previous stage is cumulatively added to subsequent pours, leading to slightly higher predicted temperatures.
Although no large-scale physical prototype was constructed for this study, the methodology aligns with proven approaches validated in prior research, specifically studies by Lu et al. [11] and Sun et al. [20], which used thermocouples and field measurements during construction, supporting the use of FEA for accurate thermal predictions. Similarly, Tahersima and Tikalsky [21] demonstrated strong correlations between FEA results and onsite temperature readings, confirming the reliability of the numerical method.
Table 6.
| Time (hour) | Maximum temperature (°C) | Differential | |
|---|---|---|---|
| Top | Core | Temperature (°C) | |
| 0 | 28,4 | 28,9 | 0,5 |
| 12 | 49,8 | 59,2 | 9,4 |
| 24 | 50,2 | 66,7 | 16,5 |
| 36 | 47,2 | 56,3 | 9,1 |
| 48 | 43,5 | 50 | 6,5 |
| 60 | 37 | 42,2 | 5,2 |
| 72 | 35,4 | 40 | 4,6 |
| 84 | 31,7 | 35,5 | 3,8 |
| 96 | 32,3 | 34,6 | 2,3 |
| 108 | 27,3 | 29,6 | 2,3 |
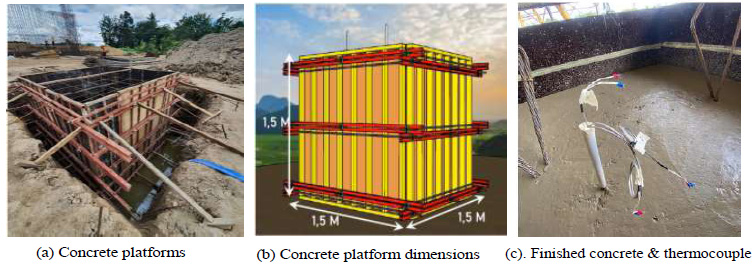
Concrete physical modeling.
CONCLUSION
This paper focuses on the Palu Bridge's main pillar and pile cap. It investigates two temperature control strategies to determine alternative methods for controlling temperature and preventing temperature cracks. The main conclusions drawn from this study are as follows:
- The 3D FE could provide fast and reliable calculation tools for modeling the heat development of concrete pile caps and pillars. It could show the temperature development at every hour. Moreover, it could accurately model two concrete pouring methods: pouring staging and pipe cooling.
- The FEA results closely matched those obtained from the physical model, which recorded a peak temperature of 66.7°C and a differential temperature of 16.5°C. This validates the FEA model's ability to predict thermal behavior in mass concrete accurately.
- This paper presents two alternative scenarios that could be used as a temperature control strategy in casting the concrete. The first scenario using concrete staging could provide cheap methods but takes longer, as the concrete casting of each layer must be conducted 72 hours after the previous layer. The second scenario provides faster time as the casting could be performed in one stage; thus, it requires more complicated and expensive methods.
- The scenarios presented in this paper succeeded in keeping the heat of hydration during concrete hardening below the heat limitation set by ACI 301. The method selection will depend on each project phase's construction time and budget limitations.
- This study demonstrates the effectiveness of staged pouring and cooling pipes in mitigating thermal cracking in mass concrete, validated through accurate 3D Finite Element Analysis (FEA) models. Future work could enhance these methods by incorporating real-time data and advanced technologies, such as machine learning and embedded sensors, for dynamic temperature management. Additionally, exploring sustainable solutions like eco-friendly cooling techniques, low-carbon cement, and innovative materials like phase-change systems could further optimize performance while reducing environmental impact. These advancements would improve construction efficiency and contribute to sustainable and resilient infrastructure development.
AUTHORS’ CONTRIBUTION
It is hereby acknowledged that all authors have accepted responsibility for the manuscript's content and consented to its submission. They have meticulously reviewed all results and unanimously approved the final version of the manuscript.
LIST OF ABBREVIATIONS
| FEA | = 3D Finite Element Analysis |
| MIDAS | = MIDAS FEA Software |
| PCC | = Portland Composite Cement |
AVAILABILITY OF DATA AND MATERIALS
The data sets used and/or analysed during this study are available from the corresponding author [C.B] upon request.
ACKNOWLEDGEMENTS
Declared none.

