All published articles of this journal are available on ScienceDirect.

Strength of Concrete Slabs Reinforced with Carbon Fiber Reinforced Polymer under Torsion
Abstract
Introduction
Concrete slabs are critical components in structural applications but are inherently limited by their brittleness and low tensile capacity, which can lead to failure under torsional loads. Traditional steel reinforcement provides some resistance but introduces issues, such as increased weight and susceptibility to corrosion. Carbon Fiber-reinforced Polymer (CFRP) materials present a promising alternative due to their high tensile strength, nonmagnetic properties, and resistance to corrosion.
Methods
This research employed finite element analysis (FEA) through ABAQUS software to investigate the torsional performance of concrete slabs reinforced with CFRP. A total of 24 square slabs were modeled, comprising 21 CFRP-reinforced slabs and 3 steel-reinforced slabs. The analysis focused on the effects of varying CFRP bar sizes (8 mm, 10 mm, and 12 mm) and compressive strength of concrete (21 MPa to 50 MPa) on the torsional behavior of the slabs.
Results
The results revealed that increasing CFRP bar size and concrete compressive strength significantly enhanced torsional cracking and ultimate moments. The largest increases in torsional cracking and ultimate moments were 4% and 21%, respectively, when the bar size was increased from 8 mm to 12 mm. Similarly, the highest increases in these moments were 53% and 42%, respectively, when the compressive strength increased from 21 MPa to 50 MPa.
Conclusion
These insights are crucial for optimizing the design of CFRP-reinforced slabs in torsional applications.
1. INTRODUCTION
Concrete slabs are essential components in many structural applications. However, their inherent brittleness and limited tensile capacity can be detrimental when subjected to torsional loads, which induce twisting and cracking. Traditional steel reinforcement offers some resistance, but it adds weight and can be susceptible to corrosion. Fiber Reinforced Polymer (FRP) materials have gained attention as viable alternatives for producing bars of reinforcement in concrete structures. Their nonmagnetic and noncorrosive properties eliminate concerns related to electromagnetic interference and corrosion when used as reinforcement.
Furthermore, FRP materials possess advantageous characteristics, such as high tensile strength, that make them ideal for structural reinforcement applications [1]. A key focus in structural analysis is understanding the torsional behavior of concrete slabs reinforced with FRP. This is a critical loading condition commonly encountered in structures like bridges and buildings. The shift from conventional analysis techniques to Finite Element Analysis (FEA) has significantly advanced the design of two-way concrete members, particularly between 1995 and 2015 [2]. Notable analytical approaches, including those introduced by Marti and Kong [3], emphasize the significance of evaluating the pre-cracking and post-cracking phases in assessing torsional stiffness. Studies by May et al [4] and Lopes et al [5] have further enriched our understanding by investigating the response of slabs to twisting moments through experimental and analytical approaches. EL-Gamal [6] conducted an FEA study on FRP-reinforced concrete bridge deck slabs, analyzing their performance under varying load conditions and revealing the significant influence of compressive strength of concrete, span-to-depth ratio, and slab thickness on slab behavior. Hamdy and Brahim [7] explored the torsional strength and behavior of concrete beams reinforced with stirrups and glass fiber-reinforced polymer (GFRP) bars. Their findings demonstrated that beams reinforced with GFRP exhibited similar strength and cracking behavior to steel-reinforced beams but had reduced post-peak torsional stiffness. Ibraheem and Mukhlif [8] assessed nine reinforced concrete slabs under pure torsion, highlighting the critical impacts of slab widths and steel reinforcement ratios on slab stiffness, strength, and ductility. Noha et al [9] investigated ten beams with self-compacting reinforced concrete (SCRC), strengthened with externally bonded GFRP strips under pure torsion. Their results showed that beams strengthened along their entire length with three layers of GFRP sheets achieved the highest increase in ultimate torsional moment of 33.3% more than unstrengthened beams. Moreover, beams with four layers of GFRP sheets spaced at 300 mm demonstrated the greatest improvement in energy dissipation. While this study focuses on the torsional behavior of FRP-reinforced concrete slabs, research in related fields highlights the effectiveness of fiber and recycled materials in enhancing structural performance. Studies on asphalt pavements have shown improvements in durability and cracking resistance with fiber reinforcement [10-12]. These insights indirectly support the potential of fiber-reinforced materials in structural applications.
Despite the growing adoption of FRP materials in structural applications, the torsional behavior of FRP-reinforced slabs remains largely unexplored. This study addresses this gap by employing finite element analysis to investigate the torsional behavior of concrete slabs reinforced with carbon fiber reinforced polymer (CFRP). The research focuses on two critical variables: the size of CFRP bars and the compressive strength of concrete. The findings aim to provide valuable insights into the structural performance of FRP-reinforced slabs, paving the way for future studies and practical applications in torsion-critical scenarios.
2. RESEARCH METHODOLOGY
This study investigated the torsional performance of concrete slabs with CFRP reinforcement through numerical analysis using ABAQUS software. The study adopted a nonlinear finite element analysis approach, employing 3D solid elements to thoroughly evaluate the strength and behavior of CFRP-reinforced concrete slabs under torsional loading. The methodology included developing the numerical model, defining material properties, applying loads, performing nonlinear analysis, and subsequently evaluating and interpreting the results. Furthermore, this systematic approach provides a robust framework for gaining an in-depth understanding of the strength and behavior of concrete slabs with CFRP reinforcement under torsion.
3. SPECIMENS AND VARIABLES OF THE STUDY
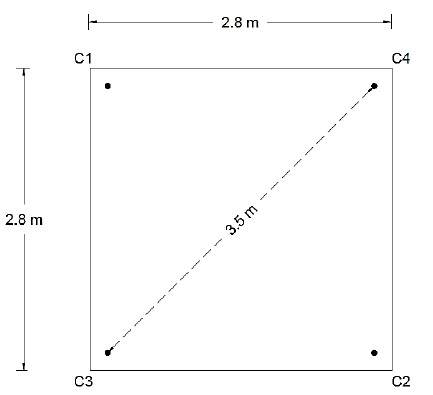
The research involved performing the analysis on twenty-four square concrete slabs with dimensions of 2.8x2.8x0.15 m, chosen to match the dimensions of slabs from previous experimental studies for comparison. Among these, twenty-one slabs were reinforced using two meshes of FRP bars, while the remaining three slabs were reinforced with two meshes of steel bars. The reinforcement meshes were situated at the bottom and top surfaces of the specimens, with a spacing of 100 mm between the bars. The variables under investigation included the compressive strength of concrete and FRP bar size. Specifically, the study comprised seven groups of slabs reinforced with FRP bars, each with varying compressive strength of concert, ranging from 21 MPa to 50 MPa. Within each group, three different FRP bar sizes (8 mm, 10 mm, and 12 mm) were utilized. Additionally, an eighth group consisting of slabs reinforced with steel bars was included for comparison purposes with the FRP-reinforced slabs. Further details regarding the specimens and variables studied are presented in Table 1.
4. NUMERICAL FINITE ELEMENT ANALYSIS OF THE SLABS
The current study employed ABAQUS, a versatile program capable of addressing various nonlinear and linear engineering problems, for conducting finite element analysis on concrete slabs with FRP bars reinforcement under torsional loads.
4.1. Geometric Modeling and Boundary Conditions
Defining the slab geometry was the first step in the ABAQUS/Explicit model. Three-dimensional solid elements were used to model the support plates and slabs. Both the FRP and steel bars were defined as deformable “wire” components. As depicted in Fig. (1), the reactions were acting vertically. The supports at corners C3 and C4 restricted downward movements, and the support at corner C2 prevented upward movement. A downward load was applied at corner C1 [5, 13, 14]. Steel plates 100x100x30 mm were incorporated at loading points and supports to ensure uniform distribution of stresses. The vertical load was applied as a specified displacement using an amplitude function (smooth step). The analysis was performed in step 1 (Dynamic, Explicit), following the initial step.
|
Group No. |
Specimen No. |
f'c (MPa) |
FRP Bar Size (mm) |
Steel Bar Size (mm) |
|---|---|---|---|---|
| G1 | S-21-8 | 21 | 8 | |
| S-21-10 | 21 | 10 | ||
| S-21-12 | 21 | 12 | ||
| G2 | S-25-8 | 25 | 8 | |
| S-25-10 | 25 | 10 | ||
| S-25-12 | 25 | 12 | ||
| G3 | S-30-8 | 30 | 8 | |
| S-30-10 | 30 | 10 | ||
| S-30-12 | 30 | 12 | ||
| G4 | S-35-8 | 35 | 8 | |
| S-35-10 | 35 | 10 | ||
| S-35-12 | 35 | 12 | ||
| G5 | S-40-8 | 40 | 8 | |
| S-40-10 | 40 | 10 | ||
| S-40-12 | 40 | 12 | ||
| G6 | S-45-8 | 45 | 8 | |
| S-45-10 | 45 | 10 | ||
| S-45-12 | 45 | 12 | ||
| G7 | S-50-8 | 50 | 8 | |
| S-50-10 | 50 | 10 | ||
| S-50-12 | 50 | 12 | ||
| G8 | S-S-30-8 | 30 | 8 | |
| S-S-30-10 | 30 | 10 | ||
| S-S-30-12 | 30 | 12 |
Boundary conditions of the slabs.
4.2. Material Modeling
Material properties were assigned to the slab after the geometric definition. The subsections below detail the procedures followed during this stage.
4.2.1. Concrete
The model of Concrete Damage Plasticity (CDP) available in ABAQUS was used to simulate the concrete's response under loading. This model considers the degradation of concrete and accounts for two modes of failure: crushing under compression and cracking under tension. Several parameters are required to define the concrete's plasticity model, including the dilation angle (ψ), the compressive stresses ratio in biaxial and uniaxial states (fbo / fco), the plastic potential eccentricity, the yield surface shape factor (K), and the viscosity parameter. The CDP parameters applied in the current study are presented in Table 2 [14-17].
| CDP Parameters | Value |
|---|---|
| Dilation angle (ψ) | 31° |
| Eccentricity | 0.1 |
| biaxial/uniaxial ratio (fbo / fco) | 1.16 |
| K | 0.667 |
| Viscosity parameter | 0 |
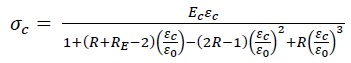
The concrete stress-strain relationship in compression was modeled utilizing the following equations (1a-d) [18]:
 |
(1a) |
 |
(1b) |
 |
(1c) |
 |
(1d) |
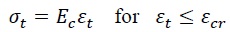
The parameters Rε=4 and Rσ=4 can be applied, σc represents the effective stress, εc denotes the effective strain, ε0 is the strain of concrete at peak stress, set at 0.003, and Ec stands for the initial modulus of elasticity. Fig. (2) illustrates a typical stress-strain curve in compression (for f’c = 30 MPa) as relevant to this study.
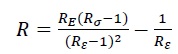
The concrete stress-strain relationship in tension has been described using the following equations (2 a,b) [19-22]:
 |
(2a) |
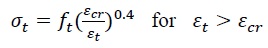 |
(2b) |
εt refers to the tensile strain of concrete, ft represents the tensile strength of the concrete, and εcr is the strain of concrete at peak stress, set at 0.00015 in the current study. Fig. (3) displays a typical stress-strain relationship in tension relevant to the current study.
The damage parameter (dt) accounts for the concrete's degradation under tensile stress and is determined as the ratio of the post-cracking to the ultimate stresses [14, 17]. Moreover, a value of 0.8 was used for the compressive stiffness recovery factor, reflecting the significant recovery of stiffness that occurs when cracks close as the loading transitions from tension to compression.
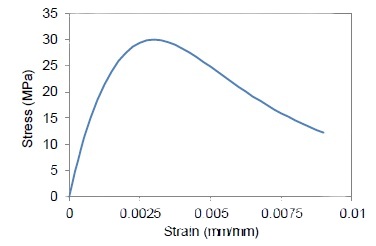
Stress-strain relationship of the concrete under uniaxial compression (f’c = 30 MPa).
4.2.2. FRP Reinforcement
FRP bars were modeled utilizing a linear elastic-brittle material property, characterized by a tensile strength of 1700 MPa and a modulus of elasticity of 150 GPa [23]. The reinforcement was incorporated into the concrete model as an embedded region.
4.2.3. Steel Reinforcement
The steel bars were modeled utilizing a linear elastic-perfect plastic material property characterized by a modulus of elasticity of 200 GPa [14].
4.2.4. Plates
The plates utilized beneath the applied loads and at supports were assigned linear elastic material properties, having a modulus of elasticity of 200 GPa. The interaction between the concrete and plates was established using “Tie constraints” [14].
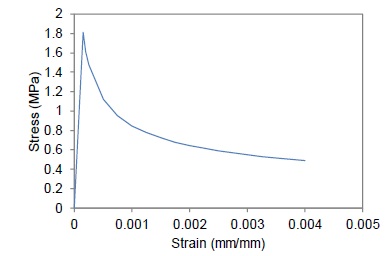
Tensile stress-strain relationship for concrete (f’c = 30 MPa).
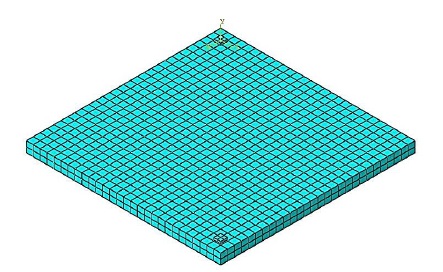
Elements and meshing.
|
Group No. |
Specimen No. |
f'c (MPa) |
FRP Bar Size (mm) |
Cracking Load Pcr (kN) |
Ultimate Load Pult (kN) |
Torsional Cracking Moment Tcr (kN.m/m) |
Tcr/ Tcr,8a |
Torsional Ultimate Moment Tult (kN.m/m) |
Tult/ Tult,8b |
|---|---|---|---|---|---|---|---|---|---|
| G1 | S-21-8 | 21 | 8 | 23.3 | 47.0 | 10.3 | 100% | 20.8 | 100% |
| S-21-10 | 21 | 10 | 23.7 | 50.1 | 10.5 | 102% | 22.2 | 107% | |
| S-21-12 | 21 | 12 | 24.2 | 50.9 | 10.7 | 104% | 22.5 | 108% | |
| G2 | S-25-8 | 25 | 8 | 25.6 | 49.7 | 11.3 | 100% | 22.0 | 100% |
| S-25-10 | 25 | 10 | 26.1 | 53.3 | 11.5 | 102% | 23.6 | 107% | |
| S-25-12 | 25 | 12 | 26.5 | 57.9 | 11.7 | 104% | 25.6 | 116% | |
| G3 | S-30-8 | 30 | 8 | 27.9 | 52.8 | 12.4 | 100% | 23.3 | 100% |
| S-30-10 | 30 | 10 | 28.5 | 56.5 | 12.6 | 102% | 25.0 | 107% | |
| S-30-12 | 30 | 12 | 29.0 | 58.8 | 12.8 | 103% | 26.0 | 112% | |
| G4 | S-35-8 | 35 | 8 | 30.0 | 54.1 | 13.3 | 100% | 23.9 | 100% |
| S-35-10 | 35 | 10 | 30.7 | 59.7 | 13.6 | 102% | 26.4 | 110% | |
| S-35-12 | 35 | 12 | 31.2 | 61.7 | 13.8 | 104% | 27.3 | 114% | |
| G5 | S-40-8 | 40 | 8 | 32.1 | 50.1 | 14.2 | 100% | 25.4 | 100% |
| S-40-10 | 40 | 10 | 32.8 | 61.7 | 14.5 | 102% | 27.3 | 107% | |
| S-40-12 | 40 | 12 | 33.4 | 64.4 | 14.7 | 104% | 28.5 | 112% | |
| G6 | S-45-8 | 45 | 8 | 33.9 | 58.7 | 15.0 | 100% | 26.0 | 100% |
| S-45-10 | 45 | 10 | 34.6 | 63.6 | 15.3 | 102% | 28.1 | 108% | |
| S-45-12 | 45 | 12 | 35.2 | 70.2 | 15.6 | 104% | 31.0 | 119% | |
| G7 | S-50-8 | 50 | 8 | 35.7 | 59.7 | 15.8 | 100% | 26.4 | 100% |
| S-50-10 | 50 | 10 | 36.4 | 67.0 | 16.1 | 102% | 29.6 | 112% | |
| S-50-12 | 50 | 12 | 37.1 | 72.5 | 16.4 | 104% | 32.0 | 121% |
4.3. Element Types and Mesh Generation
As illustrated in Fig. (4), the concrete and plate components were discretized with first-order hexahedral elements. Specifically, C3D8R elements, with eight nodes, reduced integration, and hourglass control, were selected to provide accurate results with minimal computational effort for 3D analyses. For the reinforcement, T3D2 truss elements, comprising two nodes, were utilized. The elements' general size was set to 100 mm [14].
5. RESULTS AND DISCUSSION
The results are presented in the following sections, emphasizing the influence of the studied parameters on the torsional behavior and strength of the slabs.
5.1. Ultimate Load
In Table 3, data are provided for various parameters, including cracking load (Pcr) and ultimate load (Pult). There is an increase in the values of these two loads with an increase in FRP bar size and f’c. These two parameters are used to calculate the torsional cracking and ultimate moment as detailed in the next subsection.
5.2. Torsional Behaviour of the Slabs
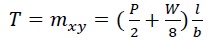
This section presents the torsional behavior of the slabs. The torsional moment (T) can be determined from the following equation (3) [24]:
 |
(3) |
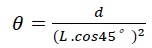
where T or mxy is the slab average torsional moment, W is the slab self-weight, which was neglected in the current study, P is the applied load at the corner C1, l is the lever arm of the load (the distance from C1 to C3, or C1 to C4) and is equal to 2.475 m, and b=2.8 m. The following equation (4) is used to calculate the slab rotation per unit length (θ) [5]:
 |
(4) |
where L is the diagonal length of the slab, which is equal to 3.5 m.
5.2.1. Influence of FRP Bar Size on the Torsional Behavior of Slabs
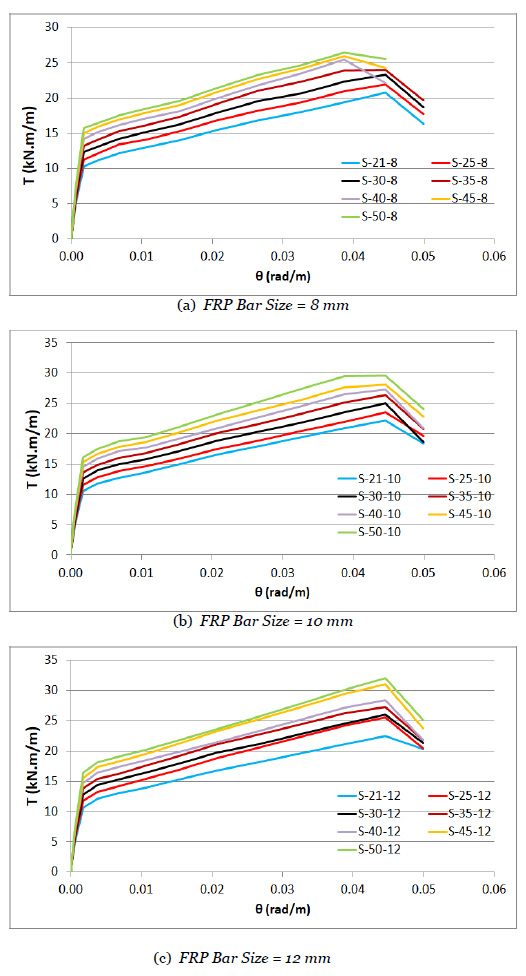
Data on torsional properties are provided in Table 3. These data include the torsional cracking moment (Tcr), the torsional ultimate moment (Tult), and the change in the values of these moments with the increase in FRP bar size. The torsional cracking moment exhibited a slight increase with larger FRP bar sizes across the various groups. Specifically, an increase of approximately 3%–4% was observed when using 12 mm FRP bars instead of 8 mm bars, aligning with the findings of Ibraheem and Mukhlif [8], who also reported a limited effect of reinforcement on the cracking load. However, the effect of FRP bar size on the torsional ultimate moment was more pronounced compared to its effect on the torsional cracking moment. The final column of Table 3 in each group highlights the percentage of the torsional ultimate moment for the slab to that of the reference case with 8 mm FRP bars. An increase in the FRP bar size led to a corresponding rise in the torsional ultimate moment, with enhancements ranging from 8% to 21% when 12 mm bars replaced 8 mm bars in the specimens. The highest observed increase was 21%, occurring in the group of slabs with a compressive strength of concrete of 50 MPa, where the torsional ultimate moment rose from 26.4 kN·m/m for S-50-8 to 32 kN·m/m for S-50-12.
Fig. (5) shows the T-θ charts for the slabs. These charts are similar for the different FRP bar sizes of the slabs.
T-θ Curves of the slabs showing the effect of FRP bar size.
| Specimen No. |
f'c (MPa) |
FRP bar size (mm) |
Torsional Cracking Moment Tcr (kN.m/m) |
Tcr/ Tcr,21a |
Torsional Ultimate Moment Tult (kN.m/m) |
Tult/ Tult,21b |
|---|---|---|---|---|---|---|
| S-21-8 | 21 | 8 | 10.3 | 100% | 20.8 | 100% |
| S-25-8 | 25 | 8 | 11.3 | 110% | 22.0 | 106% |
| S-30-8 | 30 | 8 | 12.4 | 120% | 23.3 | 112% |
| S-35-8 | 35 | 8 | 13.3 | 129% | 23.9 | 115% |
| S-40-8 | 40 | 8 | 14.2 | 138% | 25.4 | 122% |
| S-45-8 | 45 | 8 | 15.0 | 146% | 26.0 | 125% |
| S-50-8 | 50 | 8 | 15.8 | 153% | 26.4 | 127% |
| S-21-10 | 21 | 10 | 10.5 | 100% | 22.2 | 100% |
| S-25-10 | 25 | 10 | 11.5 | 110% | 23.6 | 106% |
| S-30-10 | 30 | 10 | 12.6 | 120% | 25.0 | 113% |
| S-35-10 | 35 | 10 | 13.6 | 130% | 26.4 | 119% |
| S-40-10 | 40 | 10 | 14.5 | 138% | 27.3 | 123% |
| S-45-10 | 45 | 10 | 15.3 | 146% | 28.1 | 127% |
| S-50-10 | 50 | 10 | 16.1 | 153% | 29.6 | 133% |
| S-21-12 | 21 | 12 | 10.7 | 100% | 22.5 | 100% |
| S-25-12 | 25 | 12 | 11.7 | 109% | 25.6 | 114% |
| S-30-12 | 30 | 12 | 12.8 | 120% | 26.0 | 116% |
| S-35-12 | 35 | 12 | 13.8 | 129% | 27.3 | 121% |
| S-40-12 | 40 | 12 | 14.7 | 137% | 28.5 | 127% |
| S-45-12 | 45 | 12 | 15.6 | 146% | 31.0 | 138% |
| S-50-12 | 50 | 12 | 16.4 | 153% | 32.0 | 142% |
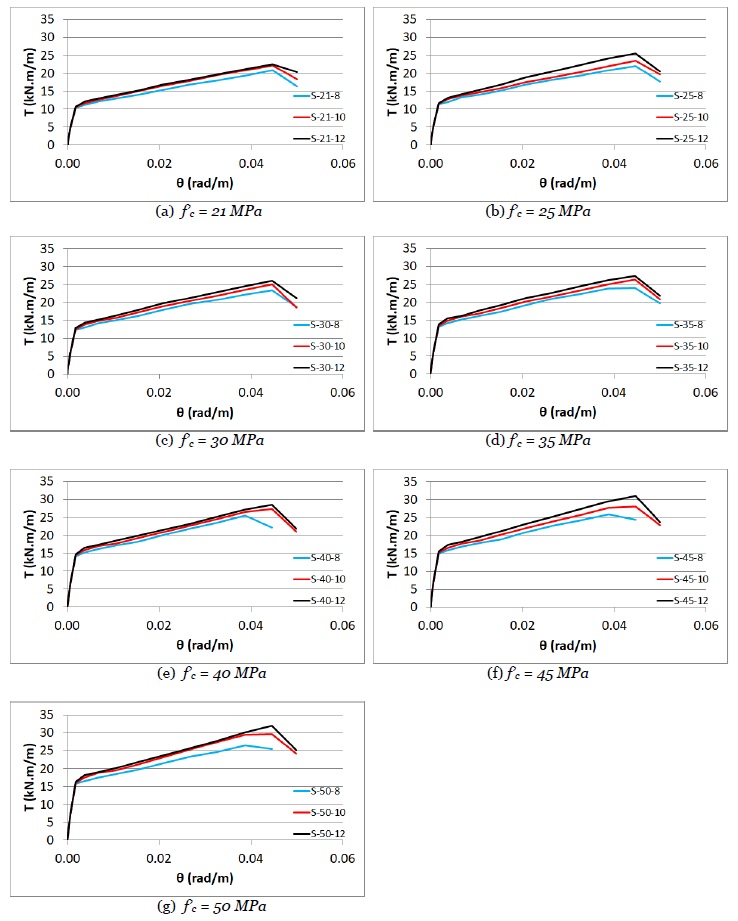
5.2.2. Influence of Compressive Strength of Concrete on the Torsional Behavior of Slabs
Table 4 presents the torsional cracking moment and torsional ultimate moment for all the slabs, arranged to show the influence of the compressive strength of concrete on these two moments. The slabs were arranged in three groups, each with a different FRP bar size. Every group included seven slabs with different compressive strengths of concrete. Torsional cracking moment significantly increased with an increase in compressive strength of concrete of different groups. This moment increased by 53% for different groups due to the influence of using compressive strength of concrete of 50 MPa instead of 21 MPa. For each group, the final column in Table 4 provides the percentage of the torsional ultimate moment of the slabs to that of the reference case with a compressive strength of concrete of 21 MPa. The torsional ultimate moment showed a substantial increase with the rise in the compressive strength of concrete. This moment increased between 27% to 42% by using the compressive strength of concrete of 50 MPa instead of 21 MPa in different groups. In this regard, the maximum increase in torsional ultimate moment was 42% (from 22.5 kN.m/m for S-21-12 to 32 kN.m/m for S-50-12), which was for the slabs in the group reinforced with 12 mm bar size.
Fig. (6) illustrates the T-θ charts for the slabs, organized to highlight the impact of the compressive strength of concrete on this relationship. The charts reveal a similar T-θ relationship across different compressive strengths of concrete of the slabs, with an increase in both the torsional cracking and ultimate moments as the compressive strength of concrete increases. The T-θ curves in both Figs. (5 and 6) exhibit a nearly bilinear behavior. The initial segment of the curve is approximately linear with a steeper slope, indicating the stiffness of the uncracked slab. Beyond a certain load level, the curve transitions to another linear segment with a gentler slope, representing the reduced stiffness of the cracked slab. These findings are consistent with previous experimental studies by Rashid [25], Zhang [26], and Adam [27], which reported similar trends in load-deflection curves for slabs reinforced with FRP under various loading conditions.
5.2.3. Torsional Behaviour of Slabs with FRP Reinforcement Compared to Slabs with Steel Reinforcement
A comparison of the torsional behavior of slabs with FRP bars reinforcement and those with steel bars reinforcement was conducted. Table 5 presents the torsional cracking moment and torsional ultimate moment for two groups of slabs, both having a compressive strength of concrete of 30 MPa. Group (G3) consisted of slabs reinforced with FRP bars in three different sizes, while group (G8) consisted of slabs reinforced with steel bars of similar sizes to those in (G3). The torsional cracking and ultimate moments for group (G3) were comparable to those of group (G8). This indicates that, in addition to the beneficial properties of FRP materials compared to steel, the torsional behavior and strength of slabs with FRP bar reinforcement are similar to those with steel bar reinforcement. These findings not only bridge a critical gap in understanding the torsional behavior of FRP-reinforced slabs but also pave the way for their broader adoption in applications requiring enhanced durability and performance under torsional loads. It is also worth noting that, as shown in Table 5, the torsional ultimate moment of slabs reinforced with FRP is 91–92% of that of slabs reinforced with steel bars. These findings are in close agreement with the findings of Zhang [26], which reported a 91% capacity for CFRP-reinforced slabs compared to steel-reinforced slabs under centrally concentrated loading.
T-θ Curves of the slabs showing the concrete compressive strength.
|
Group No. |
Specimen No. |
f'c (MPa) |
FRP bar size (mm) |
Steel bar size (mm) |
Torsional Cracking Moment Tcr (kN.m/m) |
Tcr/ Tcr,8a |
Torsional Ultimate Moment Tult (kN.m/m) |
Tult/ Tult,8b |
|---|---|---|---|---|---|---|---|---|
| G3 | S-30-8 | 30 | 8 | 12.4 | 100% | 23.3 | 100% | |
| S-30-10 | 30 | 10 | 12.6 | 102% | 25.0 | 107% | ||
| S-30-12 | 30 | 12 | 12.8 | 103% | 26.0 | 112% | ||
| G8 | S-S-30-8 | 30 | 8 | 12.5 | 100% | 25.6 | 100% | |
| S-S-30-10 | 30 | 10 | 12.8 | 102% | 27.4 | 107% | ||
| S-S-30-12 | 30 | 12 | 13.0 | 104% | 28.2 | 110% |
| Study/Refs | Specimen No. |
Pmax (kN) |
dpmax (mm) |
|---|---|---|---|
| Lopes et al [5] | S3.5-8-L-N(1) | 58 | 315 |
| S3.5-8-L-N(2) | 52 | 235 | |
| Average | 55 | 275 | |
| Current | S-30-8 | 52.8 | 273 |
| Current/Lopes et al % | 96% | 99.3% | |
5.2.4. Verification of the FEA Model
To validate the FEA model and assess its accuracy, the results for slab S-30-8 were compared with the experimental findings of two slabs derived from the P-d relationship curves presented by Lopes et al [5]. These experimental slabs share the same dimensions, support conditions, loading, and reinforcement bar size as slab S-30-8 analyzed in the current study. The comparison results are provided in Table 6. Notably, these experimental slabs are reinforced with steel bars, as no experimental data currently exists for FRP-reinforced slabs under torsion. The comparison focused on the maximum applied load (Pmax) and the corresponding vertical displacement (dpmax). As shown in Table 6, the results of the current study closely match the experimental data of Lopes et al The Pmax obtained in this study was 52.8 kN, which represented 96% of the average Pmax (55 kN) from the experimental slabs. The slightly lower Pmax observed in this study aligns with previous findings indicating that CFRP reinforcement slightly reduces the load capacity of slabs compared to steel reinforcement [26]. Similarly, the dpmax recorded in this study was 273 mm, representing 99.3% of the average dpmax (275 mm) from Lopes et al's experiments. It is worth noting that the dpmax value in this study, although not explicitly detailed in earlier sections, corresponds to a slab rotation (θ) of 0.0446 rad/m at the maximum torsional moment for slab S-30-8, as shown in Figs. (5 and 6). As described in Section 5.2, the relationship between rotation and displacement was calculated using Equation (4).
CONCLUSION
A fundamental understanding of torsional behavior was achieved through the finite element analysis of twenty-four FRP and steel-reinforced concrete slabs, leading to the following key concluding points:
• The use of FRP bars resulted in an increase in the torsional ultimate moment of the slabs.
• The size of the FRP bars influenced the torsional ultimate moment, with an increase ranging from 8% to 21% when the FRP bar size was increased from 8 mm to 12 mm. The maximum increase (21%) was for the group of slabs with compressive strength of concrete of 50 MPa.
• The size of the FRP bars had a minor influence on the torsional cracking moment, with an increase of only 3% to 4% when the FRP bar size was changed from 8 mm to 12 mm.
• A significant effect of the compressive strength of concrete on the torsional cracking moment of the slabs was observed.
• The torsional cracking moment increased by 53% when the compressive strength of concrete was increased from 21 MPa to 50 MPa.
• The torsional ultimate moment showed a significant increase with the rise in the compressive strength of concrete. This moment increased by 27% to 42% when the compressive strength of concrete was raised from 21 MPa to 50 MPa.
• There were similar T-θ relationships across different slabs, with both the torsional cracking and ultimate moments increasing as the compressive strength of concrete and FRP bar size were increased.
• In addition to the beneficial properties of FRP materials compared to steel, the torsional behavior and strength of slabs with FRP bar reinforcement were close to those with steel bar reinforcement.
RECOMMENDATIONS
Based on the findings, the following recommendations are proposed for future research and practical applications:
• The impact of environmental factors on FRP-reinforced concrete slabs under torsion should be studied.
• Varying FRP types and sizes for torsional optimization should be explored.
• The high-strength concrete slabs subjected to torsion should be studied.
• Combined loading effects on FRP-reinforced slabs should be explored.
AUTHORS’ CONTRIBUTIONS
The author confirms sole responsibility for the following: study conception and design, data collection, analysis and interpretation of results, and manuscript preparation.
LIST OF ABBREVIATIONS
| FEA | = Finite Element Analysis |
| GFRP | = Glass Fiber-reinforced Polymer |
| CDP | = Concrete Damage Plasticity |
AVAILABILITY OF DATA AND MATERIALS
The data and supportive information are available within the article.
ACKNOWLEDGEMENTS
Declared none.

