All published articles of this journal are available on ScienceDirect.

Machine Learning Techniques Evaluating Housing Projects Performance
Authors Info & Affiliations
Abstract
Background
Despite developments in the construction industry and construction projects, performance optimisation remains a critical need. Accurately estimating and measuring performance is essential for effective planning and cost forecasting. This study addresses the significant housing shortage in Iraq by assessing the performance and productivity of construction teams on residential housing projects.
Methodology
Two machine learning techniques were applied—multiple linear regression (MLR) and support vector regression (SVR). Sixty datasets from different housing projects in Baghdad and central Iraq were analysed. Seven datasets were allocated for validation. Models were evaluated using measures including mean square error (MSE), root mean square error (RMSE), mean absolute error (MAE), correlation coefficient (R), and coefficient of determination (R2).
Results
Multiple linear regression outperformed support vector regression, showing lower prediction errors and stronger correlations with actual values.
Conclusion
These results provide valuable insights into construction productivity, expressed in labour hours per square metre of built area. They enable experts to accurately estimate task duration, supporting accurate cost estimation and effective project planning. This contributes significantly to meeting the demand for housing units due to population growth.
1. INTRODUCTION
The construction industry is integral to economic development and prosperity, significantly influencing infrastructure, buildings, and housing projects [1, 2]. This sector constitutes a nation's economy's foundation, propelled by demographic expansion and changing social demands [3, 4]. Population expansion directly affects the need for housing developments, as the relationship between population and land allocated for housing in China was studied [5]. Researchers noted an increase in the number of people in urban areas compared to rural areas. In several countries, including Iraq, housing construction is obstructed by insufficient finance, inadequate investor protection regulations, and substandard infrastructure [6]. One of these countries, which suffers from a severe shortage of housing units, is Iraq. Despite of this, residential projects are the most common construction projects compared to other projects [7]. Alsamarraie and Ghazali believe that construction projects are the most important industries in the economy of Iraq [8]. Statistical reports indicate that Iraq's population will exceed 70 million in the next 20 years [9]. Despite its importance, the construction sector in Iraq faces many challenges, the most important of which is poor construction productivity [10]. Some studies have attempted to understand the factors affecting productivity in Iraqi construction projects as they suffer from performance issues [11]. This study explores how accurately completion time and delays can be predicted using machine learning models. The focus is on housing projects in Iraq, where rapid urbanization and severe housing shortages demand effective solutions. A comparative analysis was performed to evaluate the two-machine learning multiple linear regression MLR and support vector regression SVR prediction models. The choice of machine learning techniques depends on their unique functionalities. MLR offers clear insights into linear associations across variables, making it beneficial for preliminary assessments [12]. Conversely, SVR is proficient in identifying non-linear patterns and has robust generalization capabilities, even with constrained datasets, hence mitigating the challenges of data shortage often seen in the Iraqi construction sector [13]. This study aims to fill this gap by presenting an accurate and improved predictive model based on machine learning techniques (MLR and SVR) to measure the performance of construction teams in the execution of residential construction works. Unlike previous studies that focused on overall performance or costs, this study presents a comparative analysis of two linear techniques. It demonstrates which one is more accurate in predicting completion time based on actual data from residential projects implemented in Baghdad and central Iraq. The study provides new insights into construction performance trends for horizontal projects. It shows how predictive models can be used to make accurate decisions in project planning, improve productivity, and minimise delays. This study is one of the first to combine applied statistical analysis with the use of machine learning techniques in an Iraqi housing project environment with limited and unstructured data. The research provides a technique for estimating the duration and productivity required for housing project completion, enabling precise planning and productivity enhancement to increase housing availability.
2. LITERATURE REVIEW
Construction encompasses interrelated activities, including planning, design, execution, and maintenance, all influencing the project time [14]. Governments and politicians prioritize enhancing productivity because of its impact on economic performance and employment [15]. In general, CP (Construction Productivity) is the input used in construction processes, such as the cost or time spent to produce a certain area of construction or a quantity of concrete (outputs) [15]. Many studies have been conducted using different methods to calculate and estimate the performance and production to enable specialists to understand and improve the performance of projects [16]. Some of these studies and methods used can be noted as follows. Researchers used the modelling method to develop a mathematical model that can calculate and estimate initial costs in the pre-construction stages of road projects based on the linear regression technique [17]. This study was conducted in Palestine, West Bank, using data from 131 projects. Recent studies have demonstrated the effectiveness of applying machine learning techniques to predict material properties and structural behaviour. For instance, a study [18] utilised XGBoost and Random Forest models to forecast the compressive and flexural strength of a geopolymer made from coal waste. Additionally, another study developed a model to characterise the texture of asphalt layers using binocular vision and deep learning techniques, thereby enhancing the accuracy of skid resistance assessment on roads [19]. A study determined the cost of building materials based on a fuzzy-logic forecasting model [20]. A modified fuzzy-logic model integrates factors that directly affect building material prices, such as market demand, inflation rates, and supply chain dynamics. A similar aim was investigated in a study [21]; the researcher developed a mathematical model that could estimate the initial costs of construction projects. The methodology followed in this study integrates two different modeling techniques: multiple regression analysis and Case-Based Reasoning (CBR). The study focused on housing projects, and ninety-nine housing data sets were used in the modeling processes. The findings indicated that the model successfully estimated project expenses. Another research [22] explored productivity prediction. They created a discrete event simulation (DES) model to mimic the workflow of two MRCs and two mounted RC projects, incorporating an MLR method for projecting unit production time. Mahfouz [23] developed a decision support system for estimating productivity rates in construction projects using machine learning techniques, specifically Support Vector Machine (SVM) and Naive Bayes (NB) algorithms. The study also emphasised the importance of replacing traditional estimation methods based on experience with accurate automated models, which contributes to improving the accuracy of decision-making in project planning. The installation process of modular integrated construction (MIC), including its main features, such as weather conditions, terrain, and management situations was studied. Finally, a case study was conducted in Hong Kong to demonstrate the applicability of this model. Validation results revealed a high accuracy of the prediction model, with an error rate of 8.93%. In the same research area, researchers conducted an extensive literature review on the modeling, estimation, and forecasting of construction projects to improve their performance [24]. This study emphasized adopting accurate forecasting methods and their development to achieve highly reliable forecasting models. It also integrated the concepts of flexible construction, work control, risk management, production improvement, and variable management in the construction industry. Sanni-Anibire et al. proposed a comprehensive machine learning-based framework for minimising construction project delays through the use of predictive models in key areas such as cost estimation, duration prediction, and delay risk assessment [25]. The study demonstrated the effectiveness of several machine learning algorithms, including linear regression, SVM, neural networks, and clustering methods, emphasising the importance of digital technologies in improving project performance under Construction 4.0. A study was carried out [13] investigating the earnings of building projects in Ghana. The approach used in this study was quantitative analysis using support vector regression (SVR) to develop a predictive model. Historical data from 150 construction projects were used. The results indicated that SVR has an average forecasting accuracy. The results also showed the sensitivity of the prediction results of this model to workforce and loans. This mathematical model helps project owners accurately estimate costs and know the expected profits from construction projects. Researchers [26] conducted further research on cost estimations. An artificial intelligence model (SVM) was developed to forecast the project's initial stage costs. The AI model was trained based on 40 previous cost-data projects. The developed SVM showed high accuracy in prediction when dealing with nonlinear regression. A comparative analysis examined two AI approaches: grey wolf optimization and SVR. Researchers [27] researched to develop a model that can predict the performance of geopolymer concrete. The approaches used were the grey wolf optimizer (GWO) and SVR. The results showed that the adopted model has high prediction performance. A study was carried out [28] in which the authors were interested in forecasting construction expenses by assessing machine learning techniques. A few other researchers [29] evaluated the last planner system (LPS) and machine learning to forecast construction schedule performance in the early stages of projects. This study focused on high-rise buildings. Findings approved the high accuracy of LPS. A study conducted by Kusonkhum et al. [30] developed a machine learning-based model for predicting budget overruns in government construction projects in Thailand, using the k-nearest neighbour (KNN) algorithm. The model was based on data from 692 completed projects and achieved a predictive accuracy of 86%, confirming the effectiveness of machine learning techniques in supporting financial decision-making in large-scale government projects. Researchers [31] concluded a review study to explore applications of deep learning (DL) technologies in the construction industry, focusing on energy predictions, cost estimation, and site safety by analyzing 45 previous studies. Results showed that DL can improve decision-making, safety, and automation while forecasting expenses and energy requirements. Extending this line of studies, Nigerian researchers [32] employed machine learning algorithms, such as bagging, boosting, and stacking, to forecast delays using data from building projects. The findings illustrated the ability of ML to augment proactive project management, mitigate delays, and enhance overall Construction performance. These results correspond with the study conducted [33], where they developed ML models (voting and stacking algorithms) to predict the productivity of formwork installation for construction projects. Results showed the high accuracy of meta-ensemble models in forecasting labour productivity. ML algorithms to forecast construction delays were utilized [34]. Decision tree (DT) and Naïve Bayes (NB) techniques were used to analyze the data of Quatrain mega projects. Egyptian researchers used the same techniques [35]. They developed the same approaches of ML algorithms DT and NB based on key risk factors to predict the delay of construction projects. Results show that DT performs better than NB in predicting accuracy. A comparative study was carried out to compare the performance of four different ML models: K-nearest neighbor (KNN), SVR, boosting trees (BT), and ANN [36]. These models are used to predict the construction durations of multi-tower projects in China. The boosting trees model showed higher performance than other models. Researchers considered factors such as weather, team size, and site complexity that affect productivity at different levels (high, medium, and low) [37]. ML approach was used depending on KNN and SVM modeling. Results showed that KNN has the highest accuracy in predicting productivity levels. Authors focused on key performance indicators (KPIs) for construction projects. ANN and Neuro-Fuzzy were used to analyze the survey data collected by questionnaire [38]. This research aimed to enhance project performance during the construction phase. The neuro-fuzzy technique demonstrated superior performance compared to ANN [39]. It is clear from previous reviews and studies that project management research is looking for ways to model and calculate productivity, the factors affecting it, and ways to improve it. This study stands out by addressing the critical issue of housing and the severe shortage of residential units compared to the rapid population growth in Iraq. Despite prior studies that used machine learning methods or examined performance and cost estimations in construction projects, this study is distinctive in its concentration on structural work performance in housing unit projects, particularly horizontal residential complexes. Through a review of previous studies and notable advances in machine learning, this research does a comparative analysis of two ML models, MLR and SVR, using actual project data supported by validation via real-world data. Despite the efforts, challenges such as difficulty obtaining high-quality data and the variability of construction project conditions have confined the scope of the study to horizontal housing projects in central Iraq. Nevertheless, despite these limitations, this study provides practical insights for improving and implementing housing projects, contributing to economic development, and addressing the residential unit shortage.
3. RESEARCH METHODOLOGY
Research methodology refers to the methods and steps used to achieve the objectives of this study. The study problem, which focused on the performance of housing construction projects (structural works), was identified at the beginning of the study. Research objectives were also identified. An appropriate methodology was chosen to achieve the study objectives based on previous literature and methods followed by previous researchers. Researchers used machine learning techniques to estimate the CLP [40]. The results of their study demonstrated the high accuracy of machine learning in estimating project productivity. AI techniques have been utilized to improve productivity by forecasting CLP with a high-performance prediction model [41]. The authors conducted a study that relied on data from a survey and analyzed it using an artificial intelligence technique to evaluate the production rate of prefabricated construction projects [42]. To assess potential cyber risks in construction projects, a machine-learning method was used to study and evaluate potential risks [43].
3.1. Data Gathering and Preprocessing
Based on research reviews, the data used in modelling was usually collected via surveys or project data. This study depended on the project data. Quantitative approaches were used to predict the time and production rate required to complete the structural work of housing units. Data was collected from different landed housing projects, as shown in Table 1, illustrating some modelling data details. The data were examined, and independent and dependent variables were identified.
| Project | Units Number | Completion% | Unit Types | Units Area m2 | ||
|---|---|---|---|---|---|---|
| Total | Structure Finished | Max | Min | |||
| P1 | 11500 | 8790 | 76.43% | 14 | 400 | 160 |
| P2 | 1525 | 1219 | 79.93% | 7 | 300 | 153 |
| P3 | 1666 | 1322 | 79.35% | 10 | 400 | 153 |
| P4 | 3000 | 1900 | 63.33% | 4 | 300 | 200 |
| P5 | 1390 | 1005 | 72.30% | 6 | 400 | 170 |
| P6 | 1052 | 888 | 84.41% | 6 | 270 | 180 |
| P7 | 2134 | 1758 | 82.38% | 4 | 250 | 160 |
| P8 | 626 | 526 | 84.03% | 3 | 270 | 195 |
| P9 | 1620 | 1105 | 68.21% | 3 | 300 | 185 |
| P10 | 696 | 497 | 71.41% | 3 | 350 | 190 |
| Total Data Sets | 60 | |||||
| - | - | Real Time | TA | BA | NOR | BR | CWQ | BWQ | NBWT |
|---|---|---|---|---|---|---|---|---|---|
| Real Time | Correlation | 1 | 0.740** | 0.884** | 0.655** | 0.288* | 0.857** | 0.875** | 0.742** |
| Sig. | 0.000 | 0.000 | 0.000 | 0.026 | 0.000 | 0.000 | 0.000 | ||
| TA | Correlation | 0.740** | 1 | 0.818** | 0.589** | -0.227 | 0.823** | 0.714** | 0.690** |
| Sig. | 0.000 | 0.000 | 0.000 | 0.082 | 0.000 | 0.000 | 0.000 | ||
| BA | Correlation | 0.884** | 0.818** | 1 | 0.768** | 0.350** | 0.942** | 0.877** | 0.715** |
| Sig. | 0.000 | 0.000 | 0.000 | 0.006 | 0.000 | 0.000 | 0.000 | ||
| NOR | Correlation | 0.655** | 0.589** | 0.768** | 1 | 0.312* | 0.746** | 0.724** | 0.560** |
| Sig. | 0.000 | 0.000 | 0.000 | 0.015 | 0.000 | 0.000 | 0.000 | ||
| BR | Correlation | 0.288* | -0.227 | 0.350** | 0.312* | 1 | 0.213 | 0.329* | 0.095 |
| Sig. | 0.026 | 0.082 | 0.006 | 0.015 | 0.103 | 0.010 | 0.471 | ||
| CWQ | Correlation | 0.857** | 0.823** | 0.942** | 0.746** | 0.213 | 1 | 0.786** | 0.647** |
| Sig. | 0.000 | 0.000 | 0.000 | 0.000 | 0.103 | 0.000 | 0.000 | ||
| BWQ | Correlation | 0.875** | 0.714** | 0.877** | 0.724** | 0.329* | 0.786** | 1 | 0.805** |
| Sig. | 0.000 | 0.000 | 0.000 | 0.000 | 0.010 | 0.000 | 0.000 | ||
| NBWT | Correlation | 0.742** | 0.690** | 0.715** | 0.560** | 0.095 | 0.647** | 0.805** | 1 |
| Sig. | 0.000 | 0.000 | 0.000 | 0.000 | 0.471 | 0.000 | 0.000 |
This study relied on 60 actual data sets collected from nine horizontal housing projects implemented in Baghdad and the central regions of Iraq. Each dataset represents a single housing unit comprising seven independent variables and one dependent variable (construction duration). Sixty datasets were used to build the models, while seven datasets were allocated for validation. Since the study relies on real-world data rather than survey data, the sample size was chosen based on the actual available projects implemented and documented, which gives the results a highly practical and realistic nature. To ensure that this sample size is statistically valid, a well-known rule of thumb used in predictive statistical analysis is that:
‘The minimum acceptable sample size in regression analysis is 5 to 10 observations per independent variable’ [44]. Applying this rule, the number of independent variables in this study is 7, so the minimum acceptable sample size is between 35 and 70 data sets. Since the actual number of data is 60, the average data per variable = 8.57, which is within the acceptable statistical range to ensure the reliability and statistical significance of the model. A comprehensive assessment of data completeness was conducted to detect any missing values. Missing data points were addressed by imputation methods where applicable or removed if their absence was considered insignificant, assuring no substantial effect on the analysis. The correlation analysis was conducted, where the results showed a high correlation between real-time and input variables such as total area, built area, concrete work quantity, and brickwork quantity. Moderate correlations were found between the number of rooms and the number of brickwork team members, while lower correlations were found with the built ratio. Table 2 illustrates the correlation analysis.
Fig. (1) shows the percentage of the dataset obtained from each project. TA ranged from 400 m2 for luxury houses to 153 m2 for normal functional houses. Fig. (2) shows the percentages of units in the different areas. The built ratio results from dividing the net-built area by the total area. QBW refers to the amount of brickwork used to build the house walls (m3; clay bricks were used. The foundations and roof concrete work were referred to by the QCT m3.
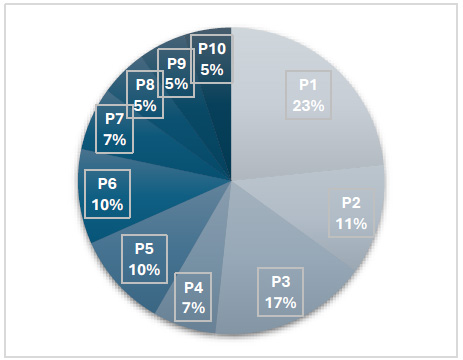
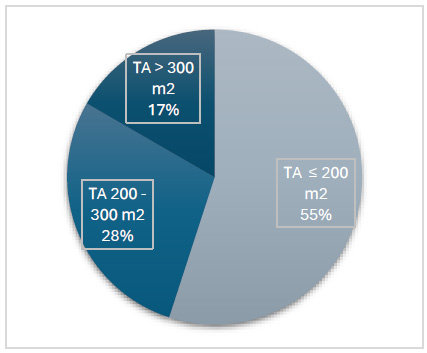
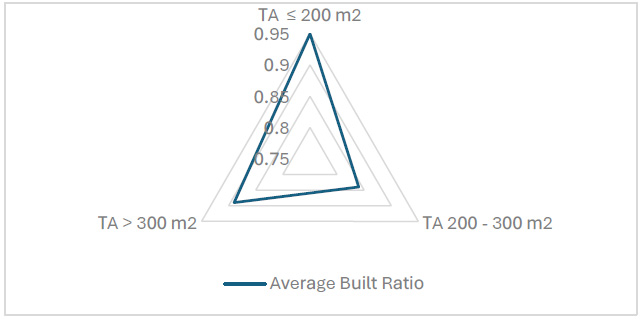
It is obvious that project one, P1, had the highest percentage of data sets at 23%, while P8, P9, and P10 had the lowest data rate. Fig. (2) indicates that the most built type in housing projects is those with areas of 200 square meters or less. The percentage of units ranging from 200 to 300 has a smaller number of areas (less than 200 square meters. The big housing units represent only 17% of the houses in these projects. This resulted in the most desired housing unit area of 200m2 or less. Fig. (3) illustrates the NAR for different classifications of total area.
Based on Fig. (3), the ratio of the building area to the total area of houses with an area of 200 square meters or less is relatively higher in smaller areas. These results are logical, as in small areas, the spaces left for entertainment purposes, such as parking, are usually fewer than those found in houses with large areas. Houses with 200–300 m2 areas showed the lowest average built ratio. This ratio represents the area utilization of residential units. Most housing units in this study had a ground and first floor or a ground and half first floor. After checking and reviewing the data, the data containing the variables were tabulated for modelling.
3.2. Machine Learning Modeling
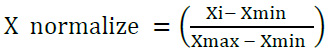
This study used a quantitative approach. It utilizes two machine learning techniques, multiple linear regression (MLR) and Support Vector Regression (SVR), to forecast the performance of residential building projects. The Statistical Package for the Social Sciences SV26 software was used to develop the MLR model [45], while the Orange Data Mining 3.37.0 software developed the SVR model [46]. This study assumes a linear relationship between the dependent and independent variables. MLR used normal data without normalization, whereas a normalization function was used to rescale the data for the SVR model. Equation (1) shows the normalization function [47].
 |
(1) |
Where: Xi is the value of the variable X for a specific data point in the dataset, X max sets the upper bound for normalization, and X min sets the lower bound for normalization. Equation (2) provides a general structure of the MLR model that was used in this study.
 |
(2) |
where Y is the dependent variable, B0is the intercept, and B1, B2…, B7 are the coefficients of the independent variables X1, X2,, X7, and ϵ is the error term [12]. Support Vector Regression (SVR) was used to develop a model using a linear kernel function. The orange program contained different types of kernel functions (polynomial, linear, sigmoid, and Radial Basis Function RBF), as shown in Table 3 [48].
Evaluation performance metrics were used to evaluate the performance of the mathematical model: mean squared error (MSE), root mean squared error (RMSE), mean absolute error (MAE), mean percentage error (MPE)%, correlation coefficient (R), and Coefficient of Determination (R2) [49]. Equations (3-8) show mathematical representations of these metrics [50].
 |
(3) |
 |
(4) |
 |
(5) |
 |
(6) |
 |
(7) |
where yi is the actual value and yi is the predicted value, and n is the number of observations or datasets.
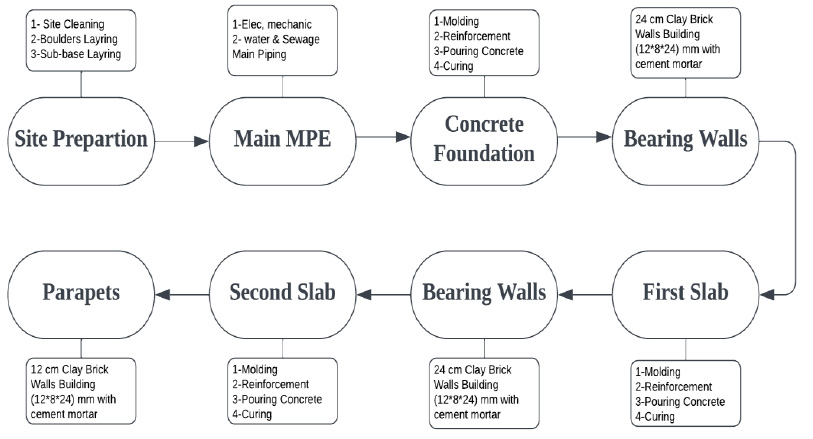
An interview was conducted with three contractors specializing in construction to calculate the value of project delays. This interview aimed to adopt the real productivity values for each working team to calculate the optimal period for implementing each task. Thus, we calculated the time required to complete each house model, compared it with the period implemented, and found the difference between them. Fig. (4) shows the sequence of structural tasks for landed housing units.
| Kernel | Mathematical Representation | Uses |
|---|---|---|
| Linear | K(xi, xj)=xi⋅xj | Linear data |
| Polynomial | K(xi,xj)=(xi⋅xj+c)d | Data requiring polynomial boundaries |
| RBF | K(xi,xj)=exp(−γ∥xi−xj∥2) | Non-linear data |
| Sigmoid | K(xi,xj)=tanh(αxi⋅xj+c) | Data with sigmoidal relationships |
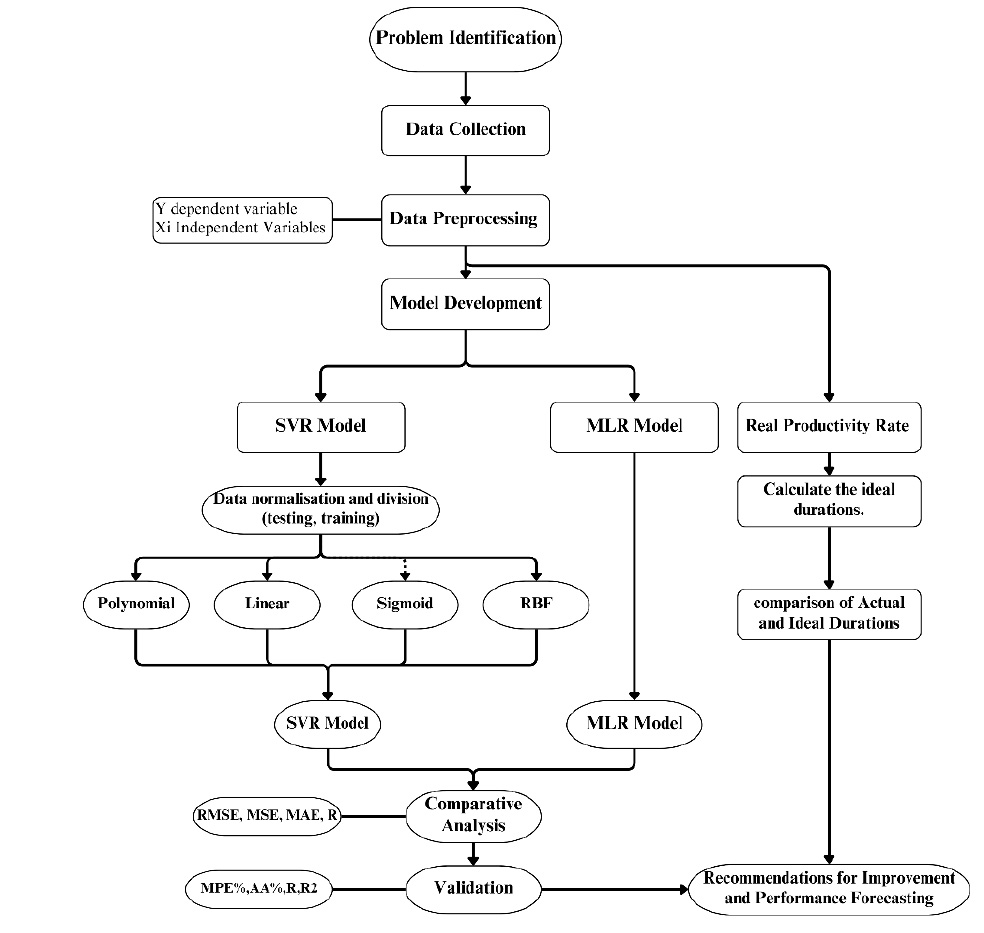
The study included different stages: problem identification, data collection, pre-processing, model construction, evaluation, comparison analysis, and improvement recommendations. Fig. (5) presents the research methodology.
4. RESULTS AND DISCUSSION
This section deals with the ideal performance according to the specialist as well as the results of applying two predictive models: Multiple Linear Regression (MLR) and Support Vector Regression (SVR), on data collected from nine horizontal housing projects implemented in Baghdad and central Iraq. The perfor-mance of the two models was evaluated using multiple statistical indicators including Mean Square Error (MSE), Root Mean Square Error (RMSE), Mean Absolute Error (MAE), Correlation Coefficient (R), and Coefficient of Determination (R2). The modelling method used 60 datasets, 60 for training and 7 for validation.
4.1. Ideal Performance Evaluation
Interviews with specialists in the residential construction field identified the productivity of the main structural work and the cost of each task. Table 4 shows the production rate of structural activities and the cost per quantity.
| Job | Team Member | IQD/Qty | Daily Productivity |
|---|---|---|---|
| Brickwork | 1 Skilled | 60,000/m3 | 3250 Brick/Day |
| 1 Assistance | |||
| 2 labours | |||
| Roof mold | 1 Skilled | 14,000/m2 | 25 m2/Day |
| 2 Assistance | |||
| Reinforcing work | 1 Skilled | 150,000/ton | 1.5 Ton/Day |
| 2 Assistance |
The table shows the team size for each activity and the IQD/Qty cost in the Iraqi dinar per quantity of work. The production rate helps to estimate the ideal duration of the main jobs.
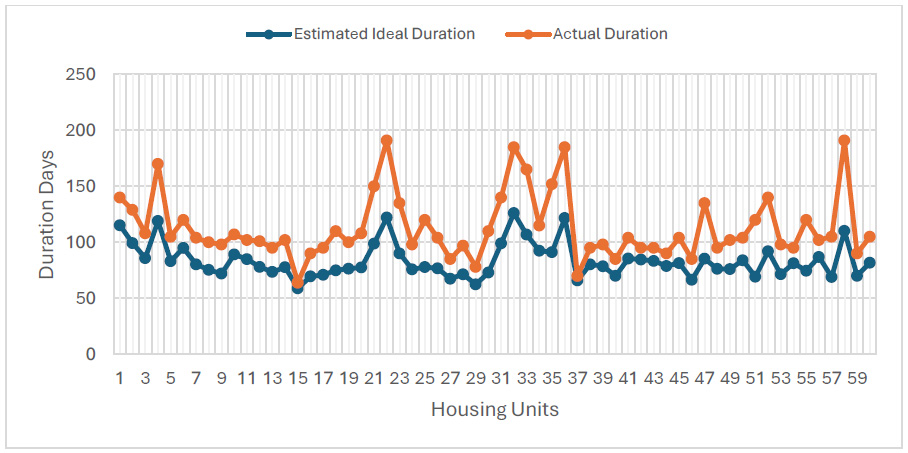
The ideal estimated duration required to complete the structure of each unit type is calculated and compared with the average actual duration. The average delay for all the datasets was 31 days. Fig. (6) shows the actual and estimated durations for each unit type.
| Metrics | SVR Model | MLR Model |
|---|---|---|
| MSE | 144.82 | 123.60 |
| RMSE | 12.03 | 11.12 |
| MAE | 8.82 | 8.31 |
| MPE | 1.29 | 0.8 |
| R | 0.910 | 0.923 |
| R2 | 0.828 | 0.852 |
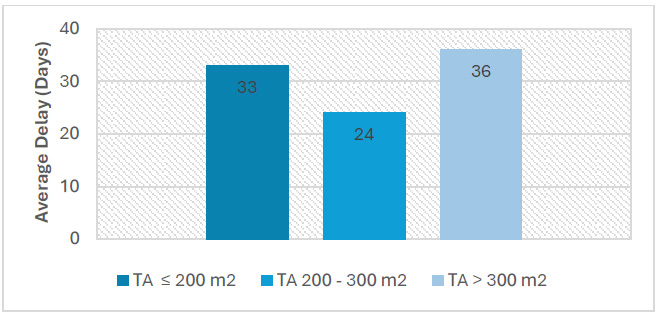
The figure above clearly shows the delay between the estimated and actual implementation in completing the housing unit structure. According to the information gathered from the interviewers, the quality and production rate decreased when the type of work agreement with the working team was daily wage work. This work method is followed in many mass housing projects and is one of the reasons for delays and poor performance in these projects [51]. Fig. (7) shows the average delay for each area.
It can be noted that the delay rate is the highest value for residential units with an area of more than 300 square meters and residential units with an area of 200 square meters or less, respectively, with 36- and 33-day delay rates. In contrast, the area between 200 and 250 m2 was lower than that in the previous categories. In other words, the rate of net area for the last-mentioned category (200-250) m2 has the lowest delay and built area rate compared to other area categories. These results indicate a positive relationship between buildability and project delays.
4.2. Development of Machine Learning Models
The two models were developed using SPSS and Orange Data Mining software. To evaluate them, a comparative analysis using statistical metrics was carried out. Table 5 lists the statistical metrics for each model.
The Mean Squared Error (MSE) determines the average of the squared errors and the average squared difference between the estimated and actual values. Lower numbers indicate smaller prediction errors and greater model performance [50]. MLR has a lower Mean Squared Error (MSE) of 123.60 compared to SVR's MSE of 144.82, indicating that MLR demonstrates superior predictive accuracy by making fewer prediction errors than SVR. The second parameter is the Mean Absolute Error (MAE), which assesses the average absolute value of the errors in each prediction model, regardless of their direction. Smaller values imply a higher performance [50]. The Mean Absolute Error (MAE) for MLR was 8.31, which was somewhat lower than the MAE of 8.82 SVR. This suggests that MLR has a reduced average prediction error compared to SVR. The correlation coefficient, denoted by R, measures the strength of the linear relationship between the expected and actual values. Values closer to 1 indicated a more pronounced linear correlation [52]. The MLR model had a higher R value (0.923) than SVR (0.910), indicating a more robust connection between the predicted and actual values for MLR. The modelling metrics results in Table 5 provide significant evidence of MLR's slightly better prediction performance than SVR in this study. Although the numerical differences may seem minor, they have important practical significance when used to plan construction projects. The superiority of the MLR model is directly related to the assumption of a linear relationship between the data. As explained in the research methodology, the relationships between the independent variables (e.g., total area TA, built-up area BA, number of rooms NOR, amount of bricks QBW...) and the dependent variable (execution time) were assumed to be linear relationships based on practical engineering logic.
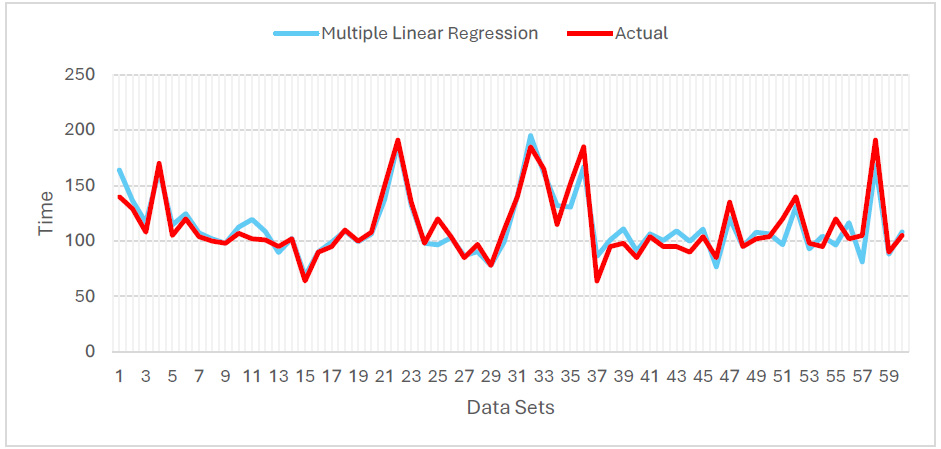
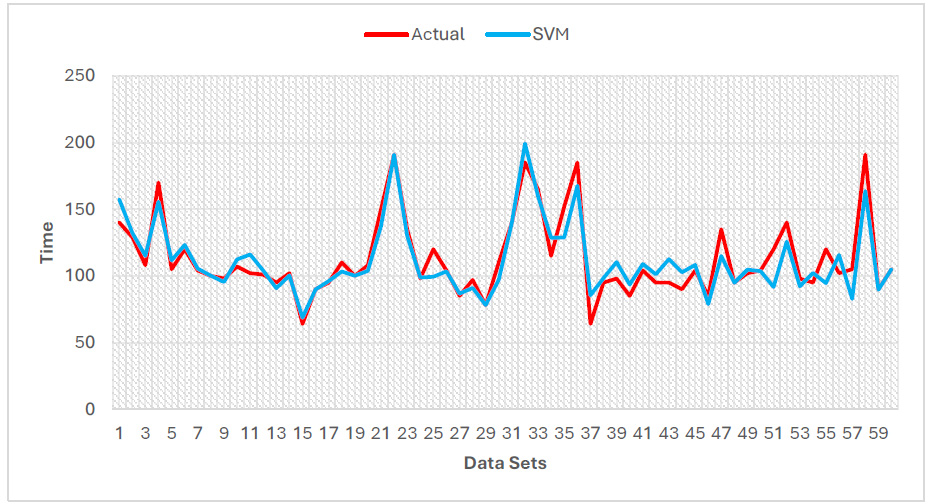
As shown in Figs. (8 and 9) below, the values of Y predicted by the MLR model and the actual Y were close. This shape demonstrates the accuracy of the prediction model and visualizes the results. The two figures juxtapose the actual time values against the predictions generated by the SVR and MLR models. Both models exhibit commendable predictive accuracy; however, the MLR model displays a marginal superiority in some instances, as it aligns more closely with the actual values than SVR model at junctures.
The significance value of MLR in the analysis of variance ANOVA and Model Summary tables was 0.00, which provides evidence that the Multiple Linear Regression model is statistically significant. This indicates that the model is valid and that the independent variables substantially influence the prediction of the dependent variable.
Mathematical representations of MLR can be extracted from the coefficient table, as shown in Equation 8.
| Y (T)predicted= -1943 + 0.0943TA – 0.106BA – 4.387NOR + 33.203BR + 0.72QCW +0.49QBW +3.955NBWT | (8) |
The mathematical representation of SVR is illustrated in equation 9.
| Y (T)predicted= 8.7178 - 0.0286TA + 0.0668BA – 2.492NOR + 0.365BR + 0.668CWQ +0.453BWQ +0.8031NBWT | (9) |
where time (Y), total area (TA), built area (BA), number of rooms (NOR), built ratio (BR), concrete work quantity (QWC), brickwork quantity (BWQ), and number of brickwork teams (NBWT).
| Data Set | Y Actual | Y Predicted by MLR | Y Predicted by SVR |
|---|---|---|---|
| 1 | 108 | 117 | 115 |
| 2 | 101 | 109 | 104 |
| 3 | 105 | 108 | 105 |
| 4 | 152 | 130 | 129 |
| 5 | 90 | 100 | 103 |
| 6 | 85 | 77 | 75 |
| 7 | 191 | 169 | 164 |
4.2.1. Model Validation
Seven datasets were used to validate the model accuracy. Table 6 shows the actual and predicted values using MLR and SVR models.
The value of the R correlation coefficient, 0.93, indicates a very strong relationship between the predicted and actual values and shows the accuracy of the developed MLR model. A Mean Percentage Error (MPE) of 0.66% indicates that the model's predictions are, on average, quite accurate in percentage values, showing a high level of accuracy. An AA% of 9.42% indicates that the average absolute error is below 10%, deemed satisfactory for several practical applications.
The study's results illustrate the prospective economic advantage of using a learning machine model to forecast structural productivity in housing projects. Enhancing planning precision and diminishing delays enables the models to reduce project expenses via optimized downtime substantially. Accurate time forecasts enable prompt material purchase and an effective workforce, immediately decreasing labour and material waste costs. The consequences for Iraq's housing industry are notably substantial since minimizing delays in construction projects may more effectively mitigate the acute deficiency of residential units.
4.3. Analysing Variables Significant
The coefficients of the MLR model were analysed to determine the influence of each independent variable on the dependent variable. It was found that total area (TA) and quantity of brickwork (QBW) have the greatest impact on project execution time, followed by built area (BA) and number of rooms (NOR). This is consistent with the field reality in horizontal housing projects, where increasing the area and internal complexity leads to more labour and time. Coefficients with negative or near-zero values were also reviewed and found to be statistically insignificant, reinforcing the model's consistency and realism.
From a practical point of view, the proposed model can be used to support time planning decisions for construction projects, optimise resource allocation, and reduce the probability of delays, which is critical in projects with poor time and logistics estimation.
5. PERFORMANCE IMPROVEMENT
Studying production rates is an important step in continuing to develop any industry and meet population needs. With the escalation in population, industries must improve their performance and increase production rates [53]. Enhancing the CP is important for reducing construction time and decreasing project costs [41]. The significant delay in the construction projects mentioned in this study, which averaged 31 days, indicated a performance issue. Researchers have suggested several recommendations to improve the performance and production rates, as follows:
1- To ensure that the work teams perform optimally, the agreement method is adopted according to the quantities of structural work completed, and working teams are stopped from being hired according to daily wages.
2- Sufficient supervision is provided to ensure that the work is implemented according to the specifications and requirements and within the schedule [54].
3- Traditional concrete curing techniques were used according to the project reports. The time required to resume construction and ensure that the concrete has sufficient strength is five days for the foundation and seven to six days for each slab. Because of this advanced concrete curing technique, it is recommended to shorten the duration, such as steam curing [55]. Additionally, the use of accelerating admixtures leads to faster concrete setting and removal of the forms [56].
4- Changing working hours to prevent the maximum temperature effect on the production rate, especially in summer when the temperature sometimes exceeds 50 °C [57], as most projects start working at 7 a.m. It is recommended that working hours start at 5 a.m. when there is daylight [58].
5- Different building units are used in this study. The current used was a clay brick (24 mm × 12 mm × 8 mm). The recommended units are clay brick (40 × 20 × 20 mm); this brick dimension will decrease the time required to build the walls, where a single-line wall will be sufficient to handle the load as a bearing wall with a thickness of 20 cm. In addition, this type of brick has a more porous interior, which provides more thermal isolation. In addition, the joint will decrease, reducing the required finishing efforts.
6- Adopting skid and tunnel forms in mass projects will save time and costs [59].
The suggestions for minimizing delays in building projects, including optimizing resource allocation, increasing team efficiency, and using sophisticated predictive models such as MLR and SVR, provide significant economic advantages. Optimizing resource allocation may reduce superfluous expenditures on labour and commodities, resulting in substantial cost reductions. Enhancing team productivity reduces idle time and increases job efficiency, decreasing project overheads. Using predictive models allows for accurate planning, reducing the risks of expensive delays and enhancing budget management. The precise economic effect of each piece of advice may differ depending on project size and context; nonetheless, their collective implementation might significantly enhance construction performance, reduce project costs, and optimize profitability. Subsequent research might further quantify these effects to provide more definitive economic rationales for their adoption.
6. LIMITATIONS AND FUTURE WORK
This study has some limitations that are important to highlight to ensure scientific transparency. Firstly, it focused on horizontal housing projects implemented in Baghdad and the central regions of Iraq, which may limit the generalisation of the findings to other projects that differ in terms of location, type of construction, or implementation method. Second, the analysis was restricted to data from only 60 housing units, concentrating on the structural sections without addressing other phases of the project, such as finishes or services. Only linear predictive models (MLR and SVR with a linear algorithm) were employed, which is suitable for the nature of the data considered in this study. However, they may not be the best choice in cases of non-linear relationships or larger, more diverse datasets.
In light of these points, this study recommends that future research expand the database to encompass different types of projects and regions and explore more advanced machine learning models, such as XGBoost or neural networks (ANN), to enhance predictive capability. It is also advisable to utilise cross-validation techniques to improve the reliability of the models and generalise the results more broadly.
CONCLUSION
This study aimed to provide a suitable and accurate forecasting tool to predict the performance of housing units in residential projects and measure the delay in construction projects, especially the activities related to the structure of landed housing projects. A comparative analysis was carried out to evaluate two ML techniques, SVR and MLR, to determine their respective abilities in forecasting the productivity of residential building projects. The results indicate that MLR demonstrated marginally superior prediction accuracy compared to SVR across many metrics: MLR exhibited a decreased Mean Squared Error (MSE) and Mean Absolute Error (MAE) compared to SVR, suggesting fewer prediction errors. The MLR analysis yielded higher values for the correlation coefficient (R) and coefficient of determination (R2), indicating a more robust linear connection and a more accurate model fit. The value of P was 0.00 in the table summary of the MLR analysis of variance (ANOVA); this finding indicates that the independent variables strongly affect the prediction of the dependent variable, which supports the accuracy of the developed model when the assumption there is a linear relationship between the variables.
The statistical metrics (Table 5) clearly show that the Multiple Linear Regression (MLR) model exhibits better predictive accuracy than the Support Vector Regression (SVR) model, as evidenced by lower MSE (123.60 vs. 144.82), RMSE (11.12 vs. 12.03), and MAE (8.31 vs. 8.82), as well as a higher correlation coefficient (R=0.923 vs. 0.910) and coefficient of determination (R2=0.852 vs. 0.828). The mathematical representations (Equations 8 and 9) further emphasise the differences in how variables influence the predicted duration. Specifically, the MLR model coefficients provide clear interpretability under the assumed linear relationships, directly aligning with our research assumptions and thus substantiating the superior performance of MLR for linear modelling observed.
This study provides a vision for specialists in the field of construction, especially housing projects, regarding the duration and performance of the structural activities of housing units. The developed model will assist stakeholders and project planners in estimating the duration required to finish the structural tasks and, thus, the cost and working teams required. Because improvement is an important requirement for housing projects, research recommendations will help reduce delays and poor performance. The study contributes to improving the performance of certain activities in housing projects, leading to improved performance in the projects and thus in the industry, which helps to complete projects quickly and provide the housing units required owing to the high population growth.
AUTHORS’ CONTRIBUTIONS
It is hereby acknowledged that all authors have accepted responsibility for the manuscript's content and consented to its submission. They have meticulously reviewed all results and unanimously approved the final version of the manuscript.
LIST OF ABBREVIATIONS
| QBW | = Quantity Brickwork |
| TA | = Total Area |
| NOR | = Number Rooms |
| BA | = Built Area |
| MAE | = Mean Absolute Error |
| MLR | = Multiple Linear Regression |
| SVR | = Support Vector Regression |
| RMSE | = Root Mean Square Error |
| CP | = Construction Productivity |
| NB | = Naive Bayes |
| DES | = Discrete Event Simulation |
| CBR | = Case-Based Reasoning |
| MIC | = Modular Integrated Construction |
| GWO | = Grey Wolf Optimizer |
| LPS | = Last Planner System |
| KNN | = k-Nearest Neighbour |
| DL | = Deep Learning |
| DT | = Decision Tree |
| BT | = Boosting Trees |
| KPIs | = Key Performance Indicators |
AVAILABILITY OF DATA AND MATERIALS
The data supporting the findings of this article are not publicly available due to confidentiality agreements and institutional restrictions. However, the corresponding author [F.G] may make summary data available upon reasonable request.
ACKNOWLEDGEMENTS
I sincerely thank the University of Technology, Baghdad, for helping me provide data for this study. In addition, thanks to the project managers and stakeholders who helped me obtain important data and reports. Additionally, I am grateful for the invaluable guidance provided by the experts who supported this research.

