All published articles of this journal are available on ScienceDirect.

Mechanical and Behavioral Properties of Boubyan Clay Mixed with Styrofoam
Abstract
Introduction
This research investigated the effects of incorporating Styrofoam grains (Expanded Polystyrene, EPS) into Boubyan clay (Kuwait) to develop a lightweight, sustainable geotechnical material.
Materials and Methods
The soil was classified as CL (lean clay) based on the Unified Soil Classification System (USCS). Samples were mixed with 0%, 10%, 15%, 20%, and 25% Styrofoam (2–5 mm grains) by volume. Standard Proctor compaction tests were used to determine maximum dry unit weights and optimum moisture contents. consolidation tests measured swelling pressures and displacements. Coefficients of volume compressibility (m_v) and consolidation (c_v) were calculated. Finally, consolidated-undrained triaxial tests assessed shear strength parameters (cohesion C′ and friction angle φ′).
Results
The addition of EPS reduced the maximum dry unit weight and increased the optimum water content. Swelling pressures and displacements decreased with higher EPS content; m_v and c_v both declined, indicating reduced compressibility and slower consolidation. Void ratios decreased, while final settlements and strains increased with Styrofoam. Triaxial tests showed a decrease in cohesion (C′) and an increase in friction angle (φ′) as the Styrofoam content increased, resulting in lower maximum shear and normal stresses.
Discussion
Introducing EPS into Boubyan clay improved its strength-to-weight ratio by reducing compressibility and slowing consolidation, though at the expense of increased settlements and reduced cohesion. These trade-offs suggest an optimal EPS content (around 10–15%) and point to future work, such as adding bonding agents (e.g., cement), to mitigate strength losses.
Conclusion
Integrating Styrofoam grains into Boubyan clay offers a viable method for producing a lightweight additive by reducing compressibility, aiding densification, and modifying strength parameters for specialized civil engineering applications.
1. INTRODUCTION
Boubyan Island, the largest island in Kuwait, poses significant challenges for infrastructure development due to its thick and soft clay layer, which exhibits poor mechanical properties characterized by high compres-sibility, large settlements, and low bearing capacity. To address these challenges and foster the island’s development as a commercial and industrial center, ground improvement techniques are essential. Extensive research has been conducted on enhancing clayey soils through the incorporation of various stabilizing materials [1-9]. Recent advancements in civil engineering materials research have explored nano-modified concrete and AI-based prediction models for material behavior [10, 11], highlighting the ongoing search for innovative and sustainable solutions. In parallel, Expanded Polystyrene (EPS) has emerged as a promising stabilizer for soft soils due to its lightweight nature and mechanical performance, particularly in regions like Boubyan Island, where traditional ground improvement is challenging. Styrofoam (C8H8) is a polystyrene foam in which plastic is made from [12]. Polystyrene (C8H8)n can be used in many types and forms. Polystyrene can be solid, liquid, or foamed. Types of polystyrene include General Purpose Polystyrene (GPPS), High Impact Polystyrene (HIPS), Polystyrene foam, and Expanded Polystyrene (EPS) foam [13]. Styrofoam is widely used for packaging fast food, fruit, coffee cups, and electronics. The reason for its popularity is its low cost and good mechanical properties. This means that very large amounts of Styrofoam waste are accumulated every day, which will cause environmental problems. All polystyrene plastics are lightweight, easy to produce, easy to mold, resistant to water, stable, and insulate heat [13]. Styrofoam is a material that is “difficult to be destroyed and broken down by the environment,” which makes it a dangerous material to the environment since it contains formaldehyde and benzene, which can be harmful to animals and fish if the waste Styrofoam powder ends up in the ocean, for example [14]. In addition, landfills are filled with Styrofoam, and it is expected to stay there for several years. Moreover, a large percentage of Styrofoam waste ends up in the sea, and it stays there since it is not biodegradable, and it is chemically stable [15-19]. Besides, Polystyrene plastics are plentifully found in wastewater streams of Kuwait [16]. Additionally, Styrofoam is environmentally friendly if it is used in construction or buried in the ground, as it does not emit harmful gases when placed in the ground, and there is no possibility of any chemical changes that may produce harmful materials [20]. Styrofoam has been widely used in civil engineering for various purposes throughout the years. For example, Styrofoam was used as a filling material in road embankments by the Norwegian Public Road Authorities in 1972 [21]. In addition, Styrofoam blocks were successfully used on an unstable road embankment in Italy, Passo del Brattello, back in 2001 [22]. Furthermore, Styrofoam blocks were effectively used as a bridge support for a high road embankment on poor soil in Italy, Savio 2002, and then also used as a filling material for a motorway road embankment in Italy, Rome 2004 [23]. Previous studies confirm the stabilizing role of EPS in soils. For instance, it was reported that mixing EPS with expansive soils significantly reduced swelling pressures and strains, with reductions exceeding 60% at higher EPS contents [9]. Additionally, another study demonstrated that EPS inclusion reduced vertical and lateral swelling pressures by up to 47% and 76%, respectively [23]. Furthermore, another study observed decreases in cohesion but improvements in the friction angle of marine clay stabilized with EPS. Cohesion values dropped from 65 to 10 kPa after adding 0.85% Styrofoam, while the friction angle was reduced from 13 to 25 degrees [24-26]. While EPS has been studied as a stabilizer in soft clays in various international contexts, the unique geotechnical characteristics of Boubyan clay warrant dedicated investigation. Boubyan clay is a high-plasticity marine clay with low shear strength, high natural water content, and high compressibility, all of which differ significantly from other soft clays like kaolinite or bentonite. Additionally, the presence of sulfate and chloride ions in Boubyan clay due to its coastal origin may influence the physical and chemical interaction with lightweight synthetic materials such as EPS. Therefore, generalizations from other soft clays are insufficient to predict the performance of EPS-modified Boubyan clay. This study seeks to address this gap by evaluating whether EPS can reduce swelling pressure and compressibility while maintaining or enhancing strength in the distinct conditions of Boubyan Island.
2. MATERIALS AND METHODS
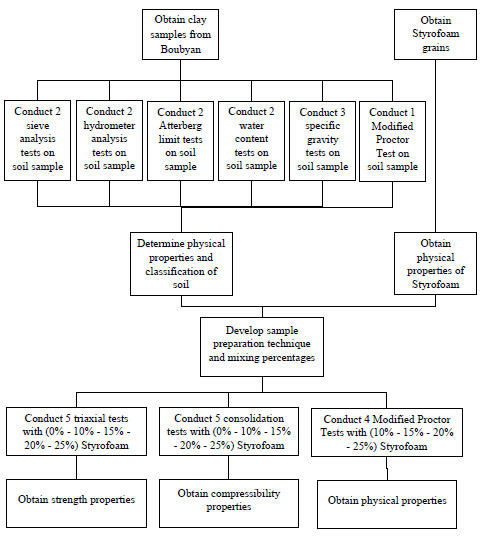
The first step of this study is collecting soil samples from Boubyan Island. Next, Styrofoam was selected as the stabilizing material because it is light in weight, easy to produce, easy to mold, resistant to water, stable, insulates heat, and most importantly, it is highly compressible [9, 11, 21]. Moreover, Styrofoam is available in large quantities in Kuwait, especially waste from local coffee shops, restaurants, and supermarkets. Since it is proven that the smaller the density of the Styrofoam material, the larger the reduction of swelling pressure [9, 21], Styrofoam grains, which have a nominal density of 12 kg/m3 (which is the smallest Styrofoam density in the ASTM C-578 Standard) and diameters of 3-5 mm, were selected for this study. The Styrofoam samples were obtained from a local Polystyrene insulation materials factory. The next step is to obtain the physical properties of the soil samples by conducting sieve analysis, hydrometer, Atterberg limits, water content tests, specific gravity, and Modified Proctor Tests. The soil can then be classified according to the results of the mentioned tests and based on the Unified Soil Classification System (USCS). Whereas the physical properties of the Styrofoam grains are obtained from the manufacturer. After that, a suitable sample preparation and mixing technique is developed. It was proven that increasing the area replacement percentage of Styrofoam decreases the swelling potential [9]. In addition, it was concluded that the optimum results were obtained with samples that used a Styrofoam layer with a thickness of 1/5 of the soil sample (which is 20% of the volume of the layer) [21]. Therefore, moist soil samples in this study will be mixed with Styrofoam grains at five different percentages by volume (0%, 10%, 15%, 20%, and 25%). The mentioned percentages are of the total volume of the mold. Styrofoam was mixed by volume because of its very light weight, which makes it difficult to weigh accurately. Following that, compaction tests (Modified Proctor Tests) are carried out on the samples with the mentioned percentages to determine the physical properties (the optimum water contents and maximum dry unit weight). Furthermore, the strength parameters of samples (prepared with the optimum water contents found from the compaction tests) will be obtained through triaxial tests. Finally, the compressibility properties of the soil sample are obtained from consolidation tests. Compressibility properties include swelling displacement, vertical strain, coefficient of consolidation, and coefficient of volume compressibility. Those properties obtained from triaxial tests include internal friction angle, cohesion, maximum shear, and normal stress. The summary of the testing schedule for this study is provided in Table 1. In addition, Fig. (1) summarizes the proposed methodology.
| - | Number of Tests | Procedure | Purpose of Test |
|---|---|---|---|
| Sieve Analysis Tests | 2 | ASTM D-6913 | Obtain physical properties |
| Specific Gravity Tests |
3 | ASTM D-854 | Obtain physical properties |
| Hydrometer Analysis Tests |
2 | ASTM D-7928 | Obtain physical properties |
| Atterberg Limits Tests |
2 | ASTM D-4318 | Obtain physical properties |
| Water Content Tests |
2 | ASTM D-2216 | Obtain physical properties |
| Modified Proctor Tests |
5 | ASTM D-1557 | Obtain physical properties |
| Triaxial Tests | 5 | ASTM D-4767 | Obtain strength properties |
| Consolidation Tests | 5 | ASTM D-2435 | Obtain compressibility properties |
Methodology.
2.1. Material Characterization
2.1.1. Physical Properties of Styrofoam
The physical properties of the Styrofoam grains were obtained from a local Polystyrene insulation materials manufacturer called Isofoam. The 12 kg/m3 Styrofoam, which is known as type XI in the ASTM-C578 Standard, was used in this study. Table 2 shows the summary of these properties as provided by the manufacturer.
| Type | XI |
|---|---|
| Standard | ASTM C-578 |
| Density (kg/m3) | 12 |
| Shape | Grains (balls) |
| Grain Diameter (mm) | 2-5 |
| Thermal Resistance of 1 inch (k.m2/W) | 0.55 |
| Compressive Strength at 10% Strain (kPa) | 35 |
| Flexural Strength (kPa) | 70 |
| Water Vapor Permeance of 1 inch, perm max | 5 |
| Water Absorption by Total Immersion, Volume % Max | 4 |
| Dimension Stability % Max | 2 |
2.1.2. Physical Properties of Soil
Approximately 100kg of soil was collected from the Boubyan island (latitude: 29.834247°, longitude: 48.259089°). The soil was carefully collected at a depth of 30 cm using a shovel and sealed in plastic bags. The soil was then transported to the Kuwait University soil mechanics laboratory and Sematco soil and engineering material testing laboratory. For the physical properties tests, each test is carried out twice on the collected soil specimen. In addition, three specific gravity tests were conducted. The soil’s physical properties are determined from the physical laboratory tests mentioned in the methodology, and the soil can be classified based on the results of these tests following the Unified Soil Classification System (USCS) as per ASTM D2487. The particle size distribution curve, obtained from the two sieve analyses and hydrometer tests, is presented in Fig. (2). Since fine contents are more than 50%, the average plasticity index is larger than 7, and plots above the A-line, the soil is classified as lean clay (CL). The summary of the average values of the physical properties is presented in Table 3.
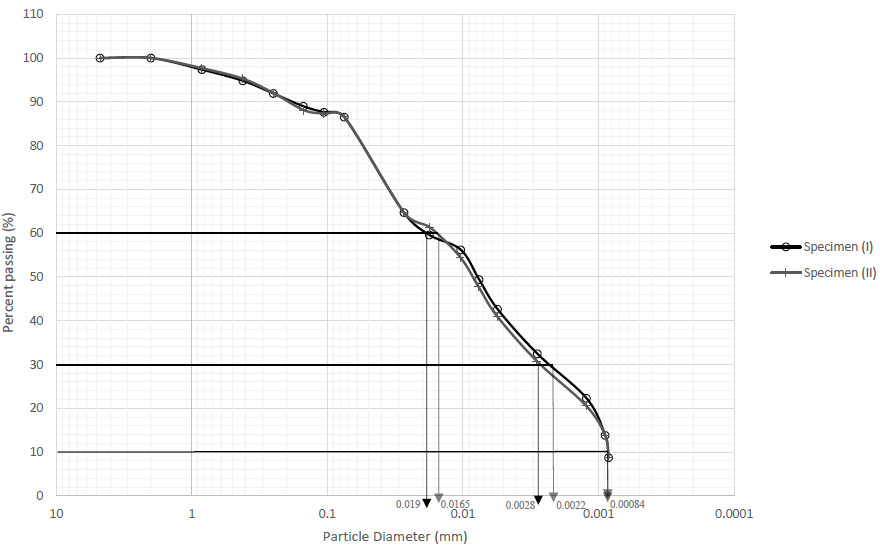
Particle size distribution curve.
Table 3.
| W (%) | Cu | Cc | L.L (%) | P.L (%) | P.I (%) |
γd(m ax) (kN/ m3) |
Wopt (%) |
Soil Classif ication |
|---|---|---|---|---|---|---|---|---|
| 19.94 | 21.1 | 0.434 | 44.36 | 23.02 | 21.35 | 17.9 | 15 | CL |
2.2. Sample Preparation
The clay is first mechanically pulverized. Styrofoam grains are soaked in water and then added to the dry powdered soil. The soil is then mixed by hand, and water is added gradually until a visually uniform and homogeneous mix is obtained. A uniform mix was obtained before reaching saturation at water contents ranging from 14% to 16%. With increasing Styrofoam content, the amount of water needed for a homogeneous mix increases. The homogeneity of the mix was checked by weighing an equal volume of soil from different parts of the mix. The densities of the parts that were weighed were very similar, which means that the mix can be considered a homogeneous and uniform mix. The mix also proved to be easily repeatable, as similar densities were obtained when the same mixing process with the same amounts of soil and Styrofoam was repeated. For example, in the first mixing process, four different parts of the 10% Styrofoam mix at a water content of 13% were placed in a 40 ml cylinder, and the weight was recorded to calculate the densities. The densities were found to be 1.172, 1.141, 1.094, and 1.190 g/cm3. The smallest percentage similarity in this mix is 91.93%. When mixing with more water (16%), an even more uniform mix was observed. The densities of different parts of the mix were even more similar (1.092, 1.115, 1.087, 1.130) g/cm3. The smallest percentage of similarity for this mix is 96.2%.
2.2.1. Modified Proctor Test Sample Preparation
The soil is mixed with four different Styrofoam contents by volume (10, 15, 20, and 25%). The mentioned contents are of the total volume of the mix. For instance, in the mix with the 10% Styrofoam, for every 100 cubic centimeters, 10 cubic centimeters of Styrofoam grains and 90 cubic centimeters of soil are mixed. For the proctor test, a total of nine 500ml measuring cups were filled with soil, and one cup was filled with Styrofoam. After that, the soil is divided into five equal trays. Approximately 1.8 cups (of the 500ml cups) of soil are poured into each empty tray. Next, the Styrofoam cup is emptied into smaller cups, and the cups are divided equally into the five trays after soaking them underwater. Water is added gradually into each tray, and the Styrofoam is mixed with the soil and water until a uniform mix is obtained.
Each tray is then emptied into a plastic bag and sealed. Finally, the proctor test is conducted, and for each layer, soil from the different bags is used. For instance, the soil is taken from the first plastic bag and poured into the mold for compaction. After reaching 25 blows, soil from the second bag is poured into the mold, and so on. This is done to ensure that each compacted layer contains the same Styrofoam content. After the first proctor test (for the initial water content), the soil is removed from the mold and placed in a larger tray, and all the soil from the bags is mixed with the rest of the mix. Water is added and mixed with the Styrofoam-Soil mix. Note that after the first compaction and addition of water, the mix becomes more uniform and homogeneous. The same process is repeated until the density decreases.
2.2.2. Triaxial and Consolidation Tests Sample Preparation
The soil is mixed with the Styrofoam grains at the four mentioned percentages at maximum dry unit weights and optimum water contents (determined from the proctor tests). First, dry pulverized soil is prepared for mixing with Styrofoam grains at the different percentages previously mentioned. 1000g of each Styrofoam-soil mix will be mixed with the optimum water content of each mix. Thereafter, the amount of water needed to reach the optimum water content is determined. This is done by weighing the amount of water needed to reach the optimum water content. For example, for the 10% Styrofoam mix, the optimum water content was found to be 15.4%. So, 15.4% of the 1000g is equal to 154g of water. So, approximately 154g (slightly more) of water is weighed and mixed with the Styrofoam-soil mix. The same process is done for all other mixes. The uniformity of the mix was checked by weighing different parts of each mix in 40ml cups. Water contents are also taken for each mix. Finally, the Styrofoam-soil mixes are compacted in a small compaction mold until at least 90% of the maximum dry densities (from the proctor tests) are reached. For the consolidation tests, the specimen is compacted in three layers, each layer with 25 blows, inside the consolidation ring that will be placed in the consolidation apparatus. Similarly, the triaxial test specimens are placed in the 3.8 cm x 7.6 cm mold and compacted.
3. RESULTS AND DISCUSSION
3.1. Modified Proctor Test Results
The modified proctor tests are conducted on the Styrofoam-soil mixes as per ASTM D-1577. The maximum dry unit weights and optimum water contents are obtained from the water content vs unit weights curves determined from the proctor tests. Table 4 and Fig. (3) show the summary of all proctor tests conducted. It is observed that the maximum density decreases with increasing Styrofoam content, which was anticipated since Styrofoam is very light in weight. In addition, the optimum water content increases with increasing Styrofoam content. This trend is mechanistically explained by the fact that Styrofoam particles, being lightweight and hydrophobic, replace heavier soil grains, thus lowering the achievable dry density. At the same time, the porous and non-absorbent nature of Styrofoam leads to an apparent increase in optimum water demand, since more water is needed to lubricate the clay matrix around the Styrofoam particles.
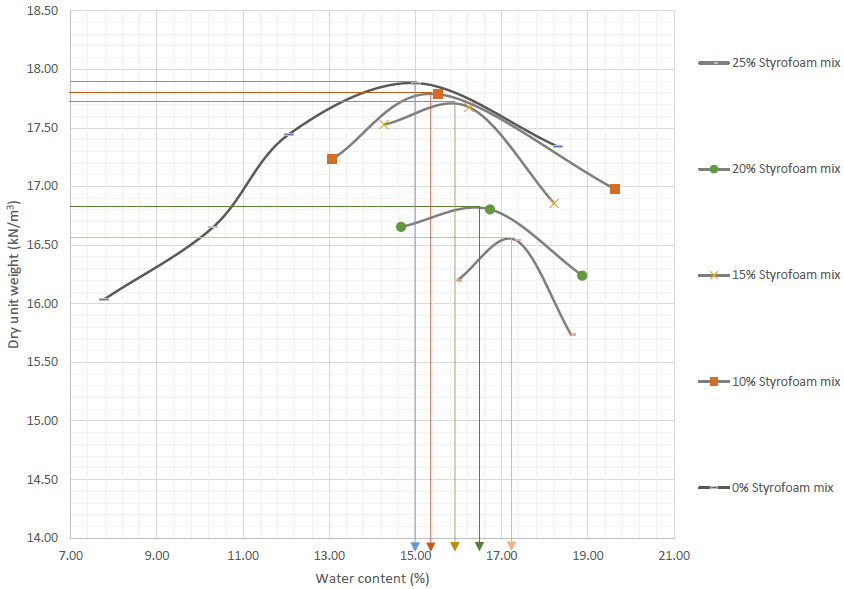
Optimum water content and maximum density curves for all styrofoam-soil mixes.
3.2. Consolidation Test Result
The consolidation tests are carried out on the five Styrofoam-soil mixes according to the ASTM D-2435 Standard. The soil specimens are prepared as per the sample preparation mentioned before. Next, the soil specimen ring is placed inside the consolidation cell. The physical information determined while preparing the sample, namely the mass of the specimen, the specific gravity of the specimen, the height of the ring, the diameter of the ring, and the weight of the empty ring, are plugged into a Data System Unit (DSU) of ELE International. First, the consolidation cell is filled with water, and the soil specimen is left to swell for 24 hours. The swelling results of each mix are shown in Table 5. It is observed that the swelling decreases as the Styrofoam content increases. After that, loads are applied carefully until the compression gauge is back to zero for each mix. Next, loads of 50, 100, and 200 kPa are applied to each mix. The DSU software calculates the weights that need to be applied to reach the loads based on the input data. After the end of the loading stages, unloading is carried out by reducing the load from 200 kPa to 100 kPa, and then from 100 kPa to 50 kPa. Finally, reloading is done until the load is back to 200 kPa. The specimens are then taken out of the rings, and the weights are recorded before and after drying. Note that the specific gravity used for the Styrofoam-soil mixes differs from each other depending on the Styrofoam content. Tables 6 and 7 shows the summary of the mv and cv values for the Styrofoam soil mixes at each loading stage for the purpose of comparison. In addition, the applied pressure vs. voids ratio curves is combined in Fig. (4). Finally, the final deformations (Hf), vertical strains (ϵ), and Coefficient of compression (cc) for each mix are shown in Table 8. All calculations are according to the ASTM Standard and Das Textbook [22, 23]. It is observed that the values of mv generally decrease with increasing Styrofoam content, as shown in Table 6 and Fig. (5). The decrease is observed starting from the 15% Styrofoam mix, as the value increased at 10% Styrofoam content. The mv value didn’t decrease in the 25% mix when compared to the 20%. Maximum reduction in mv was observed in the 20% and 25% mixes. This indicates that the addition of Styrofoam reduces the compressibility of the soil. In addition, from Table 7 and Fig. (5), it is clear that the value of cv also decreases as the Styrofoam content increases in the same trend as the mv, suggesting that the addition of Styrofoam reduces the rate of consolidation of the soil. Moreover, the swelling pressures and swelling displacements decrease with increasing Styrofoam content (as shown in Table 5 and Fig. (4), which is consistent with published findings [9]. Furthermore, according to the results shown in Table 8, the addition of Styrofoam increases the final settlement and the strain (ϵ) of the soil while having minimal influence on Cc. Finally, from (Fig. 4), it is apparent that the voids ratio decreases as the Styrofoam content increases, which implies a reduction in the volume of voids within the soil as the Styrofoam content increases. The voids ratio vs. applied pressure curve provides further evidence supporting the influence of Styrofoam content on the soil’s compressibility and consolidation characteristics. It reinforces the idea that the inclusion of Styrofoam leads to densification and decreased void ratios. Considering the decreasing values of cv, mv, and void ratios, along with the acceptable magnitude of settlement increase, it can be concluded that the addition of Styrofoam is likely beneficial for the compressibility characteristics of the soil. The reduced compressibility, slower consolidation, and densification of the soil indicate improved engineering properties and potential stability enhancements. This behavior can be explained by the intrusion of Styrofoam particles into the clay matrix, which disrupts the continuous soil structure. While Styrofoam reduces compressibility (lower mv), its low permeability slows drainage and consolidation (lower cv). Partial bead collapse and soil skeleton disturbance under stress further increase settlement despite the reduced compressibility parameters.
| Styrofoam Content (%) | Maximum dry Unit Weight (kN/m3) | Optimum Water Content (%) |
|---|---|---|
| 0 | 17.9 | 15 |
| 10 | 17.8 | 15.4 |
| 15 | 17.72 | 15.9 |
| 20 | 16.82 | 16.4 |
| 25 | 16.58 | 17.2 |
| Styrofoam Content (%) | Vertical Displacement (mm) |
|---|---|
| 0 | -0.504 |
| 10 | -0.491 |
| 15 | -0.446 |
| 20 | -0.298 |
| 25 | -0.212 |
| - | 0% Styrofoa m mix |
10% Styrofoa m mix |
15% Styrofoa m mix |
20% Styrofoa m mix |
25% Styrofoa m mix |
|---|---|---|---|---|---|
| Pressure (kPa) | mv (m2/MN) | mv (m2/MN) | mv (m2/MN) | mv (m2/MN) | mv (m2/MN) |
| 50 | 2.04 | 2.34 | 1.9 | 1.7 | 1.7 |
| 100 | 0.26 | 0.32 | 0.31 | 0.47 | 0.366 |
| 200 | 0.2 | 0.26 | 0.25 | 0.34 | 0.251 |
| 100 | 0.022 | 0.009 | 0.031 | 0.04 | 0.024 |
| 50 | 0.061 | 0.072 | 0.081 | 0.108 | 0.068 |
| 100 | 0.04 | 0.03 | 0.06 | 0.07 | 0.034 |
| 200 | 0.06 | 0.06 | 0.06 | 0.12 | 0.076 |
| - | 0% Styrofoam mix |
10% Styrofoam mix |
15% Styrofoam mix |
20% Styrofoam mix |
25% Styrofoam mix |
|---|---|---|---|---|---|
| Pressure (kPa) | cv (m2/yr) | cv (m2/yr) | cv (m2/yr) | cv (m2/yr) | cv (m2/yr) |
| 50 | 35.28 | 34.67 | 29.52 | 28.25 | 28.16 |
| 100 | 34.36 | 28.78 | 22.26 | 23.58 | 21.11 |
| 200 | 33.01 | 31.85 | 21.16 | 22.05 | 18.07 |
| 100 | 0 | 0 | 0 | 0 | 0 |
| 50 | 0 | 0 | 0 | 0 | 0 |
| 100 | 24.9 | 27 | 27 | 30 | 26 |
| 200 | 24.64 | 24 | 21.09 | 19.36 | 19.94 |
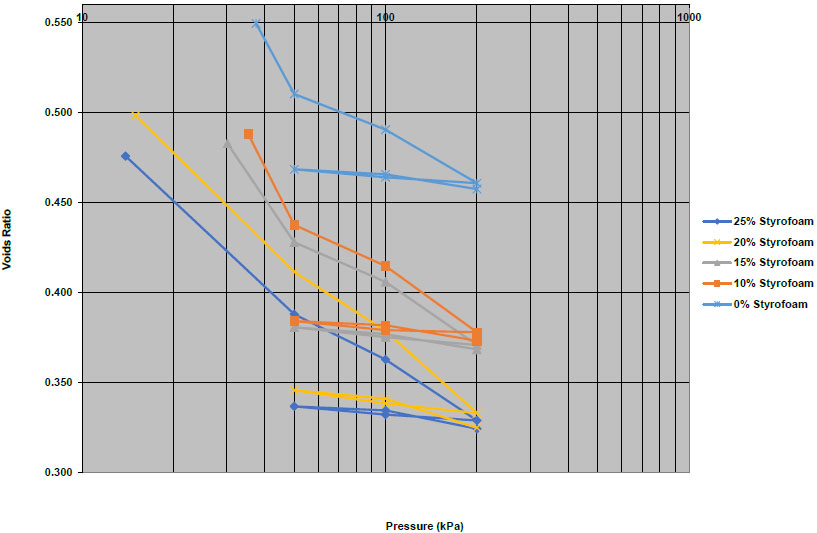
Applied pressure vs voids ratio curve for all styrofoam mixes.
| Styrofoam Content (%) |
0% | 10% | 15% | 20% | 25% |
|---|---|---|---|---|---|
| Hf (mm) | 1.188 | 1.543 | 1.544 | 2.315 | 2.052 |
| ϵ | 0.0594 | 0.0772 | 0.0772 | 0.1158 | 0.1026 |
| Cc | 0.0003 | 0.0004 | 0.0004 | 0.0005 | 0.0004 |
| Styrofoa m Conte nt (%) |
C’ (kPa) |
ϕ′ (o) |
τ′f f o r 5 0 kPa confini ng pressure (kPa) |
σ′f f o r 5 0 kPa confini ng pressure (kPa) |
τ′f for 100 kPa confini ng pressure (kPa) |
σ′f for 100 kPa confini ng pressure (kPa) |
|---|---|---|---|---|---|---|
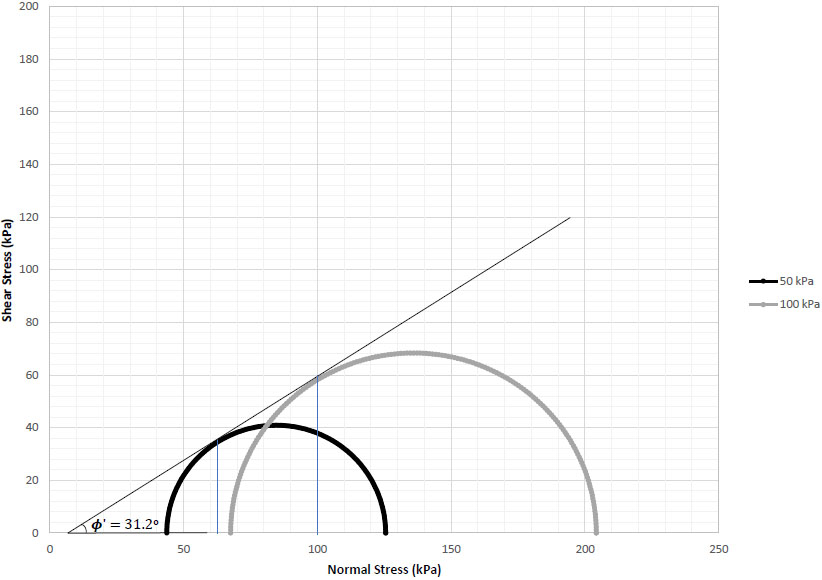
| 0 | 30 | 21.8 | 106 | 190 | 134 | 257 |
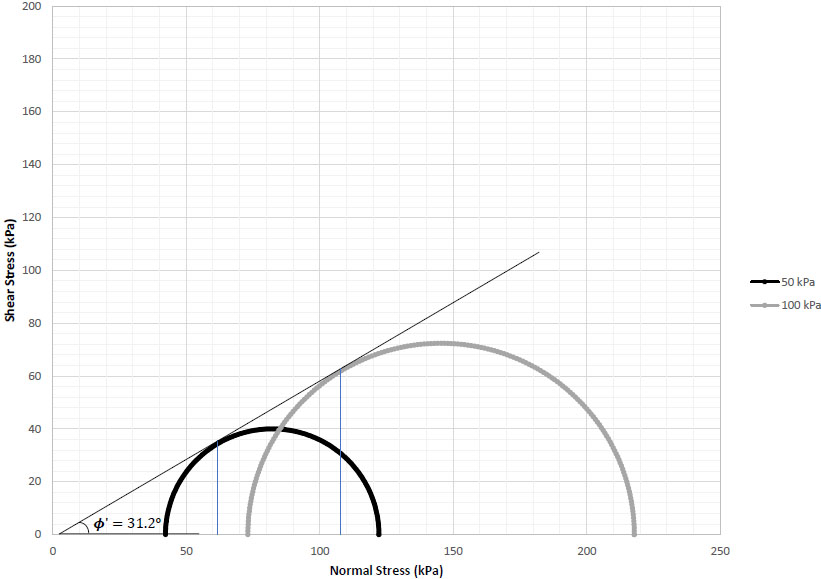
| 10 | 11 | 28.39 | 56 | 83 | 105 | 172 |
| 15 | 6 | 23.05 | 34 | 67 | 61 | 125 |
| 20 | 0 | 31.2 | 36 | 62 | 58 | 100 |
| 25 | 0 | 31.2 | 35 | 61 | 62 | 108 |
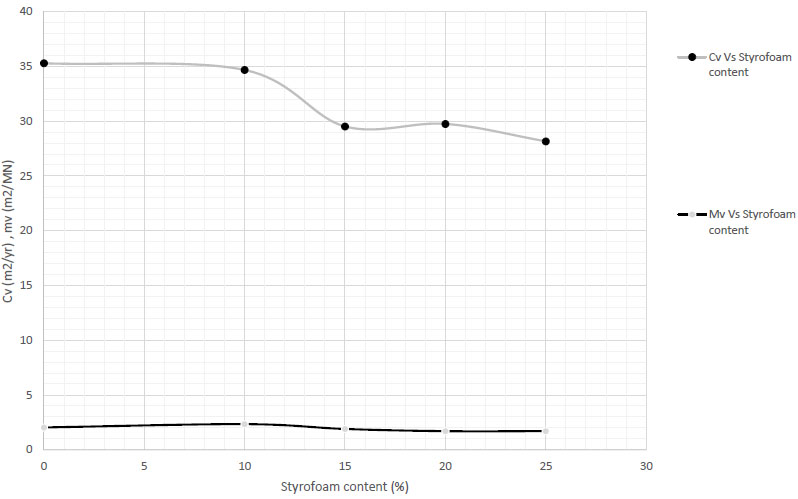
Maximum cv and mv values vs Styrofoam content.
3.3. Triaxial Test Results
Consolidated Undrained (CU) triaxial tests are carried out on the five Styrofoam-soil mixes according to ASTM D-4767. The samples were prepared as mentioned in the sample preparation section. First, the compacted soil specimen is covered by side drains of filter paper and then placed inside a rubber membrane. The soil specimen is then placed inside the triaxial cell and prepared for the saturation stage. The specimen is filled with water, and the zero readings of cell, back, and pore pressures are recorded. Back and cell pressures are then applied and increased until saturation is reached (until the B coefficient reaches 0.98). Next, the consolidation stage starts by applying a series of incremental vertical loads to the sample using the loading frame. The corresponding changes in axial and pore water pressure are recorded until 100% consolidation is reached. Finally, the shearing stage starts by maintaining the final consolidation pressure and applying an axial load to the sample to initiate shearing. The axial deformation, cell, back, and pore pressures are recorded. The shearing continues until failure is reached and the maximum shear strength is recorded. The readings are recorded with the help of an automatic traxial system (Matest TRIAXLAB), which uses live transducers to record readings at several increments of time for each stage. Each test is conducted twice, once with 50 kPa confining pressure and another time with 100 kPa confining pressure. The results were recorded in tables, which show the values of parameters that were calculated or recorded from the transducers. The values of the effective major and minor principal stress for both tests are used to draw the Mohr’s circles to determine the cohesion (C’) and friction angle (ϕ′). In addition, shear stresses at failure (τ′f) and normal stresses at failure (σ′f) for both confining pressures are determined, which are the values at the intersection with the failure envelope. (Figs. 6-10) show the Mohr’s circles of all Styrofoam-soil mixes. Table 9 shows a summary of Cohesion, friction angle, failure shear, and normal stress results for all mixes. All calculations were done using the necessary equations as per ASTM D-4767. As shown in Table 9 and Fig. (11), the cohesion of the soil (C’) decreases significantly with increasing Styrofoam content. On the other hand, the friction angle (ϕ’) increases with increasing Styrofoam content. This aligns with available findings [24]. However, a decrease was observed in the friction angle after the addition of 15% Styrofoam. Moreover, as demonstrated in Fig. (12), the maximum shear and normal stress notably decreased upon the addition of 10% and 15% Styrofoam. After that, the values don’t decrease or increase in a noteworthy manner. In conclusion, mixing Styrofoam with clay decreases the cohesion, shear, and normal stresses, which likely indicates that Styrofoam is a non-cohesive material. When Styrofoam is mixed with clay, the particles disrupt the clay fabric and weaken interparticle bonding, leading to reduced cohesion. At the same time, the irregular shape and rough surface of Styrofoam increase interparticle friction, contributing to higher friction angles. However, at 15% EPS, the excessive particle content causes discontinuities in the soil matrix, resulting in a non-monotonic friction angle response. It should be noted that while the study identifies consistent trends across compaction, consolidation, and triaxial results, no statistical significance tests were performed, so these trends should be interpreted with caution.
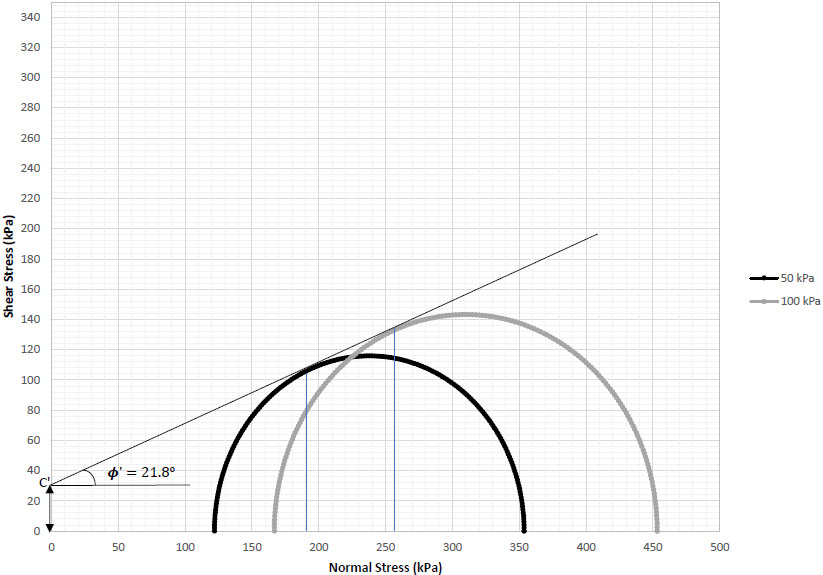
Mohr’s-circle for 0% styrofoam mix.
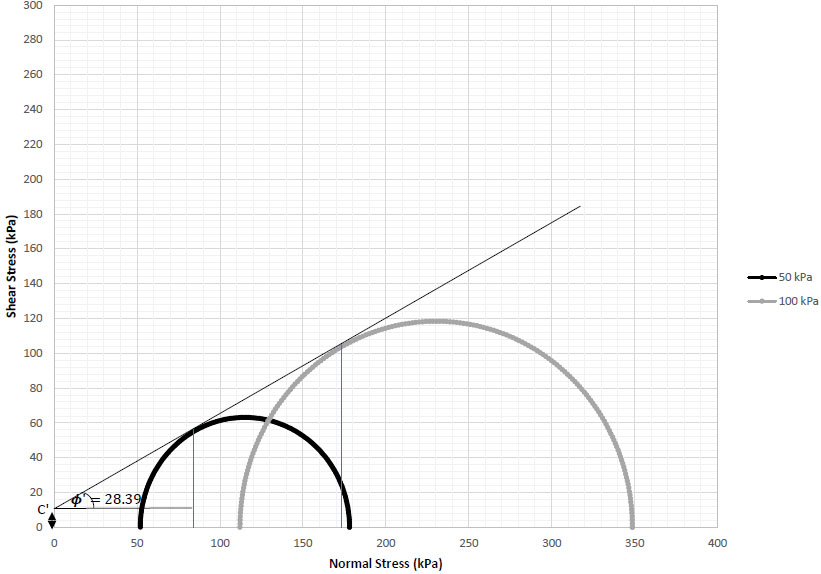
Mohr’s-circle for 10% styrofoam mix.
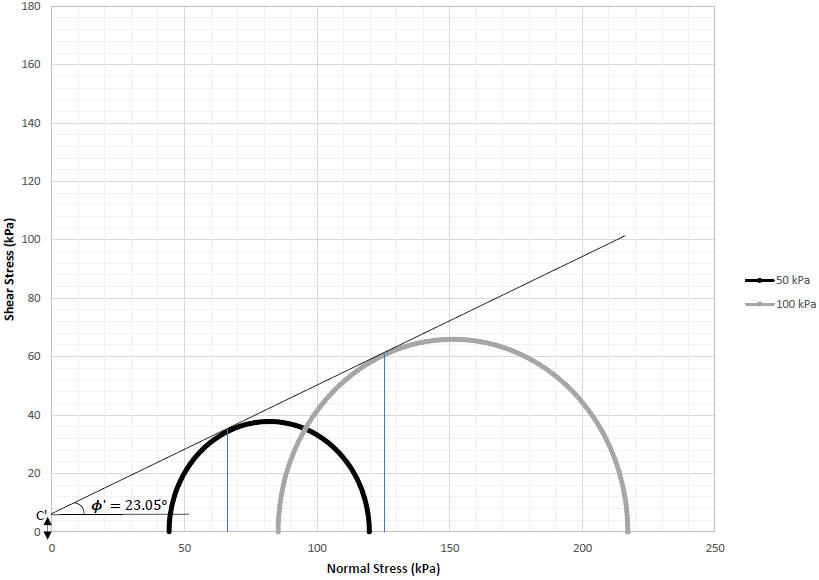
Mohr’s-circle for 15% styrofoam mix.
Mohr’s-circle for 20% styrofoam mix.
Mohr’s-circle for 25% styrofoam mix.
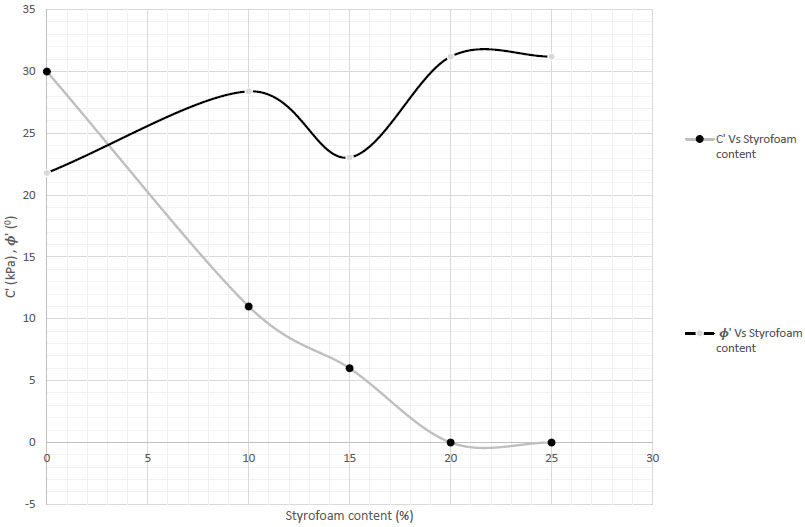
Cohesion & friction- angle vs styrofoam content.
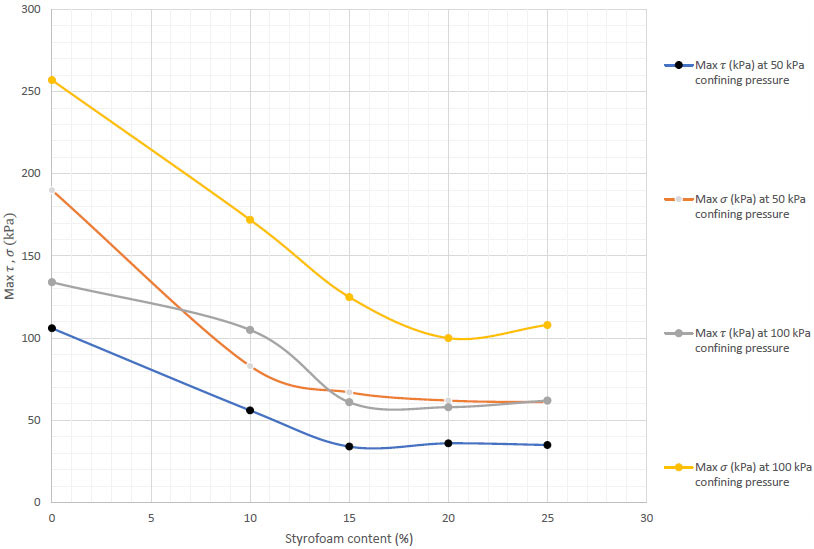
Failure normal stress and failure shear stress vs styrofoam content.
CONCLUSION
Based on the observations and results presented, the following conclusions can be drawn. The addition of Styrofoam to the soil mixture leads to a decrease in maximum dry density and an increase in optimum water content. This is expected due to the lightweight nature of Styrofoam. Moreover, the coefficient of volume compressibility (mv) values generally decrease with increasing Styrofoam content, indicating a reduction in the compressibility of the soil. The most significant reduction in mv is observed in the 20% and 25% Styrofoam mixes. In addition, the coefficient of consolidation (cv) also decreases with increasing Styrofoam content, suggesting a slower rate of consolidation for the soil. This is consistent with the published findings [9]. Swelling pressures and swelling displacements decrease with increasing Styrofoam content, further supporting the influence of Styrofoam on the compressibility behavior of the soil. The voids ratio decreases as the Styrofoam content increases, indicating densification and a reduction in the volume of voids within the soil. On the other hand, the addition of Styrofoam increases the final settlement and strain (ϵ) of the soil. However, this increase is considered acceptable given the significant improvements in other engineering properties. Ultimately, the cohesion of the soil (C’) decreases significantly with increasing Styrofoam content, while the friction angle (ϕ’) increases. These trends are in agreement with the available findings [24]. The maximum shear and normal stresses show a notable decrease with the addition of 10% and 15% Styrofoam, but further increases in Styrofoam content do not significantly affect these values. In conclusion, adding Styrofoam to the soil has several positive effects on the soil’s compressibility characteristics. It leads to reduced compressibility, slower consolidation, densification, and decreased void ratios. However, the final settlements increased as the Styrofoam content increased. The reduction in cohesion and increase in the friction angle suggest that Styrofoam weakens the cohesive bonds in the soil. Based on the laboratory results, an EPS content of approximately 10% appears optimal for Boubyan clay, providing a balance between reducing density and maintaining acceptable shear strength, whereas higher percentages (≥20%) result in excessive cohesion loss and significant strength reduction. It is also important to note that field-scale applications may be influenced by long-term factors such as creep, durability, and potential EPS degradation under load and environmental exposure. Future studies could explore the potential benefits of adding a bonding material, such as cement, to further enhance the soil’s properties.
AUTHORS’ CONTRIBUTIONS
The authors confirm contribution to the paper as follows: study conception and design: JB, WE; data collection: JB; analysis and interpretation of results: JB, WE; draft manuscript preparation: JB. All authors reviewed the results and approved the final version of the manuscript.
LIST OF ABBREVIATIONS
| ASTM | = American Society for Testing and Materials |
| Cc | = Compression index |
| C’ | = Effective cohesion (kPa) |
| cv | = Coefficient of consolidation (m2/year) |
| DSU | = Data System Unit (used in consolidation testing) |
| ELE | = ELE International (equipment manufacturer for soil testing) |
| EPS | = Expanded Polystyrene (Styrofoam) |
| GPPS | = General Purpose Polystyrene |
| Hf | = Final vertical deformation (mm) |
| HIPS | = High Impact Polystyrene |
| σ′f | = Normal stress at failure (kPa) |
| τ′f | = Shear stress at failure (kPa) |
| USCS | = Unified Soil Classification System |
| ϕ′ | = Effective friction angle (degrees) |
| ϵ | = Vertical strain (dimensionless) |
| γd | = Maximum dry unit weight (kN/m3) |
| Wopt | = Optimum water content (%) |
AVAILABILITY OF DATA AND MATERIALS
The data supporting the findings of this study are available from the corresponding author, [J.B] upon reasonable request.
FUNDING
This study was supported by the College of Graduate Studies (CGS), Kuwait University, as part of the author’s postgraduate thesis. No external funding was received.
ACKNOWLEDGEMENTS
Many thanks to the College of Graduate Studies (CGS) of Kuwait University for funding this research project. Deepest appreciation to Kuwait University and the Soil and Engineering Material Testing Laboratory (Sematco) for allowing the use of the laboratories and necessary equipment for this research.

