All published articles of this journal are available on ScienceDirect.

Numerical Investigation of Soil–pipeline Interaction Effects on the Seismic and Surface Load Responses

Abstract
Introduction
Pipelines are among the main systems for conveying fluids over long distances and are typically installed below ground level along most of their alignment. These systems are widely employed for transporting water, petroleum, natural gas, and other fluids, as well as for serving as utility corridors. During seismic events, buried pipelines may experience both transient and permanent ground deformations.
Methods
In this study, the influence of key parameters-including pipe wall thickness, burial depth, and soil type-on the behavior of underground pipelines subjected to surface loading and earthquake waves was investigated using PLAXIS 2D. Three pipe diameters and various burial depths were analyzed in both homogeneous and composite soil layers to evaluate pipeline crown displacement.
Results
The results show that pipe displacement tends to increase with larger pipe diameters and greater burial depths under various soil conditions and wall thicknesses. Pipelines installed in loose sand demonstrated higher seismic sensitivity compared to those embedded in clay soils, where lower displacement values were observed. Increasing the pipe wall thickness, and consequently its stiffness, resulted in a noticeable reduction in displacement. Additionally, the crown displacement was found to rise with increasing surface loads and pipe diameters, especially at shallow embedment depths. Furthermore, pipelines placed in composite soil exhibited improved performance, with reduced displacements compared to those in uniform soil layers.
Discussion
The observed behavior indicates that both geometric properties, such as diameter and thickness, and geotechnical conditions, such as soil type and layering, play critical roles in controlling pipeline response under seismic and surface loading. The improved performance in composite soils suggests that soil stratification can enhance system stability, while loose sand conditions amplify seismic effects due to lower stiffness.
Conclusion
The findings of this study provide quantitative relationships that can help explain how burial depth, pipe geometry, and soil conditions influence pipeline displacement under different loading scenarios.
1. INTRODUCTION
Earthquakes are dynamic rupture events that occur when accumulated elastic strain energy in surrounding rock masses is suddenly released [1] and have profound effects on both the environment and society, resulting in significant loss of life and property damage [2-4]. Thrust faulting, typically characterized by shallow dip angles of about 5°–30° [5], commonly occurs at plate boundaries where tectonic motion leads to the buildup of elastic strain that is eventually released through complex slip behavior [6]. In contrast, strike-slip earthquakes are associated with near-vertical faults (70°–90°) or transform plate boundaries and transfer zones. Normal faulting, on the other hand, forms in extensional settings such as rift zones and is generally defined by moderate dip angles of approximately 45°–65°. A pipeline is a hollow cylindrical conduit with a circular cross-section, typically constructed from materials such as steel or plastic, and designed for conveying fluids, solids, or multiphase mixtures comprising both fluid and solid components [7]. These pipelines are typically installed within geohazard areas and are consequently highly influenced by severe ground conditions [8]. With the rapid expansion of oil and gas pipeline networks and the growing reliance of national economies on them, demand for safe, reliable, and secure pipeline operations has increased significantly [9, 10]. Over the past decades, considerable research efforts have been devoted to investigating the complex response of buried pipelines subjected to ground deformation induced by phenomena such as landslides, earthquakes, fault movements, and uplift forces [11-15], particularly through various numerical modeling studies [16]. Scawthorn, Miyajima, Ono, Kiyono, and Hamada [17] reported that the immediate impact of seismic events on wastewater pipeline systems contributed to approximately 12% of the total recorded damage. Their findings indicated that unplasticized polyvinyl chloride (UPVC) and steel pipelines experienced greater damage than ductile iron and cast iron pipes. Furthermore, a number of experimental studies have examined the response of buried high-density polyethylene (HDPE) pipelines subjected to strike-slip faulting. Vazouras, Karamanos, and Dakoulas [18] investigated the behavior of buried steel pipelines crossing active strike-slip faults, in which the pipeline intersects a vertical fault plane at inclination angles between 0° and 45°, resulting in considerable plastic deformation of the pipeline structure.
A review of existing analytical solutions for estimating peak forces on pipes or strip anchors reveals significant variations in the calculated maximum dimensionless forces, especially under deep embedment conditions [19]. Wu, Yu, Shi, and Ma [20] investigated the interaction between large-diameter BSPS pipes and the surrounding saturated soil to assess pipe deformation and soil pressure responses. Their results indicated that pipe deformation increases with higher water content, while the soil pressure distribution evolves from a parabolic form to a double-hump pattern as the pipe diameter increases from 0.5 m to 5.0 m. Xie, Zhu, Tan, and Shukla [21] examined the effects of embedment ratio and horizontal spacing ratio on the failure mechanisms of pipeline systems using the material point method (MPM). They found that the bearing capacity of the pipe–soil system increases with increasing embedment depth and horizontal distance, while the influence of pipe–soil interaction becomes negligible when the horizontal distance ratio exceeds 3, or the embedment ratio reaches 4. In the present study, a numerical investigation is conducted to analyze the interaction between soil and steel pipelines, in which both soil and pipe properties are expected to significantly influence the response of buried pipelines. To enhance the understanding of pipeline behavior under combined static and dynamic loading, different oil and gas pipeline cases are considered. The analysis incorporates an earthquake load with magnitude 5.4 and duration 10 s, in addition to surface loading conditions of 50, 100, 150, and 200 kPa. The two-dimensional finite element software PLAXIS is employed for numerical simulation. Furthermore, several key parameters are examined, including soil type (clay, loose sand, and dense sand), soil stratification, burial depth, pipe diameter, and pipe wall thickness.
2. MATERIALS AND METHODS
The performance of buried natural oil and gas pipeline systems in seismic-prone regions is a critical engineering concern for utility operators, as system failure can pose significant risks to public safety and infrastructure. In this study, the soil–pipeline interaction system is numerically modeled using the finite element software PLAXIS 2D, which is capable of simulating pipeline displacements under loading conditions. This section examines the influence of various soil and pipeline parameters on the structural response of buried pipelines. The Upland earthquake (28/02/1990), with a magnitude of 5.4, is adopted as the seismic input motion. The Upland (1990, Mw 5.4) earthquake record was selected as a representative moderate-magnitude ground motion to evaluate the comparative response of buried pipelines under seismic loading. The objective of the study is to investigate the relative influence of soil and pipeline parameters under a consistent seismic input, rather than to assess the response to a wide range of earthquake scenarios. The selected pipe diameters (914 mm and 1060 mm) and wall thicknesses (6.35 mm, 9.53 mm, and 12.7 mm) correspond to commercially available API 5L X65 steel pipelines widely used in long-distance oil and gas transmission systems. These dimensions were adopted based on the specifications of the real Malkoclar–Ankara natural gas pipeline, ensuring that the numerical simulations represent practical engineering applications. The material properties of the soil and steel pipelines are summarized in Tables 1 and 2, respectively. Table 3 shows the dynamic parameters, while the numerical model representing the soil–pipeline system is illustrated in Fig. (1).
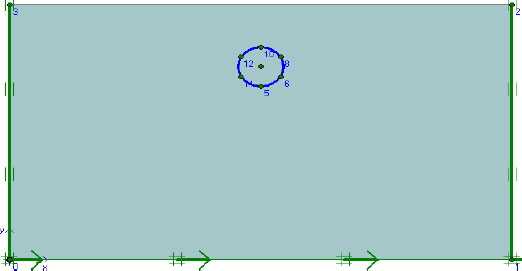
Numerical model of steel pipeline.
| Properties | Loose Sand | Clay |
|---|---|---|
| Unit weight (kN/m3) | 18.9 | 15 |
| Young modulus (kPa) | 25000 | 5000 |
| Poisson ratio | 0.3 | 0.35 |
| Cohesion (kPa) | 5 | 10 |
| Friction angle | 30 | 20 |
| Dilatancy angle | 0 | 0 |
| Diameter (mm) | Thickness (mm) | Young Modulus (GPa) | Poisson Ratio |
|---|---|---|---|
| 914 | 6.35 9.53 12.7 |
200 | 0.3 |
| 1060 | 6.35 9.53 12.7 |
| Parameters | Value |
|---|---|
| Damping ratio | 5% |
| Rayleigh mass coefficient | 0.12 |
| Rayleigh stiffness coefficient | 0.0016 |
| Reference frequency (low) | 1 |
| Reference frequency (high) | 10 |
| Angular frequency ω1 | 6.28 |
| Angular frequency ω2 | 62.83 |
The numerical model was analyzed under plane strain conditions with local mesh refinement around the pipeline to improve numerical accuracy. The soil domain was discretized using 15-node triangular elements, which provide higher-order interpolation and improved accuracy in predicting stresses and deformations compared with lower-order elements, particularly in geotechnical finite element analyses [22]. The soil surrounding the pipeline was simulated using the Mohr–Coulomb elastoplastic constitutive model. The Mohr–Coulomb constitutive model was adopted because it provides a simple and computationally efficient representation of soil behavior while requiring a limited number of readily obtainable engineering parameters. Owing to its simplicity and satisfactory accuracy, it has been widely used in finite element analyses of geotechnical problems, including soil–structure interaction under both static and dynamic loading conditions [23]. In PLAXIS 2D, the soil behavior was defined by several material parameters, including dry unit weight, Young's modulus, Poisson's ratio, cohesion, internal friction angle, and dilation angle. The soil domain was modeled with dimensions of 1200 mm × 600 mm. The model dimensions were selected to position the lateral and bottom boundaries sufficiently far from the pipeline, thereby minimizing boundary effects on the computed response, consistent with common practice in dynamic finite element analyses. The index and engineering properties of the soil used in the numerical analysis are presented in Table 4. Rayleigh damping with a damping ratio of 5% was adopted to represent material damping. Interface elements with an interaction factor of 0.75 were introduced between the pipe and the surrounding soil to simulate realistic pipe–soil interaction. The sand layer was analyzed under drained conditions, whereas the clay layer was modeled as undrained during the dynamic analysis. The seismic loading was applied at the base of the numerical model using the acceleration time history of the Upland earthquake (28 February 1990), with a time step of 0.002 s adopted for the dynamic analysis. The earthquake record was obtained from the USGS database and used as a prescribed horizontal base excitation throughout the full duration of the seismic event. The original earthquake record was used directly as the seismic input without modification of its frequency characteristics. Lysmer–Kuhlemeyer viscous (absorbing) boundaries were assigned to the lateral and bottom boundaries of the numerical model to effectively absorb outgoing seismic waves and minimize artificial wave reflections, while the ground surface was maintained as a free boundary, following the approach proposed by Lysmer and Kuhlemeyer [24]. The original acceleration record was used directly without amplitude scaling; therefore, its frequency content was preserved throughout the dynamic analysis. No additional baseline correction was applied because the original processed record obtained from the USGS database was used as the seismic input.
| Properties | Dense Sand | PVC Pipe | Netlongeogride |
|---|---|---|---|
| Dry unit weight (kN/m3) | 17 | - | - |
| Young modulus (kN/m2) | 19000 | 9.33×10⁵ | - |
| Poisson ratio | 0.3 | 0.31 | - |
| Friction angle | 42 | - | - |
| Dilation angle | 12 | - | - |
| Axial stiffness | - | - | 60 |
| Diameter (mm) | - | 200 | - |
| Thickness (mm) | - | 5 | - |
2.1. Validation of Numerical Modeling
The numerical model was validated against the experimental study conducted by Rajkumar and Ilamparuthi (2008), which investigated the behavior of a PVC pipe embedded in dense sand and subjected to various surface loading conditions [25]. The validation was performed using the two-dimensional finite element software PLAXIS 2D (2002). Two cases were considered. In the first case, the vertical crown deflection of the pipe under surface loads of 50, 100, and 150 kPa with a backfill cover depth of 400 mm was analyzed without geogrid reinforcement. In the second case, geogrid reinforcement was incorporated to reduce the effects of applied surface loads and improve pipe performance. The numerical models adopted for the unreinforced and geogrid-reinforced cases are illustrated in Figs. (2 and 3), respectively.
Figures 4 and 5 present the validation results for the backfill without and with geogrid reinforcement, respectively. The numerical predictions obtained from the finite element model are compared with the experimental results reported by Rajkumar and Ilamparuthi (2008). Furthermore, the modified experimental data are plotted to provide a comprehensive assessment of the proposed numerical model's accuracy.
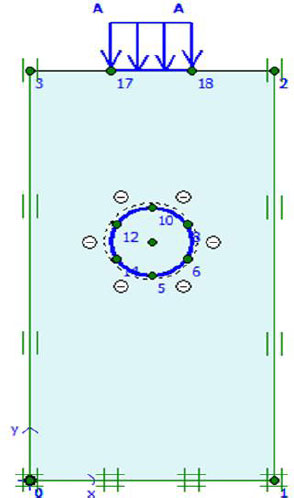
Numerical configuration of pipeline system without geogrid.
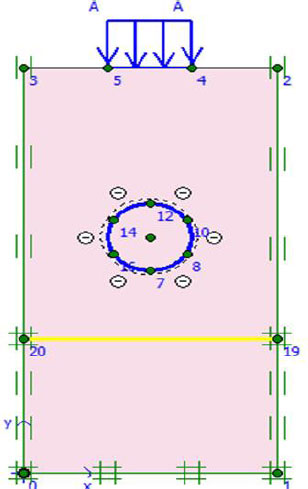
Numerical configuration of pipeline system with geogrid.
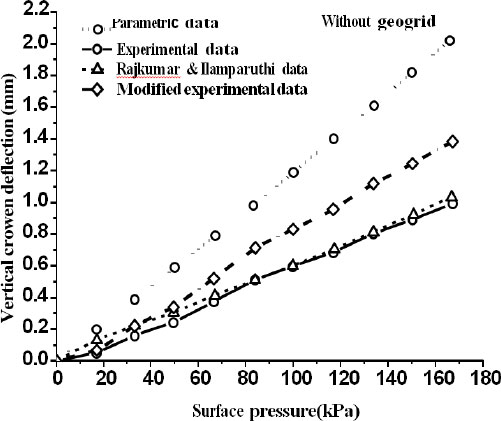
Numerical and experimental data for backfill without geogrid.
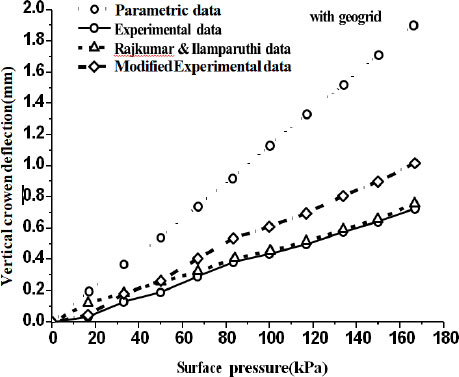
Numerical and experimental data for backfill with geogrid.
A comparison of the curves presented in Figs. (4 and 5) indicates that better agreement between the numerical and experimental results is achieved when the experimental data are multiplied by a factor of 1.4. In the original study by Rajkumar and Ilamparuthi (2008), the finite element results were adjusted by applying a reduction factor of 0.6 to the applied load, corresponding to the third dimension (0.6 m) of the experimental tank. However, since PLAXIS 2D performs plane strain analysis with an assumed unit thickness of 1.0 m, scaling the experimental results by a factor of 1.4, which accounts for the difference between the experimental model thickness (0.6 m) and the unit thickness adopted in the numerical model, provides a more consistent basis for comparison. Figures 6 and 7 illustrate the variation in pipeline displacement before and after the earthquake event, respectively. The blue colors indicate low displacement magnitudes, while small deformation patterns occur around the pipe under static or pre-seismic conditions. After the earthquake, the orange and red colors indicate larger displacements resulting from pipe shaking. The lateral spreading of seismic waves, characterized by a longitudinal deformation pattern, causes downslope ground movement due to non-liquefied soil–structure interaction. Seismic waves introduce axial and bending strains at pipe joints, and the observed failure mode is local buckling in compressive zones. During seismic loading, relative shear deformation develops between the pipeline and the surrounding soil, leading to pipeline deformation and potential damage. The resulting axial strains are influenced by the ground strain level, the wavelength of the propagating seismic waves, and the interaction forces at the pipe–soil interface.
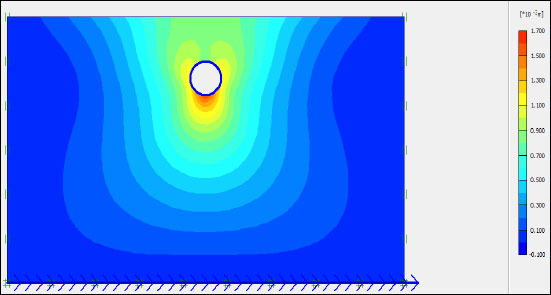
Pipe-soil displacements before earthquake.
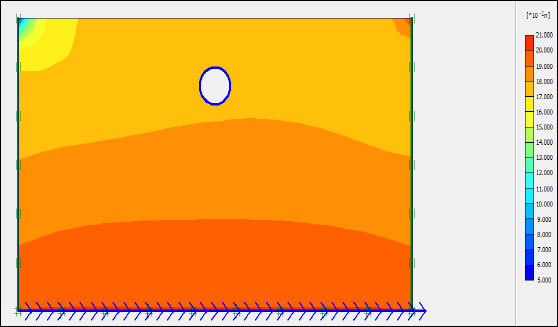
Pipe-soil displacements after earthquake.
3. RESULTS
3.1. Effect of Soil types and Pipe Depths
In this study, four burial depths are considered, namely 1.0 m, 1.5 m, 2.0 m, and 2.5 m. Figures 8–11 present the variation in pipe displacement with burial depth, while other parameters, including pipe diameters (914 mm and 1060 mm) and wall thicknesses (6.35 mm, 9.53 mm, and 12.7 mm), are held constant throughout the analysis.
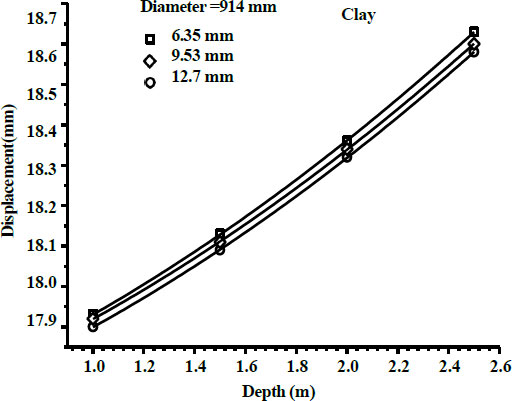
Effect of burial depth on pipe displacement of 914mm diameter for clay.
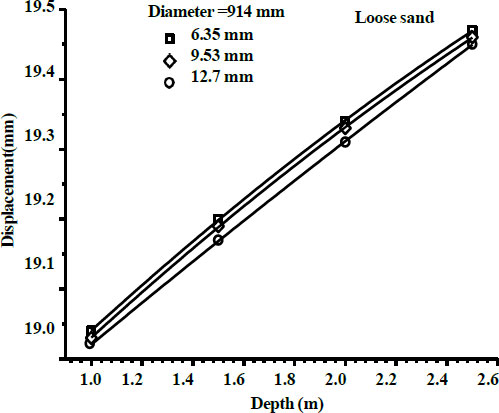
Effect of burial depth on pipe displacement of 914mm diameter for loose sand.
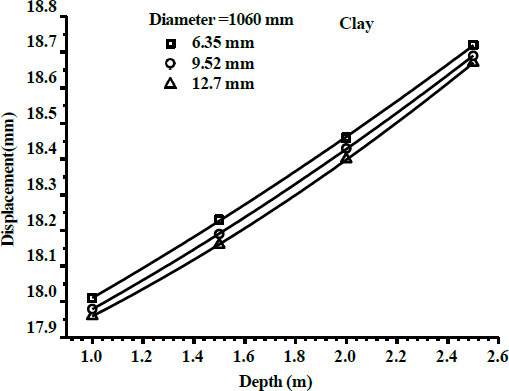
Effect of burial depth on pipe displacement of 1060mm diameter for clay.
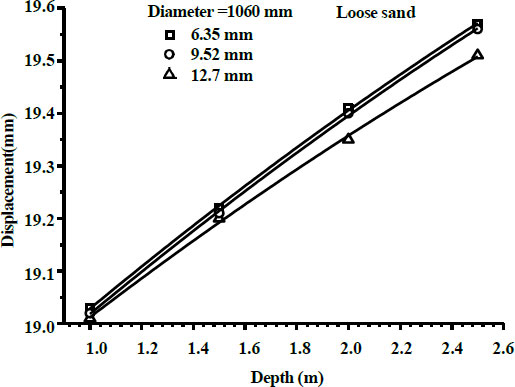
Effect of burial depth on pipe displacement of 1060mm diameter for loose.
3.2. Displacement of Oil Pipeline under Surface Load
The purpose of this section is to investigate the static behavior of buried pipelines subjected to surface loads of 50, 100, 150, and 200 kPa, using the Malkoçlar–Ankara Hattı steel gas pipeline as a case study. The finite element software PLAXIS 2D is employed to perform the present analyses, in which parametric studies are conducted to examine the effects of different soil conditions, pipeline properties, and burial depths. The analysis focuses on crown displacement, as this is generally the most critical response parameter affecting pipeline integrity. The geometry of the soil model is illustrated in Fig. (12).
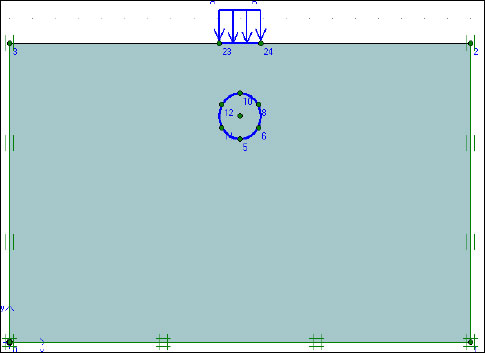
Schematic diagrams of soil-pipe system.
3.3. Influence of Soil Conditions, Pipe Diameter and Burial Depths
Using three different pipe diameters, each with three corresponding wall thicknesses, the effects of soil conditions -such as soil type and burial depth - were evaluated under surface loading, as shown in Fig. (13). The obtained results are illustrated in Figs. (14–16), corresponding respectively to the smallest, intermediate, and largest pipe diameters, each with its associated wall thicknesses.
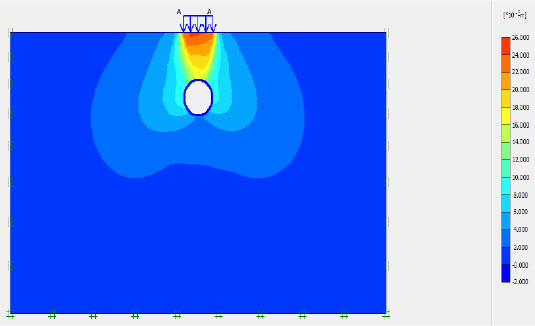
Values of limited load displacements over the pipe.
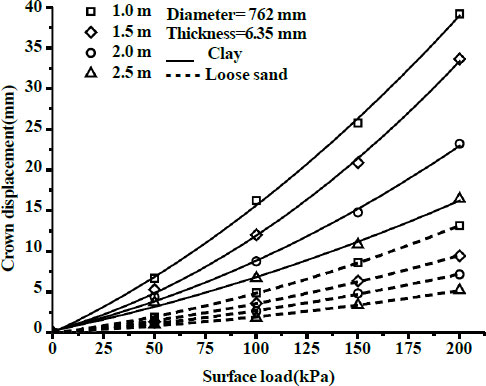
Displacement–load curves for D=762mm and t=6.35mm.
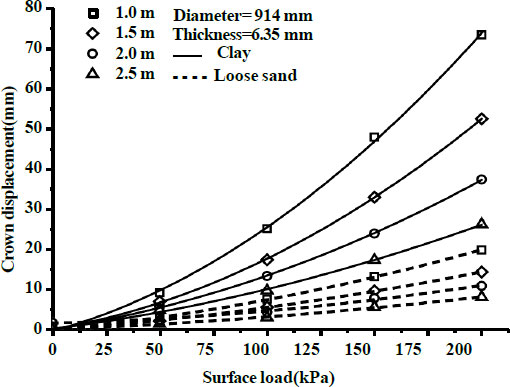
Displacement – load curves for D=914mm and t= 6.35mm.
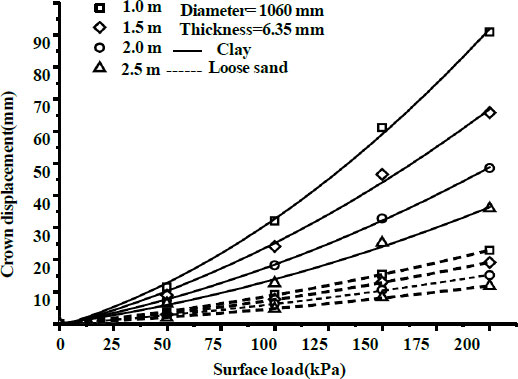
Displacement – load curves for D = 1060 mm and t = 6.35 mm.
3.4. Effect of Composite Soil Layers
This study aims to assess the influence of composite soil profiles on the behavior of soil–pipe interactions. Finite element analyses were conducted using the PLAXIS 2D software to determine the crown displacement of buried X65 steel pipelines subjected to a surface load of 200 kPa. The properties of the soil layers is presented in Table 5. The finite element geometries for the two-layer is shown in Fig. (17).
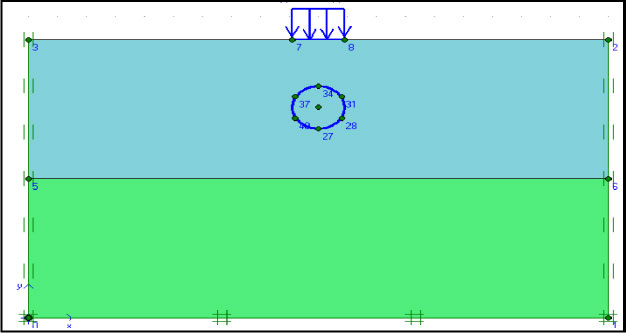
Geometric model for two soil layers.
| No. of Soil Layers | Type of Soil |
Unit Weight 
|
Young Modulus (kPa) | Poisson Ratio | Cohesion (kPa) | Friction Angle (°) |
|---|---|---|---|---|---|---|
| Two soil layers | Dense | 19.6 | 65000 | 0.35 | 5 | 30 |
| Clay | 15 | 5000 | 0.35 | 10 | 20 |
Figure 18 illustrates the representative configuration of a pipeline embedded within a two-layer soil system. Under static surface loading conditions, the influence of burial depth on the crown displacement of a steel pipeline is evaluated. The results are summarized in Figs. (19 and 20) for pipe diameters of 914 mm and 1060 mm, respectively. Both clay and dense sand soils are considered, each with a thickness of 3 m. Different burial depths (1.0, 1.5, 2.0, 2.5, and 3.5 m) were evaluated. A surface static pressure of 200 kPa was applied to the soil surface.
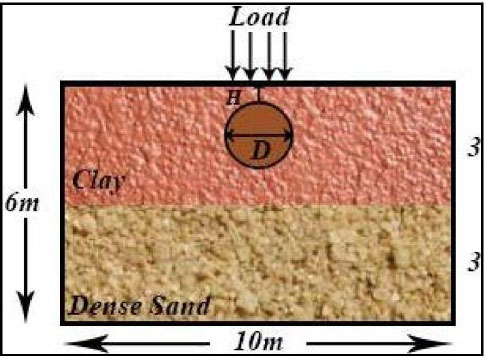
Typical geometry of pipeline in two soil layers.
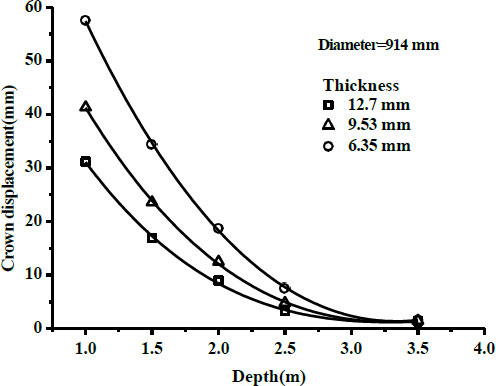
Displacement versus burial depth in two soil layers for D=914mm.
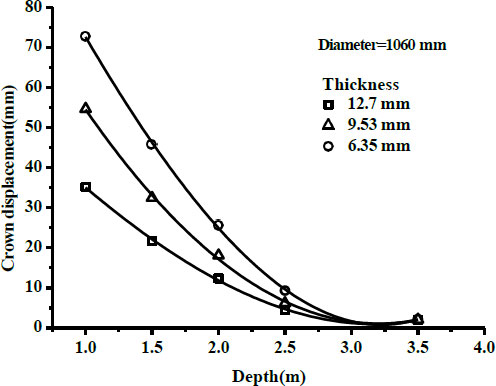
Displacement versus burial depth in two soil layers for D=1060mm.
4. DISCUSSION
Increasing the burial depth leads to an increase in horizontal pipe displacement for different pipe diameters, wall thicknesses, and soil types. This behavior can be attributed to the combined effects of seismic wave propagation and soil–pipe interaction. As the burial depth increases, the confining stress and the contact area between the pipe and the surrounding soil increase, resulting in stronger dynamic interaction and more efficient transmission of soil deformation to the pipeline. Consequently, the buried pipe follows the cyclic movement of the surrounding soil more closely, leading to larger horizontal displacements. It should be noted that the seismic response of buried pipelines is governed by the combined effects of wave propagation, soil stiffness, damping characteristics, and kinematic soil–pipe interaction. Therefore, the influence of burial depth is not universal and depends on the characteristics of the surrounding soil, the properties of the pipeline, and the characteristics of the applied ground motion.Because of their greater ability to deform and absorb seismic energy, pipelines installed at shallower depths generally exhibit better seismic performance. At different burial depths, pipe displacement increases with increasing pipe diameter because larger-diameter pipes experience greater kinematic interaction with the surrounding soil and exhibit lower structural stiffness, making them more susceptible to seismic-induced deformation. Although a larger contact area enhances soil–pipe interaction, it may not be sufficient to fully restrain seismic deformation due to stiffness incompatibility between the pipe and the surrounding soil. Smaller-diameter pipes experience lower seismic forces and benefit from more effective confinement by the surrounding soil, whereas for larger pipe diameters, displacement tends to stabilize as the pipe stiffness and inertial resistance approach their capacity to resist horizontal movement. The displacement decreases with increasing pipe wall thickness or overall pipe rigidity. For a given pipe diameter, the pipeline's ability to resist soil movement is directly proportional to its wall thickness.
For a fixed pipe diameter and wall thickness, pipelines embedded in loose sand exhibit greater seismic response than those installed in clay soils because loose sand undergoes larger shear deformation under cyclic loading. In contrast, clay soil generally exhibits more gradual deformation while maintaining higher confinement and damping, resulting in smaller horizontal displacements. The non-monotonic response observed in loose sand is attributed to the combined effects of soil stiffness, confinement, and soil–pipe interaction. Unlike clay, loose sand exhibits lower confinement and greater deformation under cyclic loading. Consequently, changes in burial depth do not necessarily produce a proportional increase in pipeline displacement, as the response depends on the balance between increased overburden confinement and the redistribution of dynamic soil deformation around the pipe. In general, an increase in crown displacement is clearly observed as surface load increases. The maximum crown displacement for a pipe with a diameter of 762 mm buried at a depth of 1.0 m is approximately 40 mm under a surface load of 200 kPa in clay soil, whereas it is about 14 mm in loose sand. Crown displacements are higher for larger diameters, reaching approximately 75 mm and 90 mm for pipe diameters of 914 mm and 1060 mm, respectively. In contrast, the corresponding displacements in loose sand are lower, at about 14 mm, 20 mm, and 23 mm for pipe diameters of 762 mm, 914 mm, and 1060 mm, respectively. The significantly larger crown displacement observed in clay than in loose sand is primarily attributed to the lower stiffness of the adopted clay model. As listed in Table 1, the Young's modulus of clay (5000 kPa) is considerably lower than that of loose sand (25000 kPa), resulting in a greater compressibility of the surrounding soil under vertical loading. Consequently, a larger proportion of the applied surface load is transferred to local soil deformation around the pipe, resulting in greater crown displacement. In contrast, the higher stiffness of loose sand provides more effective confinement and promotes wider stress distribution through the surrounding soil, thereby reducing the deformation transmitted to the pipeline. This behavior differs from the seismic response because static surface loading is governed primarily by soil compressibility and load transfer, whereas seismic loading is controlled by cyclic shear deformation and kinematic soil–pipe interaction.
As the pipe diameter increases, the pipe stiffness decreases, thereby reducing its resistance to deformation. Under surface loading, the pipe deflects and mobilizes passive soil resistance along its sides. Unlike seismic loading, increasing burial depth reduces pipeline displacement because the applied surface load is progressively diffused through the overlying soil before reaching the pipe. During lateral movement of the buried pipe, the surrounding soil develops distinct passive and active earth pressure zones. Passive resistance is mobilized in front of the moving pipe where the soil is compressed, while active conditions develop behind the pipe due to soil relaxation. This redistribution of earth pressures governs the lateral soil–pipe interaction and significantly influences the magnitude of pipe displacement and the overall system stiffness. The increase in overburden pressure enhances soil confinement and stiffness, thereby improving the load-bearing capacity of the surrounding soil and reducing the stresses transmitted to the pipe crown. Consequently, deeper burial provides greater structural protection against static surface loads. For the two-layer soil profile consisting of an upper clay layer overlying dense sand, the reduction in crown displacement is further enhanced by stress redistribution and load diffusion within the layered soil system. The overlying soil enhances load diffusion and confinement, which are mechanisms commonly associated with reduced stress transfer to the buried pipeline, thereby transferring a greater proportion of the applied load to the surrounding soil before it reaches the pipeline. As a result, the vertical stresses acting on the pipe crown are reduced, leading to smaller crown displacements than in the corresponding homogeneous soil profile. Significant reductions in displacement occur at burial depths of 1.0-2.5 m in clay soil. At depths of 1.0–1.5 m, the resistance to vertical displacement depends primarily on pipe stiffness rather than on the confinement provided by the surrounding soil. Increasing the wall thickness to 12.7 mm further improves pipe performance by reducing crown displacement. As burial depth increases, vertical stresses are increasingly redistributed within the surrounding soil, reducing the load acting directly on the pipe crown. The reduction in crown displacement becomes nearly constant at a burial depth of approximately 3.0 m because the surrounding soil confinement reaches a level at which further increases in burial depth provide only marginal improvements in stiffness and load redistribution. It should be noted that the present study focuses on the comparative displacement response of buried pipelines under different geometric and soil conditions. Therefore, the reported displacements should be interpreted as relative indicators of soil–pipe interaction rather than as direct measures of structural failure.
CONCLUSION
The numerical investigation of buried oil and gas pipelines subjected to seismic and surface loading using PLAXIS 2D demonstrates that burial depth, pipe geometry, and soil type play a governing role in controlling pipeline displacement. The results show that the effect of burial depth is strongly dependent on the loading condition. Under seismic excitation, increasing burial depth leads to higher horizontal displacements due to enhanced kinematic soil–pipe interaction and more efficient transmission of ground deformation to the pipeline. In contrast, under static surface loading, greater burial depth reduces crown displacement due to improved soil confinement and load diffusion. A near-constant response is observed at burial depths of approximately 3.0 m, indicating a limiting condition where additional confinement produces marginal improvements. The study further confirms that pipeline geometry significantly influences structural response: increasing pipe diameter results in greater displacements due to reduced stiffness and stronger interaction with the surrounding soil, whereas increasing wall thickness enhances pipeline rigidity and reduces deformation under both seismic and static loading conditions. The influence of pipe stiffness is particularly evident under dynamic loading, where inertial effects are more pronounced. Soil type is also a key controlling factor in pipeline performance. Pipelines embedded in loose sand experience larger displacements than those in clay due to lower stiffness and reduced damping capacity, whereas layered soil systems consisting of clay overlying dense sand improve performance by enhancing stress redistribution and reducing stresses transmitted to the pipe crown. Overall, the results indicate that soil stiffness and burial depth are the most influential parameters governing pipeline response, while pipe geometry plays a secondary but still important role within the investigated range. The conclusions are limited to the considered soil conditions, pipe properties, loading scenarios, and the adopted two-dimensional plane strain numerical modeling approach.
LIMITATIONS AND FUTURE STUDIES
The present study employs a two-dimensional plane strain numerical model to evaluate the response of buried pipelines under seismic and surface loading for dry soil conditions. This approach is appropriate for capturing the transverse soil–pipe interaction in long, straight pipelines; however, it does not account for three-dimensional effects such as longitudinal deformation and spatial variability of seismic loading. In addition, the analysis is limited to displacement-based performance. It does not include stress evaluation, the mechanism of pipe failure, different earthquake scenarios with varying magnitudes, boundary-sensitive analysis, and pore pressures. These aspects may be addressed in future studies using three-dimensional modeling with multiple earthquake records and extended performance criteria to provide a more comprehensive assessment.
AUTHORS’ CONTRIBUTIONS
The authors confirm their contributions to the paper as follows: M.A.: Study conception and design; M.A.: Data collection; M.A. and H.H.: Analysis and interpretation of results; H.H.: Draft manuscript. All authors reviewed the results and approved the final version of the manuscript.
LIST OF ABBREVIATIONS
| UPVC | = unplasticized polyvinyl chloride |
| HDPE | = high-density polyethylene |
| MPM | = material point method |
AVAILABILITY OF DATA AND MATERIALS
The data used in this study are available in the corresponding author's master's thesis, which is publicly accessible through the institutional repository at https://ada.atilim.edu.tr/server/api/core/bitstreams/e2983f57-0c4a-4e1a-9ad9-d75bdce2704b/content.
ACKNOWLEDGEMENTS
Declared none.
DISCLOSURE
Part of this article has previously been published in the thesis DYNAMIC AND STATIC ANALYSIS OF OIL AND GAS PIPELINES. Electronic Thesis and Dissertations. https://ada.atilim.edu.tr/server/api/core/bitstreams/e2983f57-0c4a-4e1a-9ad9-d75bdce2704b/content