All published articles of this journal are available on ScienceDirect.

Contribution to the Micromechanical Analysis of Oedometric Modulus and Damping Ratio in Granular Compression Wave Propagation in Granular Medium

Abstract
Objective
This study investigates the micromechanical behaviour of compression wave propagation in granular media using the Discrete Element Method (DEM), with a focus on the evolution and degradation of the oedometric modulus and the damping ratio under harmonic excitation.
Methods
A C++ DEM model was developed to simulate wave propagation in a granular deposit subjected to base excitation. The formulation explicitly incorporates nonlinear contact mechanics, interparticle friction, and energy dissipation under rigid-base, free-surface, and horizontal periodic boundary conditions. A three-phase loading protocol, comprising a 4.5-second amplitude ramp-up, a 6-second steady-state harmonic phase, and a 1.5-second ramp-down phase, was used to distinguish transient and steady-state responses across varying deformation amplitudes and confining pressures.
Results
The results demonstrate significant degradation of the oedometric modulus and a progressive increase in the damping ratio with increasing deformation amplitude, whereas higher confining pressures enhance the overall stiffness of the granular deposit. Compression waves exhibit lower damping and less degradation of the oedometric modulus than shear waves. Quantitatively, the free-vibration analysis provides an upper-bound estimate of stiffness with a fundamental frequency of 59.62 rad/s, a wave velocity of 20.49 m/s, and a maximum quasi-elastic modulus of 83.8×10⁴ Pa. Conversely, the secant modulus derived from low-amplitude stress-strain hysteresis loops yields lower values of 82.7×10⁴ Pa, inherently accounting for interparticle sliding and frictional dissipation, thus indicating that stiffness degradation initiates at sub-yield strain levels.
Discussion
In contrast to continuum-based approaches, this discrete framework elucidates the grain-scale mechanisms underlying the macroscopic dynamic behaviour of granular materials, highlighting the critical influence of the evaluation procedure on the determination of nonlinear soil parameters.
Conclusion
The DEM model provides a micromechanical interpretation of compression wave propagation in granular soil. Free-vibration analysis provides an estimate of elastic stiffness, whereas hysteresis loops capture dissipative mechanisms and consequently yield lower stiffness estimates. This distinction is important for geotechnical and seismic response analyses.
1. INTRODUCTION
The mechanical behaviour of discrete granular materials subjected to various types of dynamic loading, particularly during the propagation of longitudinal elastic compression waves, is an important topic that warrants further investigation. This is primarily due to the complexity of interactions between localised force fields generated at individual contact points and the macroscopic behaviour of the granular assembly. Moreover, traditional continuum-based modelling techniques can capture only a limited number of these aspects, often neglecting important features such as grain-scale contact mechanics, stiffness degradation, and energy dissipation [1].
In contrast to continuum methods, the Discrete Element Method (DEM) enables the simulation of the mechanical behaviour of granular assemblies, with explicit consideration of both the individual grain characteristics and contact interactions among them [2]. In addition to accurately simulating the wave propagation process within granular materials, DEM allows the influence of different types of energy loss mechanisms occurring at particle contacts to be assessed. These mechanisms contribute significantly to the overall energy dissipation observed in granular systems. Previous investigations have shown the potential of DEM in evaluating several mechanical aspects related to the static and dynamic behaviour of granular materials, including stress–strain relationships, grain rearrangements and attenuation of waves passing through a layer of grains [3, 4]. The former property represents one of the most significant parameters used to assess the compressibility of granular materials, depending upon various factors, such as the history of applied stresses, grain arrangement and configuration, and the adopted contact stiffness values [5]; similarly, the latter is directly related to the mechanisms of energy loss at grain-to-grain contacts, including frictional losses and losses associated with inelastic deformation [6]. Specifically, recent micromechanical studies have successfully captured a wide range of complex phenomena, including stick-slip behaviour under varying pressures [7], pile penetration mechanics [8], and the direct influence of grain shape on stress-dilatancy parameters [9]. Furthermore, advanced DEM applications have been extended to multiphysical problems, such as fluid-particle interaction during seepage erosion [10] and the axial response of buried pipelines [11]. To better capture the micromechanical response and wave dynamics in soils, several discrete element models have been proposed. Recent investigations on compression wave propagation and energy absorption in dry sandy soil were carried out as reported previously [12], building upon earlier DEM analyses of stress-wave responses in particle assemblies under triaxial loading [13]. Furthermore, the micro-macro response of sand subjected to loading conditions was investigated [14], while a discrete-based multi-scale modelling approach was developed in another study [15] to evaluate seismic wave propagation. Nonetheless, several questions remain open regarding the degradation of the oedometric modulus and changes in damping when a granular assembly is subjected to repeated cycles of compression waves. Many studies have dealt with the evaluation of both the oedometric modulus and damping in granular materials, whereas much less attention has been paid to their evolution under dynamic loading. Furthermore, the majority of previous studies on wave propagation in granular media have focused predominantly on shear waves, leaving compression waves comparatively less explored. Therefore, DEM appears to be a useful tool for investigating these aspects. To provide a comprehensive background on recent advances in computational granular dynamics and advanced numerical modelling of dynamic soil behaviour over the past decade, a systematic literature review is presented in Table 1.
The literature reviewed above highlights a clear trend: although the Discrete Element Method (DEM) has been widely adopted to study the behaviour of granular soils under cyclic loading, almost all existing research has focused on shear-wave propagation (Vs) and shear modulus degradation (G/G0). This strong bias leaves a significant gap in the understanding of longitudinal compression-wave propagation, particularly regarding its relationship with the oedometric modulus (E) and damping ratio (ξ) under vertical dynamic loading conditions. Most traditional models do not account for the non-destructive elastic threshold and therefore neglect the evolution of interparticle friction required to capture the onset of nonlinear behaviour. Consequently, the mechanisms governing energy dissipation and stiffness variations under purely vertical dynamic loading require further investigation to gain a better understanding of these phenomena.
| Reference | Methodology | Main Conclusions | Work Limitations | Relevance to the Present Study |
|---|---|---|---|---|
| Tang and Yang [4] | Advanced numerical simulations exploring the explicit role of non-spherical particle shapes, microstructural interlocking, and contact geometry on elastic wave propagation. | Particle shape anisotropy and surface non-sphericity significantly alter internal force chain paths, wave velocities, and localized energy transmission. | The study mainly deals with wave velocity and directional scattering under free-boundary impulses, without quantifying the cyclic degradation of the oedometric modulus or compression damping loops. | Justifies the consideration of detailed interparticle interactions (sliding and friction) and microstructural confinement to accurately track the responses of compression waves (Vp). |
| Ozbay and Cabalar [7] | Triaxial laboratory testing combined with discrete numerical modelling to investigate stick-slip friction mechanisms under cyclic shear. | The increase in triaxial confining pressure and varying strain rates are directly related to stick-slip amplitude dynamics. | The study focuses on large-deformation shear failure and stick-slip friction instabilities rather than non-destructive longitudinal wave propagation parameters. | Justifies our interest in low strain and provides insights into how confinement pressure alters stability. |
| Gezgin et al. [8] | Three-dimensional discrete element modelling designed to isolate and analyse the distinct influences of individual soil characteristics under high-penetration boundary conditions. | Stiffness, interparticle friction, rolling friction, and packing density were found to govern the development of macroscopic limit forces. | The study focuses on high-deformation, monotonic pile penetration mechanics and localized particle displacements rather than non-destructive cyclic elastic wave velocities. | The micromechanical parameters considerably influence the overall assembly stabilisation under strict boundary constraints. |
| Arda and Cinicioglu [9] | Investigating the explicit influence of grain shape (sphericity and angularity) on stress-dilatancy relationships in granular assemblies. | High particle angularity increases peak shear strength and shifts the critical state line, significantly modifying interlocking and dilatancy parameters. | The study focuses on quasi-static, monotonic triaxial shear paths and stress-dilatancy behaviors rather than non-destructive cyclic compression-wave damping. | It offers a valuable framework for understanding how grain geometry and microstructural interlocking dictate the initial packing state, establishing stable contact configurations prior to dynamic testing. |
| Cheng et al. [10] | Coupled CFD-DEM modelling investigating the influence of irregular coarse particle shapes (spherical, cubic, tetrahedral, and ellipsoidal) on seepage erosion and pore-network evolution in gap-graded soils. | Non-spherical particle shapes lower pore-topology connectivity, increase resistance to fine-particle transport, and critically govern the magnitude of internal erosion. | The study focuses on fluid-particle interaction, high-strain mass loss, and hydraulic seepage erosion rather than non-destructive cyclic stress-wave propagation or elastic stiffness. | Highlights how irregular grain shapes and aspect ratios significantly alter internal fabric topology, supporting the focus on micromechanical packing stability. |
| Guo et al. [11] | Discrete element modelling investigating the macro-micro axial interaction, force transfer mechanisms, and soil-pipe behaviour of pipelines buried in unsaturated coarse-grained soils. | Matric suction, moisture distribution, and particle-pipe contact dynamics significantly govern axial pulling resistance and localized failure zones around the structure. | The study focuses primarily on large-strain structural displacement, pipeline slip, and unsaturated soil suction mechanics rather than non-destructive cyclic elastic-wave velocities. | The robustness of DEM in modelling complex soil-structure contact constraints provides a valuable comparative framework for rigid boundary interactions. |
| Cui et al. [12] | Coupled numerical and experimental analysis investigating compression-wave propagation velocity and kinetic energy absorption characteristics in dry sandy soils. | The study confirmed that compression-wave velocity scales with confinement and packing density, while energy absorption is driven by macroscopic damping. | The study does not compare or quantify the differences between modulus values derived via free-vibration states and those extracted from the slopes of cyclic stress-strain curves. | The originality of this work lies in the development of a dual evaluation approach based on free vibrations and hysteresis loops. |
| Li et al. [13] | DEM simulation exploring the behaviour of anisotropic granular packing geometries subjected to multi-directional shearing paths. | Particle morphology and contact networks govern directional fabric evolution and induce macroscopic stiffness anisotropy. | The study focuses primarily on triaxial shear loading configurations, leaving the rigid lateral boundary constraint typical of oedometric compression unexamined. | It provides a valuable microstructural benchmark for analysing how contact-network fabrics and contact-normal distributions evolve under initial confinement. |
| Ezzeddine et al. [14] | Micromechanical DEM tracking of contact-force variations, particle sliding, and oedometric modulus evolution under cyclic loading. | The study revealed that macro cyclic hysteresis loops, modulus variation, and energy dissipation are driven by the micro-slip threshold of the contact networks. | The study focuses on macro-micro cyclic deformation and modulus degradation paths without quantifying the specific wave velocity or damping of dynamic compression waves. | The study provides a direct comparative benchmark for validating our cyclic oedometric modulus curves and interpreting their micromechanical origins at low amplitudes. |
| Mohamed et al. [15] | Discrete-based multi-scale simulation exploring longitudinal and shear wave propagation profiles under seismic excitations. | The study confirmed that macroscopic seismic wave attenuation correlates closely with microstructural contact force chains and particle-slip events across varying soil depths. | The model was calibrated and validated for shear wave velocity profiles, leaving the specific compression wave response and its evolution unquantified. | A multi-layer macroscopic recording framework was implemented across independent tracking intervals to ensure a consistent methodology for analysing wave propagation throughout the granular assembly. |
To address this gap, the present study analyses the behaviour of a non-cohesive granular deposit subjected to dynamic excitation at its base using a two-dimensional discrete element model. A harmonic base displacement is imposed to simulate the propagation of compression waves through a granular assembly of circular particles. By monitoring particle-scale interaction under these dynamic conditions, this study highlights the microstructural modifications and contact-force redistributions that govern stiffness degradation (i.e., the degradation of oedometric modulus (E)) and energy dissipation (i.e., the evolution of damping ratio (ξ)) as a function of strain level. Particular emphasis is placed on identifying the critical threshold above which nonlinear behaviour becomes dominant. Ultimately, this study aims to provide a practical framework for improving the prediction of the micromechanical compression response of granular media in engineering applications, thereby bridging the gap between grain-contact mechanics and macroscopic soil behaviour.
2. MATERIALS AND METHODS
2.1. Discrete Element Method (DEM) for Modelling Granular Materials
The Discrete Element Method (DEM) used in this study is based on the principles of molecular dynamics, with translational and rotational motion governed by Eqs. (1 and 2) (Fig. 1) [16].
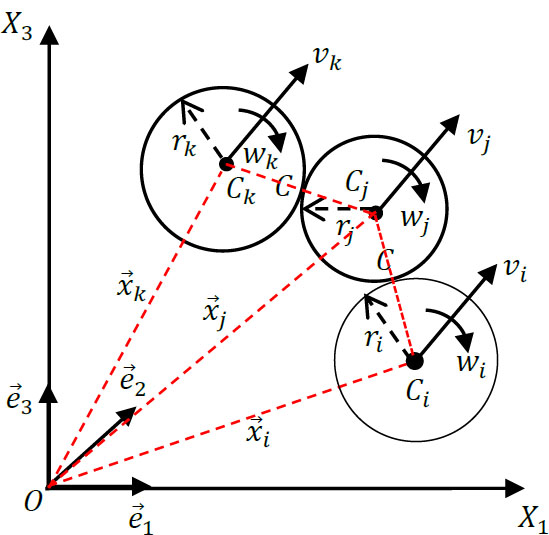
Description of grain movement.
All the physical and micromechanical parameters governing the model and used in this study are listed in the Appendix.
For a grain i, let its centre of mass be denoted by Ci, its radius by ri, its position vector by  , and its angular velocity by
 . The translational velocity of the grain is denoted by
 . The contact point between two grains is denoted by C.

The translational acceleration of a grain is denoted by  , its mass by mi, the interaction force exerted on grain j by a grain i in contact with it by
 , and the acceleration due to gravity by
 . The rotational equilibrium is given by Eq. (2):

 denotes the rotational acceleration of the grains, Ii is the moment of inertia,
 represents the moments generated by the contact forces about the centre of mass of the grain. Grain interactions occur at contact points, where each grain exchanges forces with its neighbouring grains. The overall strain of the medium is assumed to result primarily from the relative motions between grains, which are treated as rigid bodies. The contact force is calculated using Eq. (3) [17, 18].

 and
 are the normal and tangential contact forces, respectively. The use of a simple grain shape plays an important role in reducing computational time [17]. The most commonly used shapes are discs for two-dimensional (2D) modelling and spheres for three-dimensional (3D) modelling. The contact forces are calculated using simple models based on a slight overlap between grains.
2.2. Contact Laws and Interaction Models
2.2.1. Contact Forces
A simplified decomposition is used to analyse the contact forces into a normal component, , and a tangential component, , lying in the plane tangent to the grain at the contact point. The normal force is described by a viscoelastic model, as shown in Fig. (2a and b).
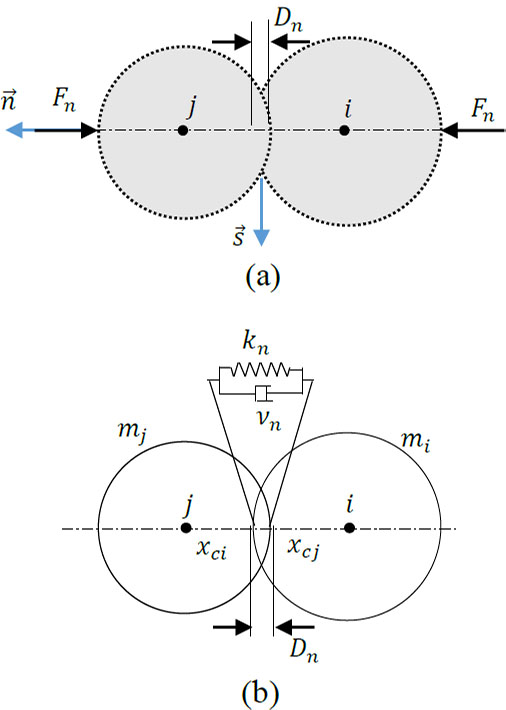
Normal contact force between particles: (a) Physical model; (b) viscoelastic model.
The normal contact force is calculated using Eq. (4) [19].

where kn and vn are the elastic constant and the viscous damping constant, respectively.
Vn denotes the normal velocity.
The calculation of the normal contact force between two grains depends on the normal contact distance, denoted by Dn ≤ 0 (contact force calculation condition).
The normal distance Dn between i and j is defined geometrically by Eq. (5):

where ri and rj are the radii of grains i and j.
The tangential contact force between two grains is computed using a viscoelastic model with friction (Fig. 3).
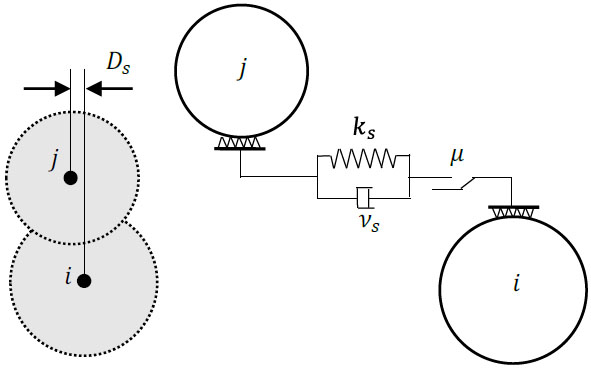
Tangential contact force between grains.
The tangential contact force, , is given by Eq. (6) as follows [20]:

where ks is the tangential stiffness, vs is the viscous damping coefficient, μd is the inter-particle coefficient of friction, and the relative tangential displacement is given by Eq. (7):

The tangential velocity of grain j with respect to grain i is given by Eq. (8):

If the tangential force Fs > to µsFn reaches the Coulomb static friction threshold, the grains enter the sliding regime, Fs set to Fsmin. At this point, the tangential spring deformation must be adjusted to be consistent with the kinetic friction force, which is given by Eq. (9):

It should be noted that the lower limit of the friction force Fsmin is expressed by Equation (10) as follows:

where: µs and µd are the static and dynamic coefficients of friction, respectively.
To account for the damping of the rolling motion of natural grains, a rolling resistance Mr is incorporated into the model. The rolling resisting moment is assumed to result from the eccentricity of the normal contact force, as illustrated in Fig. (4). Therefore, it is calculated using Eq. (11) as follows [21]:
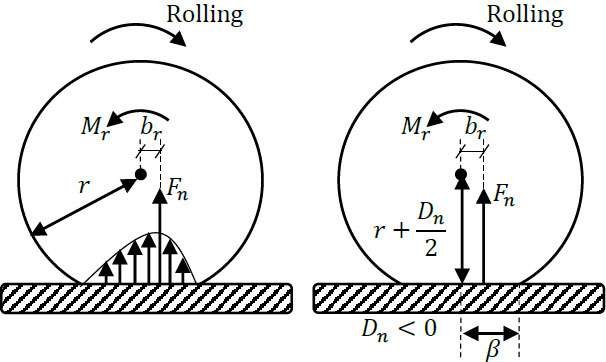
Rolling resistance model.

where  , and 0 < α < 1; α is fixed at 0.5 in this study.
2.2.3. Contact Duration and Time-Step Integration
It is important to note that, to accurately capture the evolution of the normal and tangential contact forces, the time step must be much smaller than tc (∆t << tc). A common practice is to set ∆t ≈ tc/10. For a viscoelastic contact model, the contact duration

where  is the effective mass and kn is the normal stiffness. Accordingly, the maximum allowable time step is given by Eq. (13):

where m is the smallest effective mass in the system.
2.3. Analytical Solutions of Wave Propagation in Soil
For a homogeneous, linearly elastic, isotropic soil profile, the one-dimensional (1D) differential equation governing the displacement u(z,t) is given by Eq. (14) [22]:

where u is the vertical displacement and Vp is the compression-wave velocity, given by Eq. (15):

where E is the oedometric modulus of the soil, and ρ is its mass density.
For harmonic excitation, the solution is obtained using Eq. (16):

where uo is the excitation amplitude, ω is the excitation frequency, h is the soil layer depth, and z is the depth coordinate.
2.4. Numerical Model DEM
In this study, a two-dimensional (2D) simulation of compression-wave propagation in a granular soil profile is conducted using the Discrete Element Method (DEM). The soil grains are deposited under gravity to form a dense granular assembly. Several boundary conditions are implemented: periodic boundary conditions are applied laterally to simulate an infinite horizontal extent, the top surface is left free, and the base is supported by a rigid wall representing the bedrock. To generate wave motion, a chain of grains is placed directly on the bedrock, and a controlled horizontal harmonic displacement is applied to this chain. A vertical load may also be applied to the top surface to adjust the stiffness of the profile and to simulate the behaviour of deeper soil layers. The interaction laws between the grains are described in Section 2.2.
The interaction laws between the grains in the chain and those in the soil profile are identical to those governing grain-to-grain interactions within the profile.
To analyse wave propagation, a harmonic excitation with a prescribed amplitude and frequency is applied to the grain chain at the base of the soil profile. The soil profile is divided into several horizontal layers, and the average displacement within each layer is recorded throughout the excitation to evaluate the wave transmission characteristics.
2.5. Simulation Parameters
Figure 5 illustrates the granular soil profile model subjected to excitation, together with the applied boundary conditions. The physical properties of the grains and the micromechanical parameters used to calculate the contact forces are summarised in Table 2 [23-29].
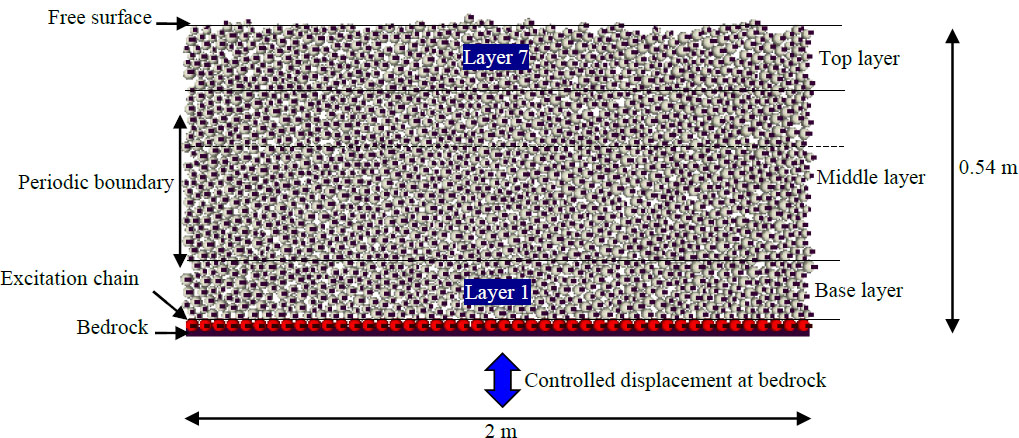
Sand profile and boundary condition [23].
| Parameters | Value |
|---|---|
| Number of Grains | 5000 |
| Grains radii ri | 1.00x10⁻³ to 2.00x10⁻³m |
| Density Gs | 2600 kg/m3 |
| Normal intergranular stiffness kn | 1.2 x10⁶N/m |
| Shear intergranular stiffness ks | 9.6x10⁵N/m |
| Intergranular friction coefficient μ | 0.5 |
| Normal viscous damping coefficient vn | 41.38 kg/s |
| Tangential viscous damping coefficient vs | 33.10 kg/s |
| Acceleration of gravity g | 9.81 m/s2 |
The soil profile is generated by pluviating 5000 grains under gravity, resulting in a dense assembly stabilised within a domain measuring 2.0 m in width and 0.54 m in depth. Once stabilised, the profile is subjected to a harmonic excitation defined by u(t) = u0 sin(ωt), where u0 is the amplitude and ω is the angular frequency.
To minimise the effects of transient responses in the soil deposit, the excitation is applied in three phases, following the procedure proposed earlier [25]. During the first phase, the excitation amplitude is gradually increased from zero to the target steady-state value. In the second phase, the amplitude is held constant to induce steady-state oscillations. Finally, during the third phase, the amplitude is progressively decreased back to zero. In the simulations presented, the durations of these three phases are set to 4.5 seconds, 6 seconds, and 1.5 seconds, respectively. This staged loading strategy allows transient effects to decay substantially before the steady-state phase is reached. The results discussed below correspond primarily to this steady-state phase.
For the purposes of the analysis, the soil deposit is divided into seven horizontal layers, and the displacement recorded in each layer represents the average displacement of all grains within that layer.
To further clarify the simulation procedure using the Discrete Element Method (DEM), Fig. (6) illustrates the workflow, which is organised into three key calculation phases.
The granular deposit is generated using the gravitational pluviation technique. At the initial stage, the grains are arranged on a regular lattice without any initial contact. They are then released under gravity, allowing them to settle onto the rigid base that represents the bedrock.
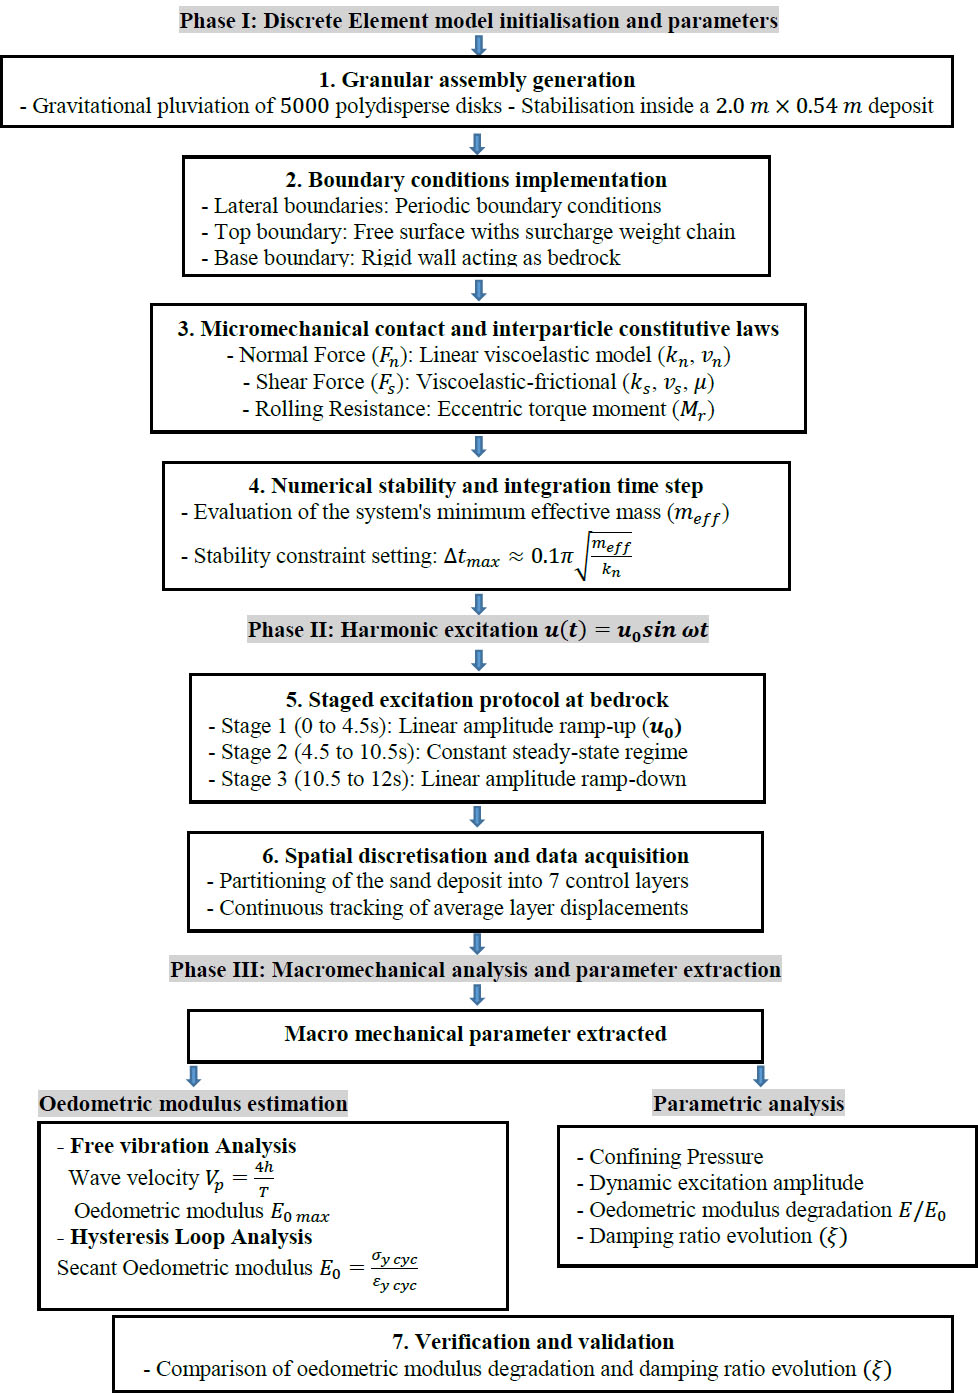
Methodological flow chart.
Specifying 5000 grains in this model provides a balanced compromise, allowing the formation of a representative granular assembly while keeping computational costs manageable. The chosen particle radii and density are intended to represent the physical characteristics of a natural, medium-grained sand. The stiffnesses  = 0.8 is commonly adopted in DEM simulations and reflects typical contact behaviour in granular materials. The interparticle friction coefficient of μ=0.5 is used to ensure realistic sliding behaviour consistent with dense granular materials. The normal and tangential damping coefficients (vn and vs) were selected to ensure numerical stability while preserving the dynamic response of the system without introducing excessive damping.
The excitation parameters are amplitude of u0 = 4 x 10⁻⁴m and angular frequency of ω=30 rad/s. During the first phase (i.e. from 0 to 4.5 s), the displacement amplitude is increased linearly with time from zero to 4 x 10⁻⁴ m. It is then maintained at this amplitude for 6 seconds and gradually decreased to zero over 1.5 seconds. Figure 7 shows the resulting bedrock displacement response.
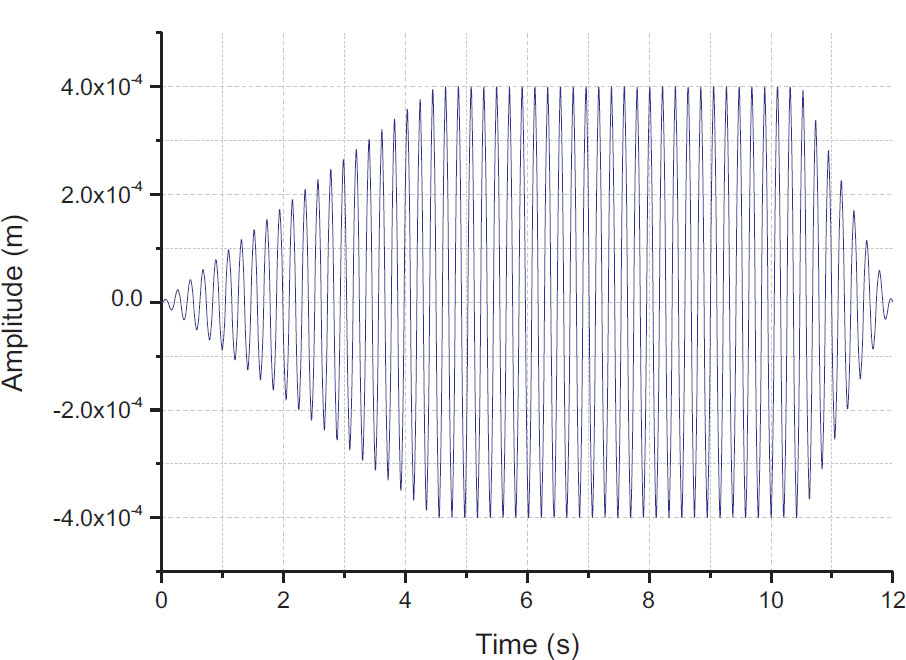
Bedrock displacement response (excitation).
3. RESULTS AND DISCUSSIONS
3.1. Free Vibration Response
Two techniques are used to estimate the maximum oedometric modulus. The first method involves determining this modulus from the pseudo-elastic oscillations observed during the free-vibration phase that follows the end of the excitation (Fig. 8). For this method, the soil deposit is subjected to harmonic excitation with an amplitude of u0 = 4 x 10⁻⁴m and an angular frequency of 30rad/s. The second method involves determining the modulus from the hysteresis curves obtained at low excitation amplitudes.
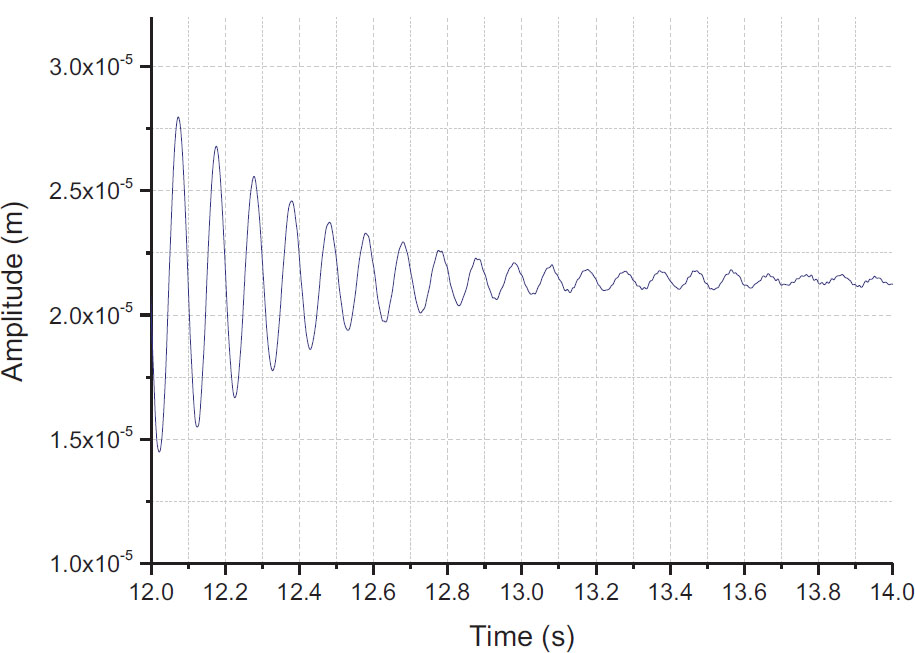
Detailed view of the displacement response in the top layer during free vibration (after 12 seconds).
From Fig. (8), the fundamental period can be estimated as approximately T = 0,1054 seconds. Hence, the fundamental frequency can be calculated using Eq. (17).

The calculated fundamental frequency is ω1= 59.62 rad/s.
The compression wave velocity can be estimated from the fundamental period of the elastic oscillation using Eq. (18) [22]:

Accordingly, the compression-wave velocity for the present soil deposit is Vp=20,49m/s.
Using Eq. (15), the oedometric modulus can be estimated as follows Eq. (19):

Upon calculation, the oedometric modulus is obtained as:
E0max = 20,492 x 1996,77 = 838326,322 Pa
Therefore: E0max  83.8 × 104 Pa
3.2. Estimation of Oedometric Modulus E0
In this section, the maximum oedometric modulus E0 is evaluated. This value corresponds to the slope of the hysteresis curves at low excitation amplitudes, on the order of 10-5.
The equivalent oedometric modulus was determined from the slopes of the mean stress–strain hysteresis loops for each loading cycle, following the procedure described in Eq. (20).

where:

where σy cyc and εy cyc are defined by Eqs. (21 and 22), respectively, representing the average cyclic compressive stress and strains. The terms σy cyc3, σy cyc4, and σy cyc5 refer to the compressive stresses in the third, fourth, and fifth sub-layers, respectively.

In this expression, up6 represents the peak displacement of layer 6, u1 represents the displacement of layer 1 at the same instant (corresponding to up6), and yi denotes the vertical coordinate of the center of layer i.
Figure 9a shows the calculated cyclic compressive stresses at various depths, obtained for an excitation amplitude of u0 = 4 × 10⁻⁴m and an angular frequency of 30rad/s.
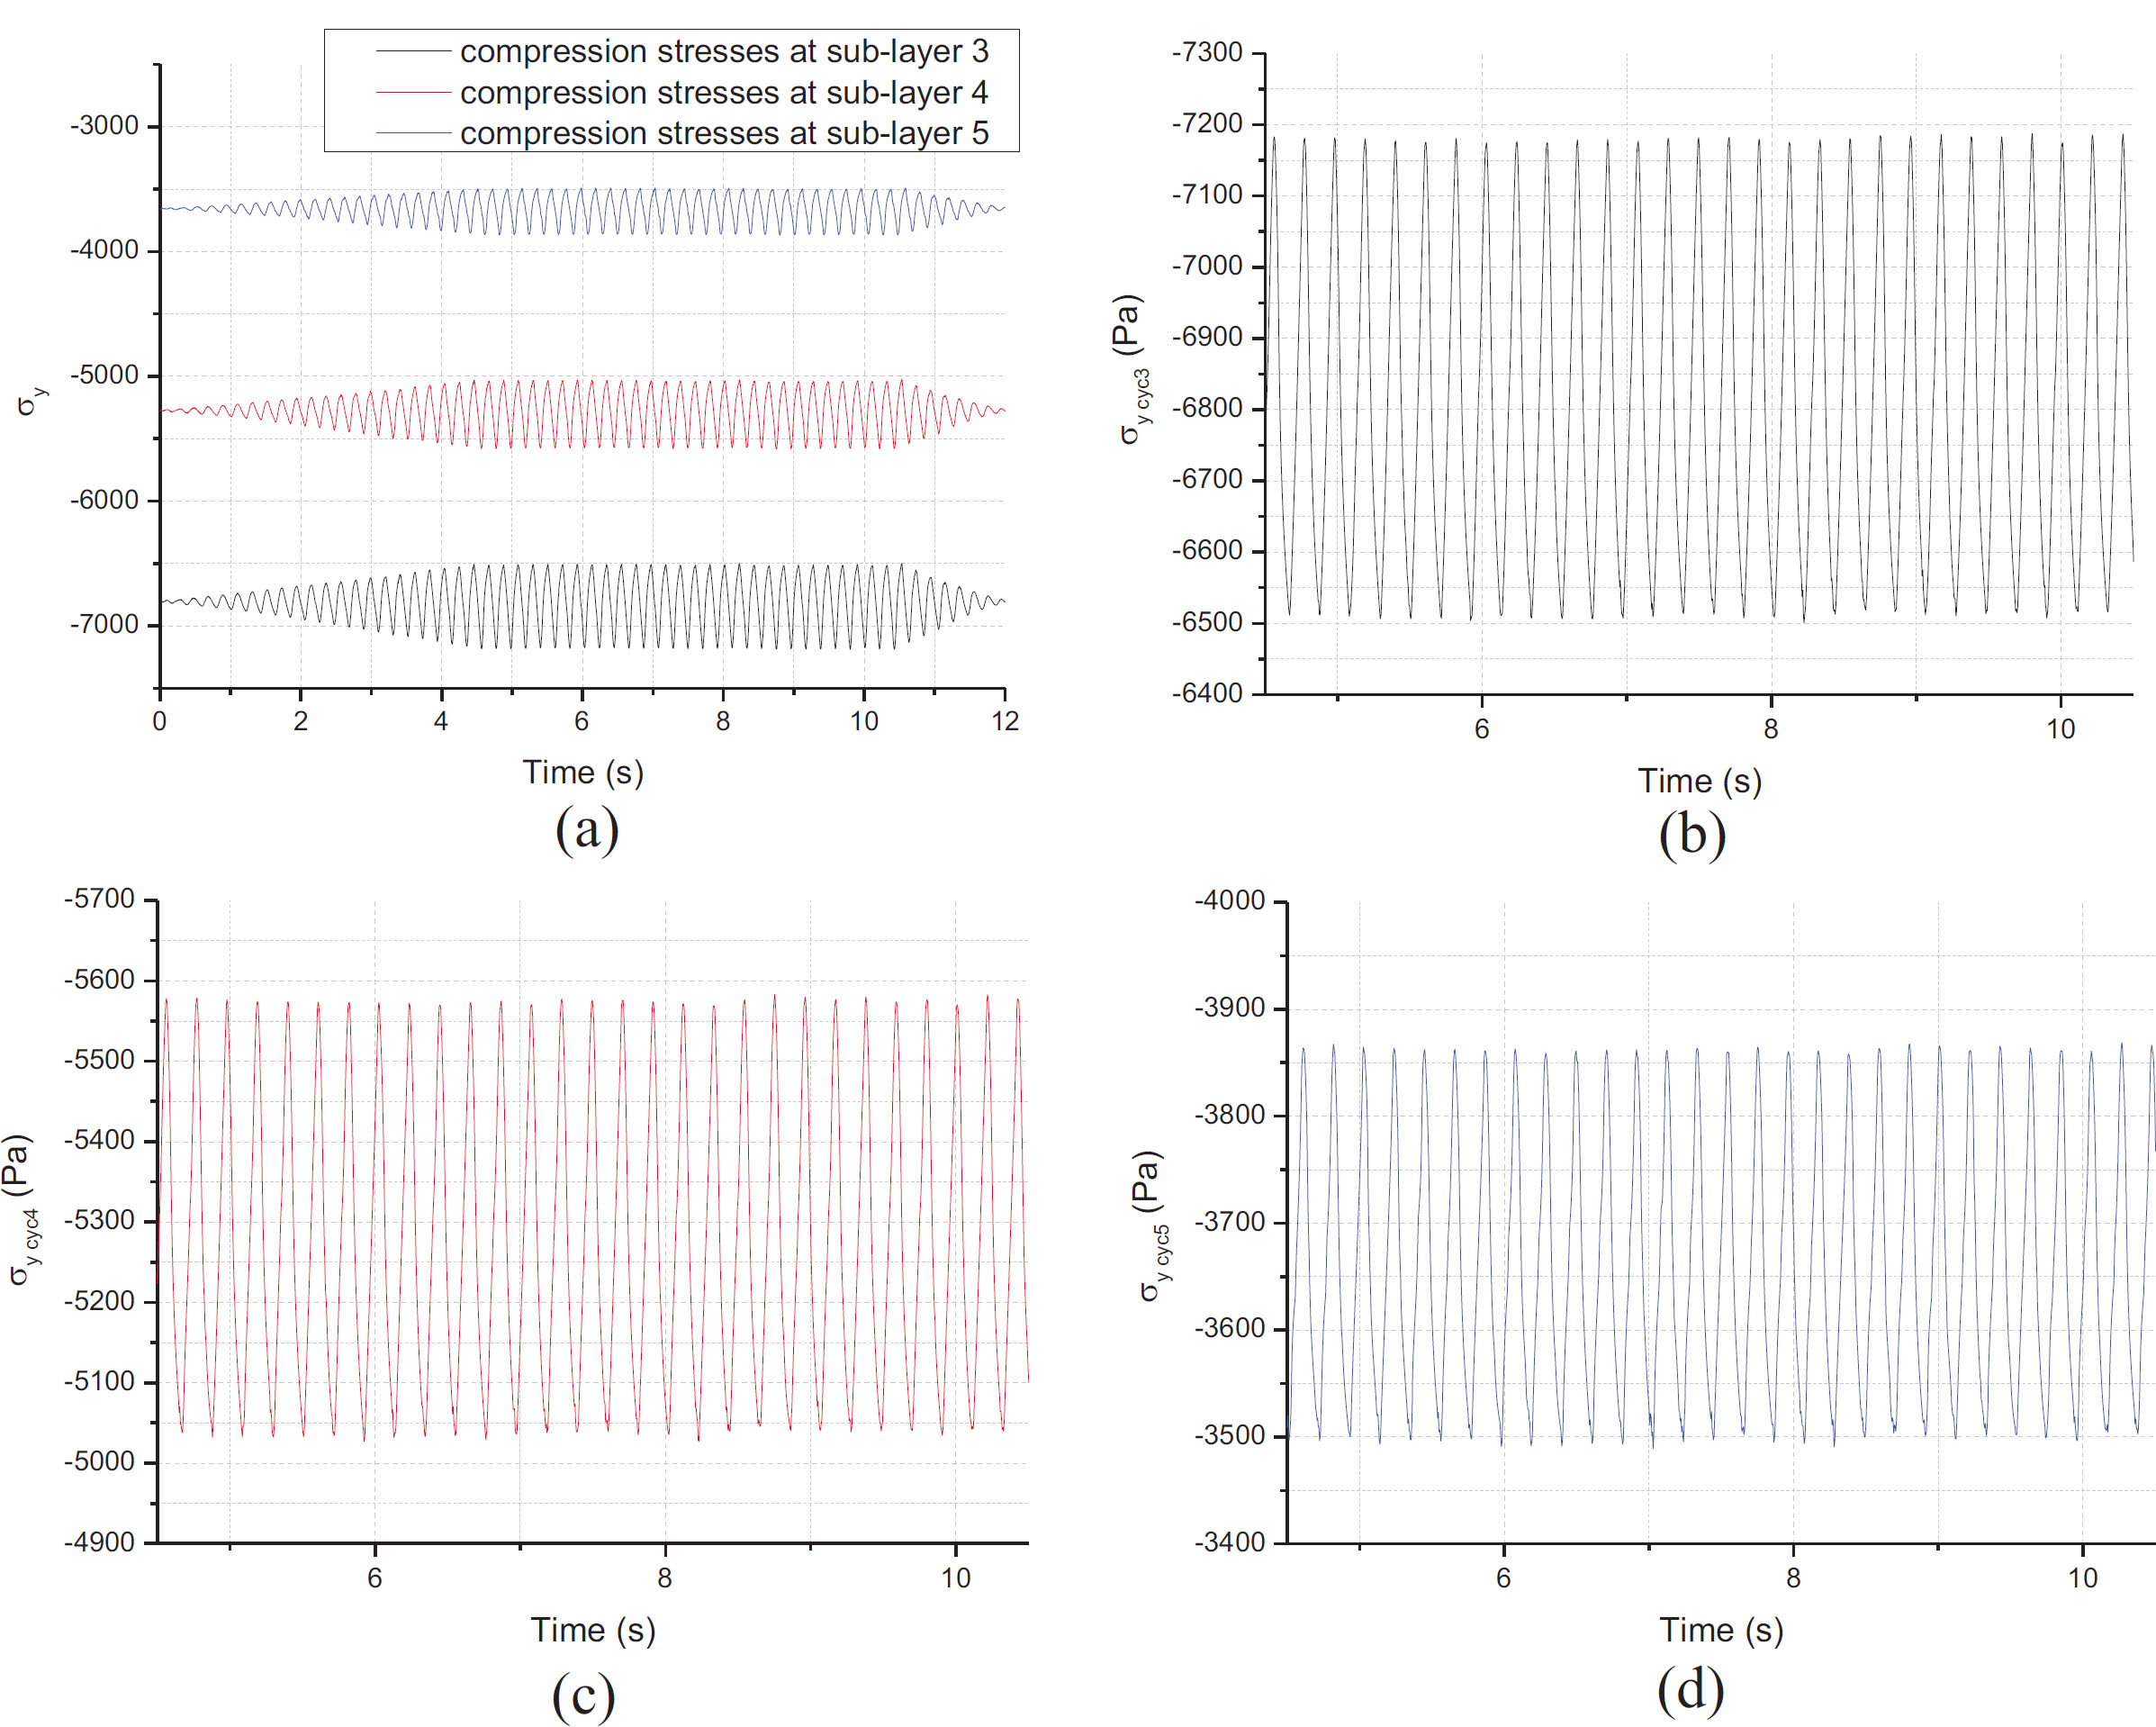
Evolution of cyclic compressive stresses at various depths within the granular deposit: (a) global overview, (b) details at the third layer σy cyc3, (c) fourth layer σy cyc4, (d) fifth layer σy cyc5.
Figure 9b-d show the evolution of cyclic compressive stresses in the third, fourth, and fifth layers, respectively.
Figure 10 illustrates the stress–strain hysteresis loops used to estimate the maximum oedometric modulus, E0, during the steady-state response phase. The data were recorded between 4.5 seconds and 10.5 seconds for the unconfined soil deposit, thereby ensuring that transient effects were excluded from the analysis.
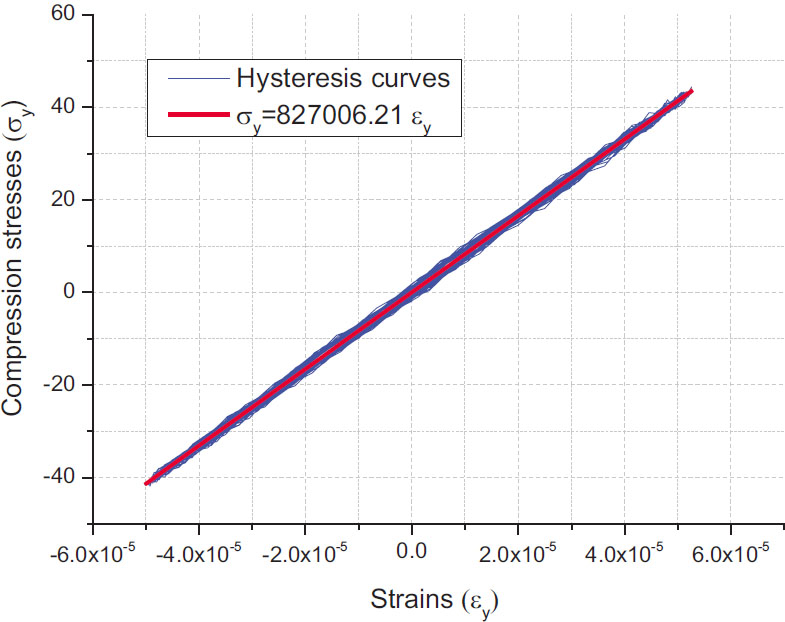
Hysteresis curves used to estimate the maximum oedometric modulus E0.
This figure highlights the nonlinear behaviour and energy dissipation of the granular material. The initial slope defines the maximum oedometric modulus, E0 82.7 × 10⁴ Pa.
It can be observed that the oedometric modulus obtained from free vibration (Section 3.1) is higher than that derived from the hysteresis loops at low excitation amplitudes. This suggests that the oedometric modulus obtained from free vibration corresponds to the maximum dynamic modulus, E0 max, measured under predominantly elastic conditions. In contrast, the modulus derived from the hysteresis loops is a secant modulus that accounts for interparticle sliding and energy dissipation. Consequently, even at very low deformation amplitudes, the modulus obtained from free vibration is higher than that derived from hysteresis loops.
The results highlight the significant influence of micromechanical interactions on the dynamic behaviour of granular materials. The discrepancy observed between the oedometric modulus obtained from free vibration and that derived from the hysteresis loops indicates that energy dissipation mechanisms, such as interparticle sliding and friction, play a crucial role even at very low deformation amplitudes.
3.3. Effect of Confinement Pressure on Oedometric Modulus Estimation (E0)
In order to study the oedometric modulus of a deep soil layer, a weighted chain of grains is introduced at the surface of the deposit; the confining stress can be increased by increasing the specific weight of the grains forming the chain. In this analysis, the deposit is subjected to a harmonic excitation with u0 = 4 × 10⁻⁴m, a frequency of 30rad/s and confining pressures of 10 kPa and 20 kPa.
Figure 11a and b illustrate the influence of confining pressure on the estimation of the maximum oedometric modulus E0.
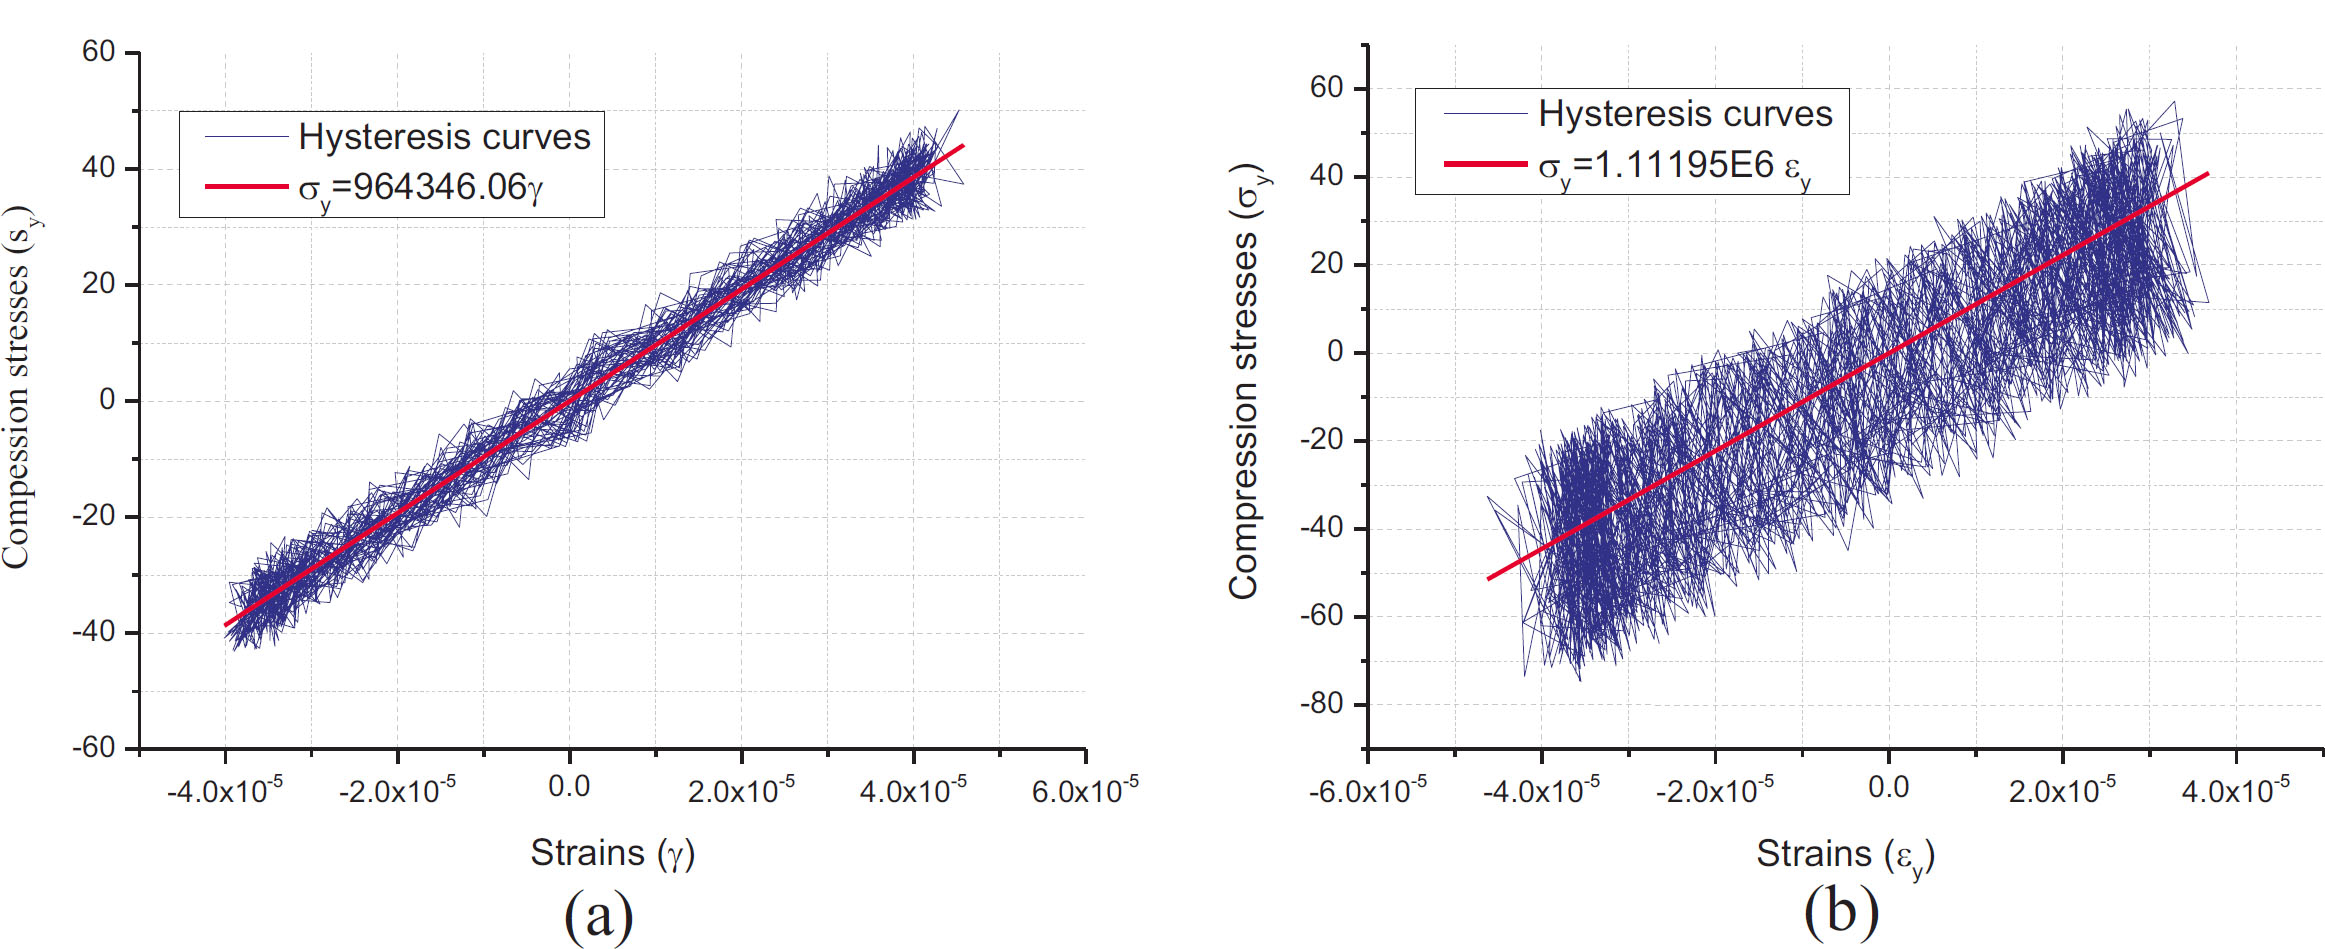
Influence of confining pressure on the estimation of oedometric modulus E0: (a) P = 10 kPa, (b) P = 20 kPa.
Figure 11 shows that the soil profile subjected to a low confining pressure (a) exhibits a lower oedometric modulus than the profiles subjected to higher confining pressures (b), confirming the influence of confining pressure on soil stiffness. This finding highlights the role of confinement in determining the mechanical behaviour of the soil and the load-bearing capacity of the granular medium. Overall, increasing the confining pressure leads to a noticeable increase in stiffness, consistent with well-established geotechnical principles.
3.4. Oedometric Modulus Degradation
This section investigates the degradation of the oedometric modulus within the unconfined sand profile under increasing excitation amplitudes. The analysis is conducted at a constant angular frequency of 30 rad/s, with amplitudes ranging from 4 × 10⁻⁵m to 4 × 10⁻³m. Figure 12 illustrates the influence of excitation amplitude on both the oedometric modulus, E, and the displacement time history.
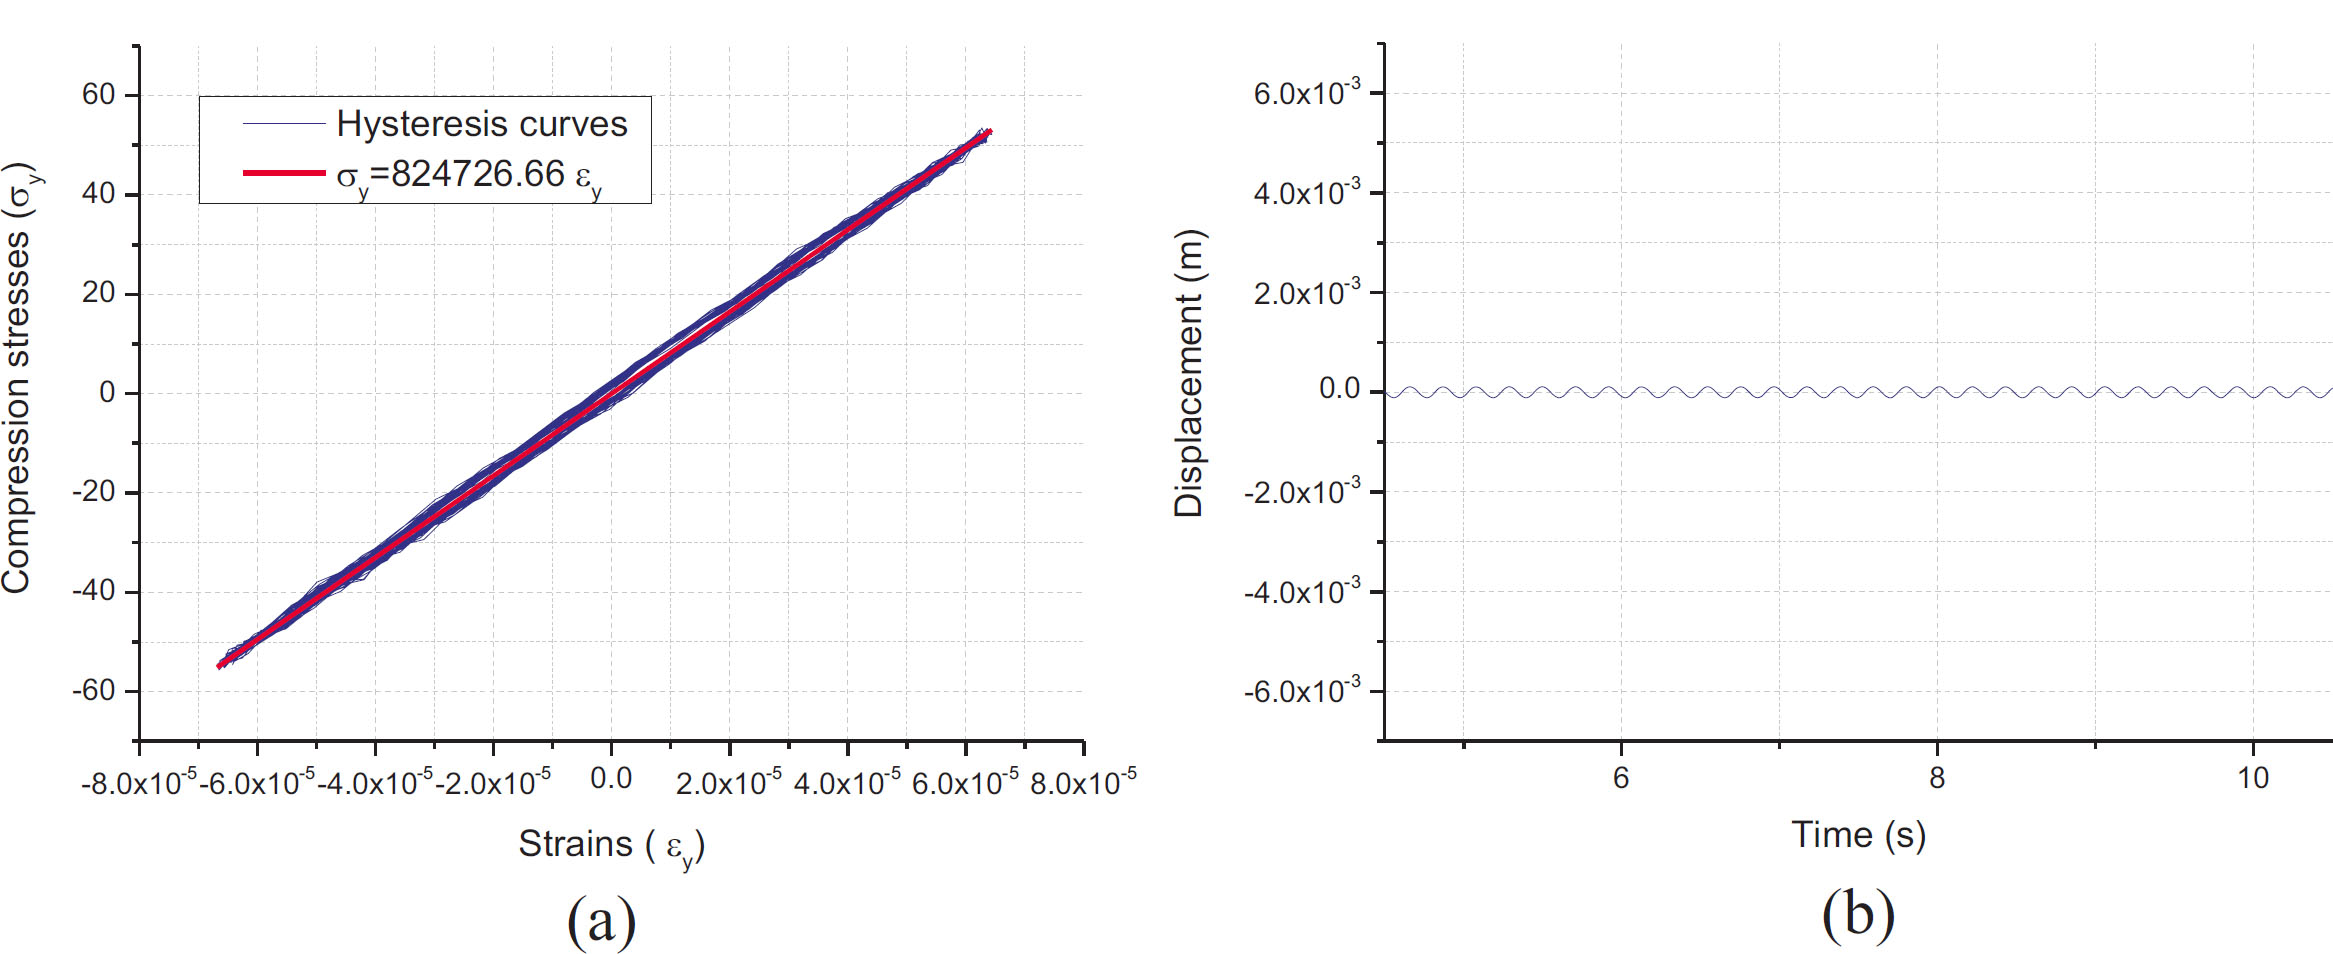
Dynamic response at the top layer of the sand deposit: (a) Hysteresis loops; (b) displacement time histories under excitation amplitudes of u0 = 1×10⁻⁴m
3.4.1. Discussion of Oedometric Modulus Degradation amplitudes (≤ 1 × 10⁻⁴ m), stress-strain
Figure 12 illustrates that at low excitation amplitudes (≤ 1 × 10⁻⁴ m), stress-strain hysteresis loops are virtually absent. This response indicates that the granular assembly remains within a quasi-elastic regime, where energy dissipation is negligible. However, as the excitation amplitude increases, the induced strain within the deposit also increases, triggering the formation and progressive development of well-defined hysteresis loops. The enclosed area of these loops increases with increasing strain, reflecting a clear rise in frictional energy dissipation. From a micromechanical perspective, this transition from predominantly elastic behaviour to frictional energy dissipation is associated with the onset of localised inter-particle sliding and changes in the contact network. This mechanism is consistent with the cyclic DEM findings [14] and the wave attenuation mechanisms reported previously [15].
Furthermore, Figures 12a, 13a, 14a, 15a, 16a, and 17a highlight the progressive degradation of the oedometric modulus (E) as a function of strain amplitude. For an initial excitation amplitude of 1×10⁻⁴ m, the computed oedometric modulus is approximately 82,47×10⁴ Pa. Increasing the excitation amplitude to 1 × 10⁻³ m induces a significant decrease in the modulus to 71,77×10⁴ Pa, demonstrating the nonlinear degradation of the oedomertic modulus under dynamic loading at larger strain amplitudes. This reduction in stiffness is evidenced by the decreasing slope of the hysteresis loops. This macroscopic stiffness degradation is associated with the rearrangement of grain contacts and changes in the granular fabric. Such changes may be influenced by particle shape and accompanied by a redistribution of contact forces within the granular assembly, ultimately affecting its overall mechanical response.
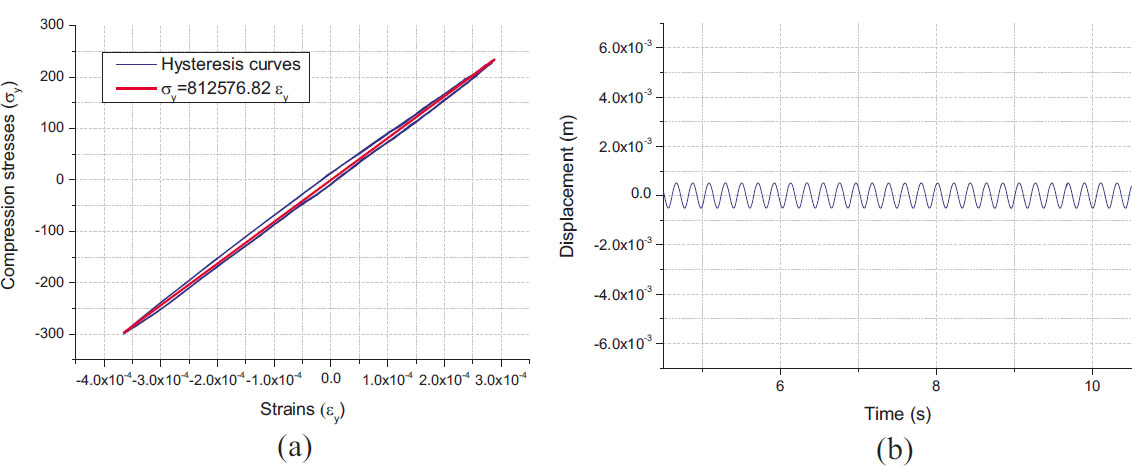
Dynamic response at the top layer of the sand deposit: (a) Hysteresis loops; (b) displacement time histories under excitation amplitudes of u0 = 1×10⁻⁴m.
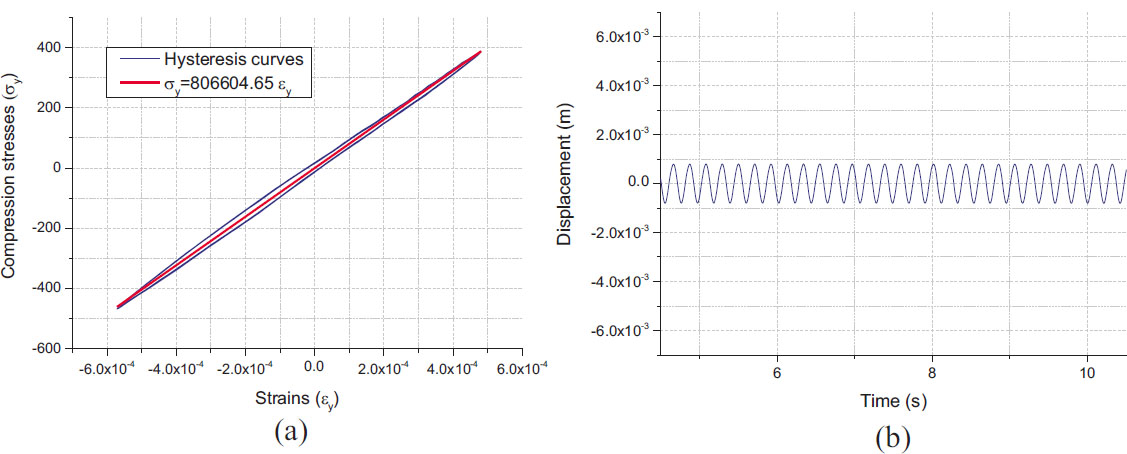
Dynamic response at the top layer of the sand deposit: (a) Hysteresis loops; (b) displacement time histories under excitation amplitudes of u0 = 6×10⁻⁴m.
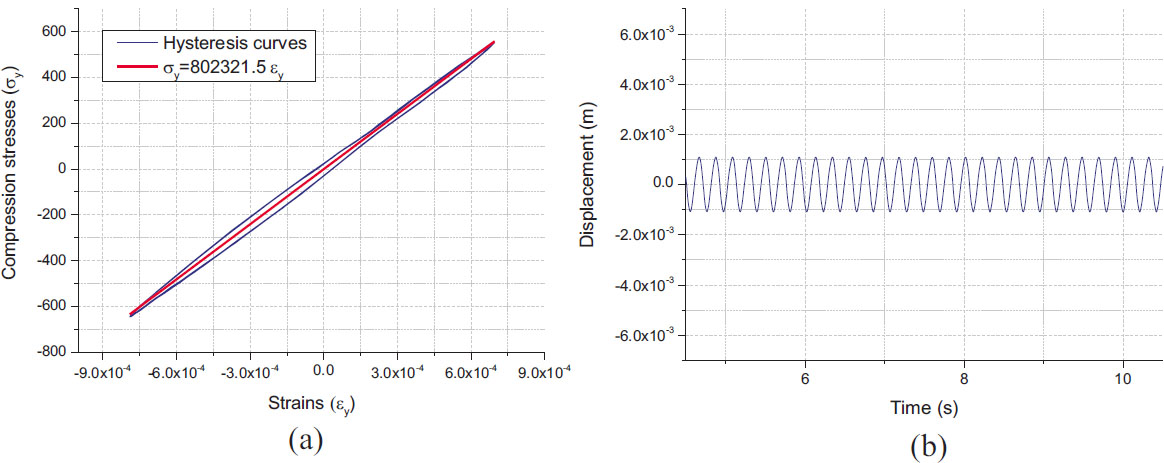
Dynamic response at the top layer of the sand deposit: (a) Hysteresis loops; (b) displacement time histories under excitation amplitudes of u0 = 8×10⁻⁴m.
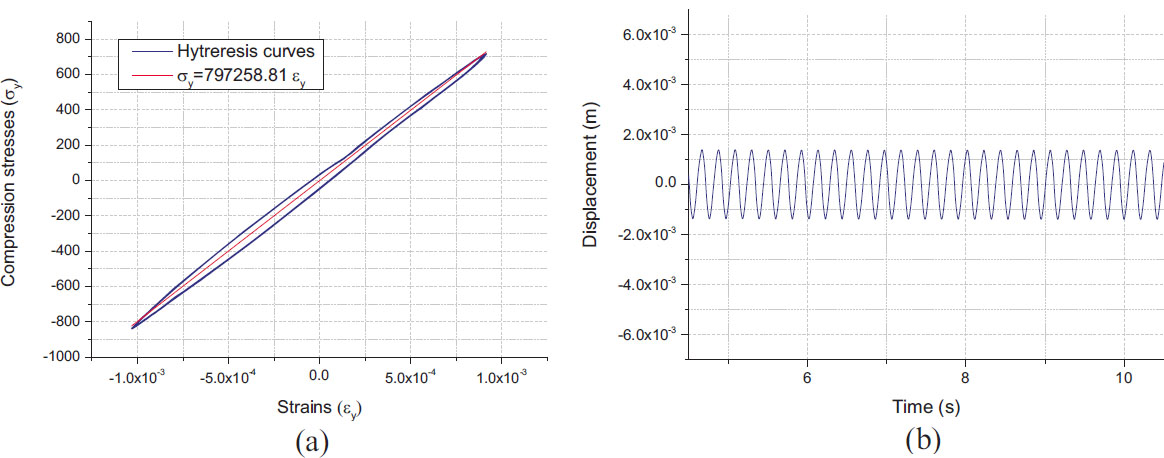
Dynamic response at the top layer of the sand deposit: (a) Hysteresis loops; (b) displacement time histories under excitation amplitudes of 1×10⁻³m.
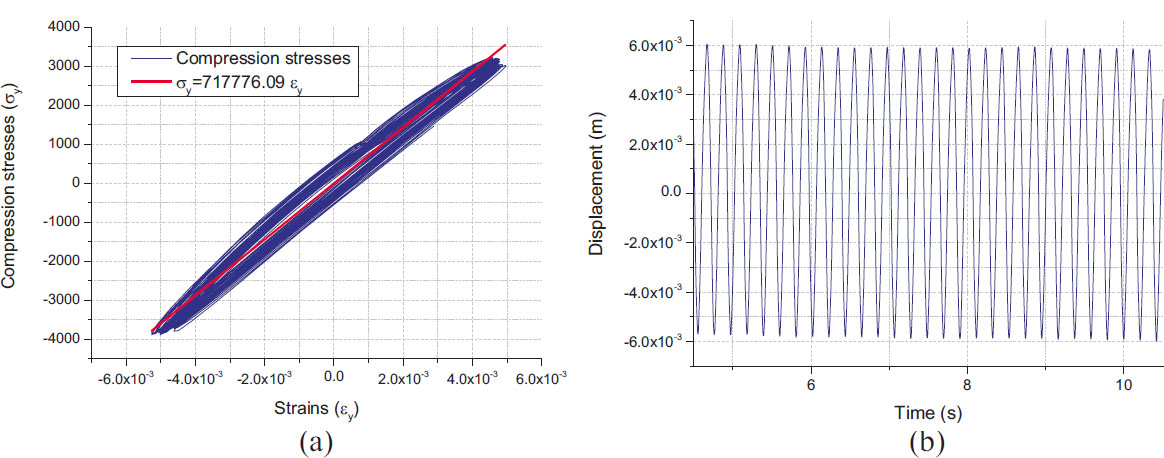
Dynamic response at the top layer of the sand deposit: (a) Hysteresis loops; (b) displacement time history under excitation amplitudes of 4×10⁻³m.
This dynamic softening is further corroborated by the displacement time histories shown in Figures 12b, 13b, 14b, 15b, 16b, and 17b. An examination of the steady-state wave propagation through the specimen shows that the displacement amplification factor in the upper soil layer (defined as the ratio of the surface displacement amplitude to the prescribed bedrock displacement amplitude) increases from 1.13 at an excitation amplitude of 1 × 10⁻⁴ m to a much higher value of 1.43 at an excitation amplitude of 1 × 10⁻³ m.
This increase in surface displacement amplification provides additional macroscopic evidence of the reduction in stiffness. As the material's stiffness degrades, its dynamic response becomes increasingly nonlinear, potentially leading to greater deformation and increased energy dissipation.
In Figure 18, the degradation of the oedometric modulus obtained from the DEM simulation is compared with the reference shear modulus degradation curve [26] and the experimental degradation curves reported in the literature [27, 28].
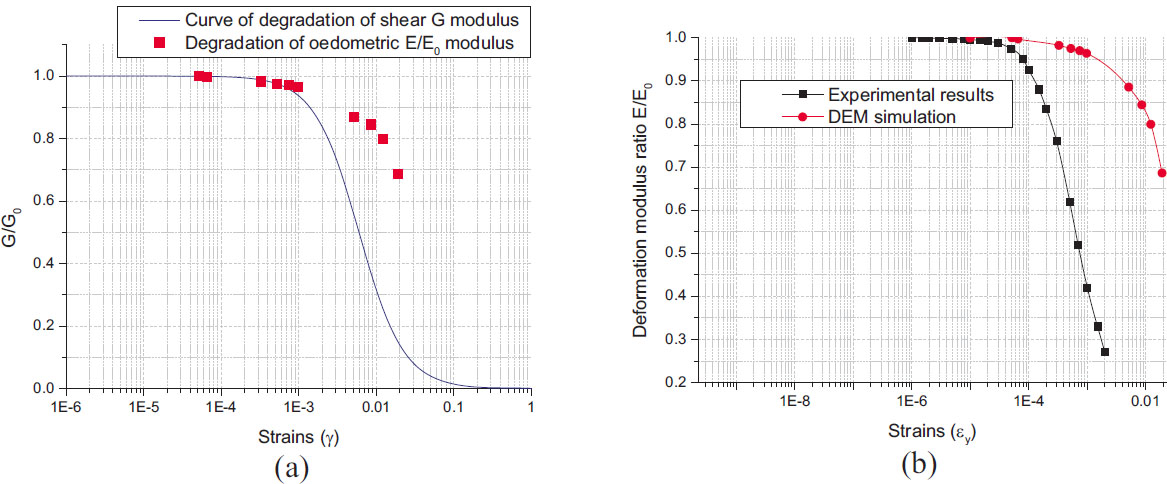
Figure 18a shows the progressive degradation of the oedometric modulus as a function of strain amplitude. This degradation is relatively mild and gradual compared with that of the reference shear modulus degradation curve. The difference in the degradation trends between the shear modulus and the oedometric modulus can be attributed to the distinct types of mechanical stiffness represented by these moduli. The shear modulus is associated with resistance to shear deformation, whereas the oedometric modulus is related to the soil’s stiffness under vertical compressive loading under constrained lateral conditions. The less pronounced degradation of the oedometric modulus observed in Figure 18a may reflect the different mechanical responses of the two moduli.
Figure 18b exhibits a progressive stiffness reduction with increasing deformation, in agreement with the experimental trend reported by [28]. A clear transition from a quasi-linear regime to a nonlinear response is observed at a deformation amplitude of approximately γ ≈ 10-4 which corresponds to the commonly reported threshold for the onset of nonlinearity in granular soils. Although the DEM curve displays slightly more gradual and less pronounced degradation than the experimental reference, the overall trend and the identified transition deformation amplitude support the reliability of the DEM simulations in analysing compression-wave propagation and capturing the main mechanisms governing modulus degradation. Specifically, at very low strain amplitudes, the modulus remains nearly constant, whereas higher strain levels induce nonlinear mechanisms such as interparticle sliding.
3.5. Damping Ratio Evolution (ξ)
The damping ratio (ξ) can be estimated from hysteresis curves by calculating the equivalent damping ratio, which is derived from the area enclosed by the hysteresis loop. In geomechanics and soil dynamics, this parameter is commonly used to characterize the energy dissipation capacity of granular materials subjected to cyclic loading.
The equivalent damping ratio is commonly used to characterise the energy dissipation capacity of granular materials subjected to cyclic loading.
The equivalent damping ratio ξ can be determined using the following expression Eq. (23):

where:
ΔW denotes the area of the hysteresis loop, representing the energy dissipated by the material during a loading–unloading cycle.
We is the maximum elastic deformation energy stored in the material, corresponding to the area under the secant line associated with the compression modulus E.
4π is a normalisation factor derived from the analogy with a damped harmonic oscillator.
Figure 19 illustrates the comparison between the evolution of the damping ratio (ξ) in the investigated sand profile and the experimental reference curve for shear wave propagation derived experimentally [27].
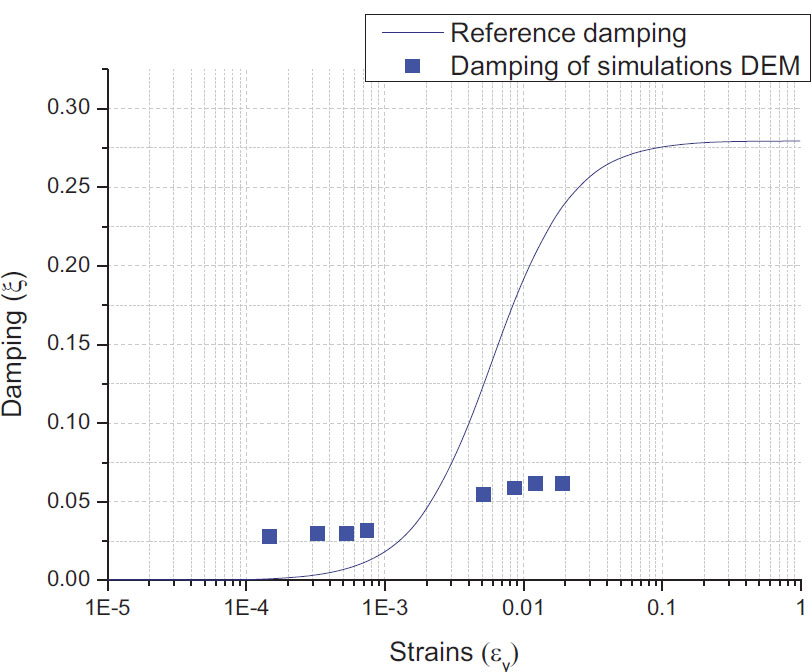
Variation of the damping ratio ξ.
Figure 19 shows a slight and gradual increase in the damping ratio (ξ) with increasing strain amplitude. Specifically, the damping ratio rises from 0.028 (2.8%) at a strain amplitude of approximately 10-4 to 0.0615 (6.15%) at a strain amplitude on the order of 10-2. This trend differs from from the reference shear damping curve, suggesting that the soil profile exhibits lower damping in compression than in shear. This behaviour can be attributed to the differences in the mechanical response and contact mechanisms mobilised during compression and shear loading.
CONCLUSION
In this study, a two-dimensional model of compression wave propagation through a granular material profile is developed using the Discrete Element Method (DEM). The micromechanical response of the granular assembly subjected to harmonic excitations applied at the bedrock was investigated through a series of numerical simulations. The dynamic behaviour of the medium was examined by analyzing several key parameters, including the estimation of the temporal evolution of displacements, motion amplification, oedometric modulus degradation, and variations in the damping ratio.
Furthermore, the oedometric modulus was estimated under low-amplitude excitations and compared with the corresponding values obtained from hysteresis loop analyses. The simulation determined the upper elastic limit via free-vibration at 83.8×10⁴ Pa, whereas the hysteresis-based secant modulus yielded a lower value of 82.7×10⁴Pa due to frictional energy dissipation at interparticle contact. The influence of confining pressure on the estimation of the elastic modulus E was also investigated, showing that higher confinement (10 kPa and 20 kPa) leads to increased stiffness in the soil profile.
The findings confirm the capability and reliability of the Discrete Element Method for simulating compression-wave propagation in granular media. The simulations demonstrated that the profile exhibits damped elastic behaviour, with motion amplification increasing with excitation amplitude, while confining pressure enhances the stiffness of the granular structure.
The degradation of the oedometric modulus and the variation in the damping ratio were analyzed in depth, revealing the different response phases as a function of the dynamic excitation amplitude. Crucially, the numerical simulations show a clear transition from a quasi-linear regime to a nonlinear response at a strain amplitude of approximately γ ≈ 10−4, which indicates the micromechanical threshold identified in this study for the onset of non-linearity in granular soil [9, 14, 23]. The observed relationship between the reduction of the oedometric modulus and the damping ratio sheds light on the micromechanical origins of the dynamic behavior of granular media. The results of his study demonstrated the ability of the Discrete Element Method (DEM) to reproduce the complex interaction between particle-scale dynamics and the macroscopic behavior of granular media subjected to compression-wave propagation.
It is essential to point out certain limitations of the current model. First, the use of idealised 2D circular particles inevitably neglects the complex geometric characteristics of angular and naturally shaped soil grains. Furthermore, this approach, which focuses on one-dimensional compression under oedometric conditions, does not allow for the consideration of multidirectional stress paths or the formation of localised shear bands. Clearly identifying these limitations is a crucial step in guiding future extensions towards fully three-dimensional (3D) simulation of soil dynamics.
AUTHORS’ CONTRIBUTIONS
The authors confirm their contribution to the paper as follows: S.D.: Contributed to the conception, writing, review, and editing of the manuscript, and developed the C++ code; H.A.: Participated in writing and reviewing the manuscript. All authors reviewed the results and approved the final version of the manuscript.
LIST OF ABBREVIATIONS
| DEM | = Discrete Element Method |
| 2D | = Two-Dimensional |
| 3D | = Three-Dimensional |
| C++ | = An extension of the C programming language with object–oriented features |
ACKNOWLEDGEMENTS
Declared none.
APPENDIX: Table of symbols.
| Symbol | Definition | Unit |
|---|---|---|
 |
Position vector | m |
 |
Acceleration vector | m/s2 |
| φ⃗i | Rotation vector | rad |
 |
Angular acceleration | rad/s2 |
| mi | Mass | kg |
| Ii | Moment of inertia | Kg.m2 |
|
Contact force | N |
|
Normal contact force | N |
|
Tangential contact force | N |
| Dn | Normal overlap | m |
| Ds | Tangential displacement | m |
| Vn | Normal relative velocity | m/s |
| Vs | Tangential relative velocity | m/s |
| kn | Normal stiffness | N/m |
| ks | Tangential stiffness | N/m |
| vn | Normal damping coefficient | kg/s |
| vs | Tangential damping coefficient | kg/s |
| μs | Static friction coefficient | – |
| μd | Dynamic friction coefficient | – |
| Mr | Rolling resistance moment | N.m |
| u(z, t) | Displacement | m |
| u0 | Excitation amplitude | m |
| ω | Angular frequency | rad/s |
| E | Oedometric modulus | Pa |
| E0 | Maximum oedometric modulus | Pa |
| σy cyc | Vertical cyclic stress | Pa |
| εy cyc | Vertical cyclic strain | - |
| ξ | Damping ratio | % |
| ρ | Density | kg/m3 |
| h | Soil layer depth | m |