All published articles of this journal are available on ScienceDirect.

Dynamic Response and Vibration Signature of Single Degree of Freedom Steel System
 iD
Rachid Derbal1 , 2
iD
Nassima Benmansour1
iD
Abderaouf Daci1
iD
Authors Info & Affiliations
Abstract
Introduction/Objective
Civil engineering structures face major challenges, particularly earthquakes, which are random phenomena in their intensity and frequency content. The seismic response of structures depends largely on the intensity of an earthquake and especially on its frequency content. The assessment of the dynamic behavior of structures subjected to seismic excitations is therefore essential for understanding their performance. The main objective of this study is the experimental identification of the vibration signature of a single-degree-of-freedom SDOF steel system.
Methods
Based on the laws of similarity, a 1:6 reduced-scale steel model is developed. In this context, dynamic experiments using the shaking table of the RISAM laboratory (Risk Assessment and Management: University of Tlemcen) are carried out to determine the structural dynamic parameters of this steel system. This is achieved through experimental determination of natural frequency and damping. Acceleration and displacement measurements are also established. The experimental estimation of damping is established using the logarithmic decrement method. Several dynamic analyses are carried out based on the finite element model of the reduced-scale steel system.
Results
The experimental investigations allowed the identification of the natural frequency, damping ratio, acceleration, and displacement response of the reduced-scale SDOF steel model. In addition, the numerical analyses showed a close agreement with the experimental measurements.
Discussion
The comparison between numerical and experimental investigations confirms the effectiveness of the adopted methodology in accurately reproducing the dynamic behavior of the steel system. The proposed experimental and numerical framework can therefore be considered a reliable approach for evaluating the seismic response of steel structures.
Conclusion
This study successfully identified the vibration signature and dynamic characteristics of an SDOF steel system through combined experimental and numerical analyses. The excellent correlation between the finite element results and shaking table experiments validates the proposed methodology and highlights its applicability for future seismic assessment studies of steel structures.
1. INTRODUCTION
Earthquakes are among the most complex and destructive natural hazards, capable of triggering severe structural damage within very short time intervals. Seismic risk arises from the interaction between the characteristics of ground motion and the susceptibility of the built environment. Previous studies have shown that structural damage may vary from localized inelastic deformations to complete structural collapse, often resulting in significant economic losses and casualties [1] [2, 3]. Accurately characterizing seismic loading remains a major scientific challenge, as it involves a complex combination of source effects, wave propagation phenomena, and local site conditions, all of which strongly influence the amplitude and frequency content of the seismic waves reaching structures [4-6].
In earthquake engineering, the dynamic response of structures is primarily controlled by key parameters such as natural frequency and damping ratio. Although advanced numerical techniques, including nonlinear finite element modeling, are widely used in engineering practice, they generally rely on simplified assumptions related to material behavior and boundary conditions. As highlighted in the literature, such models may have limitations in accurately capturing real energy dissipation processes and the effective stiffness of structural connections. For this reason, experimental investigations remain essential for validating numerical predictions and ensuring the reliability of structural performance assessments [7-9].
Full-scale experimental testing under seismic loading is, however, rarely feasible due to high costs, practical constraints, and the limitations of testing facilities. Consequently, reduced-scale modeling combined with shaking table experiments has become a widely adopted alternative [10, 11]. This methodology enables controlled reproduction of seismic excitations in laboratory environments. Its reliability depends critically on the proper application of similitude principles, which define the scaling relationships for geometric, inertial, stiffness, and temporal parameters, ensuring that the reduced model faithfully represents the behavior of the prototype.
Despite numerous studies involving shaking table testing of complex structural systems such as multi-story frames [12-14] or bridge piers [15, 16], there remains a lack of comprehensive investigations into the influence of experimental uncertainties on scaled steel models. Differences between theoretical predictions based on similitude laws and observed laboratory responses are frequently reported, mainly due to scale effects, where material characteristics and frictional behavior at connections do not follow linear scaling. This highlights the necessity of establishing robust methodological approaches to bridge the gap between theoretical design and experimental realization.
The present study addresses this issue by providing a thorough validation of a 1:6 reduced-scale steel model. Rather than relying solely on qualitative observations, this work quantitatively evaluates the consistency between theoretical similitude relationships and the experimentally identified vibrational response of a single-degree-of-freedom (SDOF) system. The model is specifically designed to match the operational constraints of the RISAM Laboratory shaking table at the University of Tlemcen, thereby offering a reliable experimental benchmark for future research.
The main objective of this study is to identify and validate the dynamic parameters of the SDOF steel system using a combined experimental and numerical framework. First, the similitude laws are rigorously established to guide the development of the reduced-scale model. Then, an experimental campaign is conducted, including forced vibration tests to determine the natural frequency and free vibration tests to estimate the damping ratio using the logarithmic decrement method. Finally, the experimental results are compared with those obtained from a refined finite element model. This integrated approach not only validates the proposed model but also provides a robust methodology for the analysis and scaling of more complex steel structures subjected to seismic loading.
2. MATERIALS AND METHODS
2.1. RISAM Shaking Table
The shaking table of the RISAM (Risk Assessment and Management) research laboratory at the University of Tlemcen is used to conduct the dynamic experiments in this study.
The shaking table platform measures 1.5 × 1.5 meters and can support a maximum mass of 2 tons. It has a single degree of freedom and a maximum acceleration range of ±1 g. The shaking table moves ± 0.25 m at a speed of 1 m/s, covers a frequency range from 0 to 50 Hz, and has a maximum force of 42 KN/m.
The operations of the RISAM shaking table are ensured using the hydraulic power unit (HPU) (Fig. 1a, b) and the servo-valve manifold (HSM) (Fig. 2a, b), which are connected to an MTS 793 digital control system and a 44-channel Stex-Pro data acquisition system (Fig. 3). Table 1 presents the general characteristics of the shaking table of the RISAM laboratory [17].
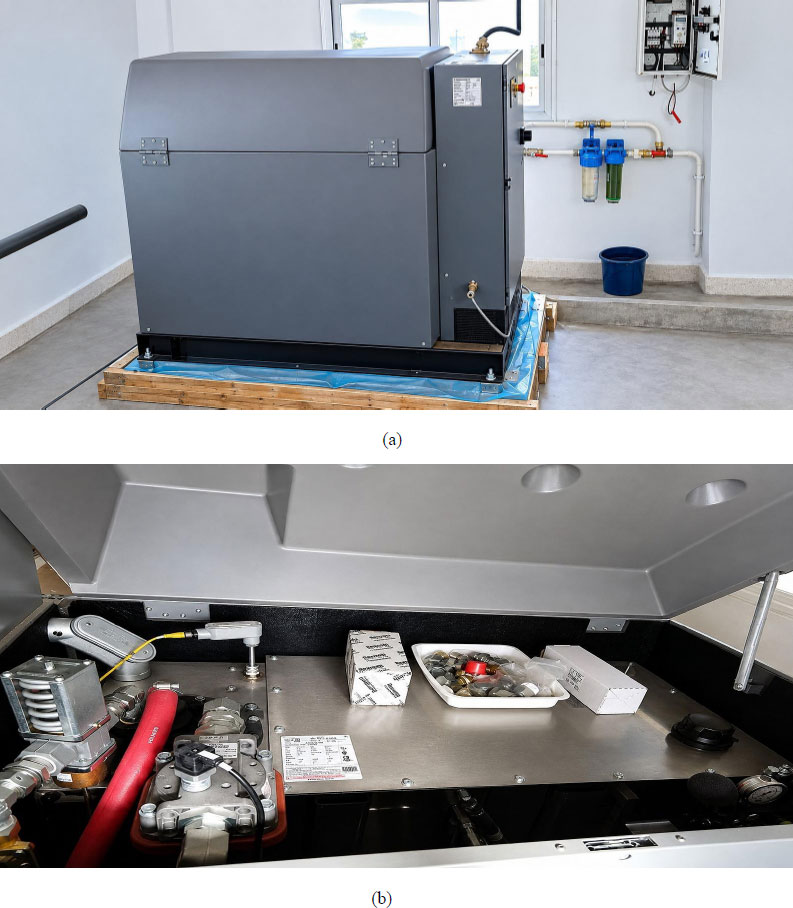
Hydraulic power unit (HPU) of the RISAM shaking table.
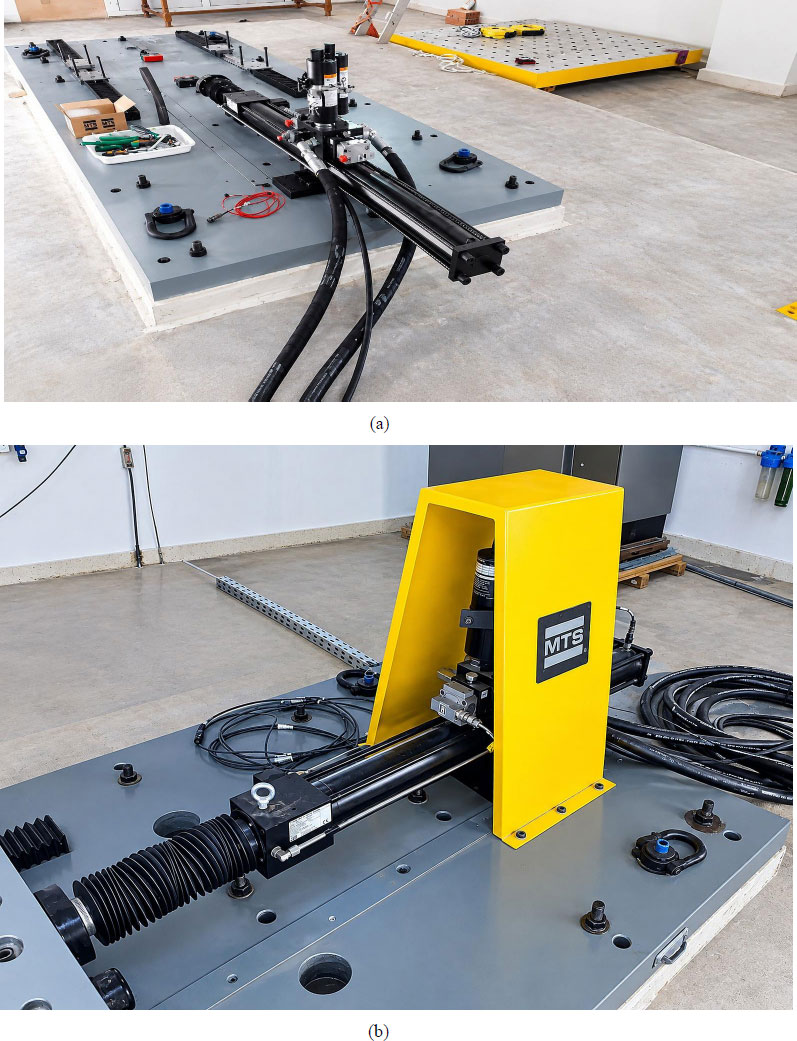
Servo-valve collector (HSM) of the RISAM shaking table.
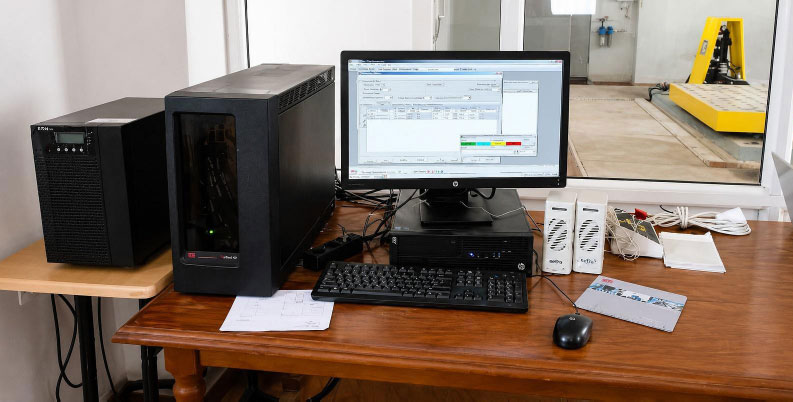
Data acquisition system of the RISAM shaking table.
| Table Dimensions | 1.5 × 1.5 m2 |
|---|---|
| Shaking direction | Unidirectional |
| Maximum specimen weight | 2 tons |
| Real-time bandwidth | 2048 Hz |
| Maximal acceleration | ±1.0 g |
| Maximal speed | ±1.0 m/s |
| Maximum displacement | ±0.25 m |
| Maximum actuator force | 42 KN |
| Maximum overturning moment | 10 tm |
| Operating frequency | 0-50 Hz |
2.2. Description of Reduced Scale Model
2.2.1. Similarity Laws
First, the laws of similarity were investigated to determine the most appropriate similitude ratios for the physical design of the reduced-scale model and the calculation of input parameters [11, 18, 19]. Then, the limitations of the RISAM shaking table in terms of weight and overturning moment capacity have also been considered in the design of this scale model.
Based on these considerations, a reduced-scale model of a single-degree-of-freedom (SDOF) steel system was developed using a geometric scale factor of 1:6. The prototype structure represents a steel portal frame with a height of 3 m and a span of 3 m. The similarity relationships were derived using the Buckingham PI theorem, enabling the identification of the governing dimensionless parameters of the system [20]. Three independent controlling factors, namely the length scale factor λL, the stress scale factor λσ, and the elastic modulus scale factor λE, were selected based on the geometric constraints of the experimental setup, the shaking table capacity, and the mechanical properties of the model material. All other scaling factors were subsequently derived from these fundamental parameters.
The similitude scale factors of the experimental model are summarized in Table 2.
| Parameter | Similarity Relation | Scaling Factor |
|---|---|---|
| Length | λL | 1/6 |
| Elasticity modulus E | λE | 1 |
| Specific mass | λρ | 1 |
| Time | λLλE-0.5λρ0.5 | 1/6 |
| Frequency | λL-1λE0.5λρ-0.5 | 6 |
| Acceleration | λL-1λEλρ-1 | 6 |
| Displacement | λL | 1/6 |
2.3. Construction of Structural Model
The 1:6 reduced-scale model of the steel system is constructed to be adapted to the motion direction of the shaking table. Indeed, this reduced model is free in one direction and rigidified in the other direction of the horizontal plane. The reduced-scale model is a single degree of freedom.
The reduced-scale steel frame was fabricated from S235 structural steel, with a nominal yield strength of fy = 235 MPa and an elastic modulus of E = 210 GPa. The beam-to-column connections, as well as the column-to-base-plate connections, were made by arc welding, with continuous fillet welds along the connection interfaces to ensure full moment continuity and to approximate rigid-frame behavior.
Figure 4a and 4b show the front and side views of the reduced-scale model fixed on the shaking table. The top beam has a thickness of 0.8 cm and a cross-section of 8 × 0.8 cm2, whereas each column has a cross-section of 8 × 0.3 cm2. Since the beam and the columns are fabricated from the same steel material, their relative flexural stiffness can be evaluated by comparing their second moments of area, which are calculated using the Eq. (1):
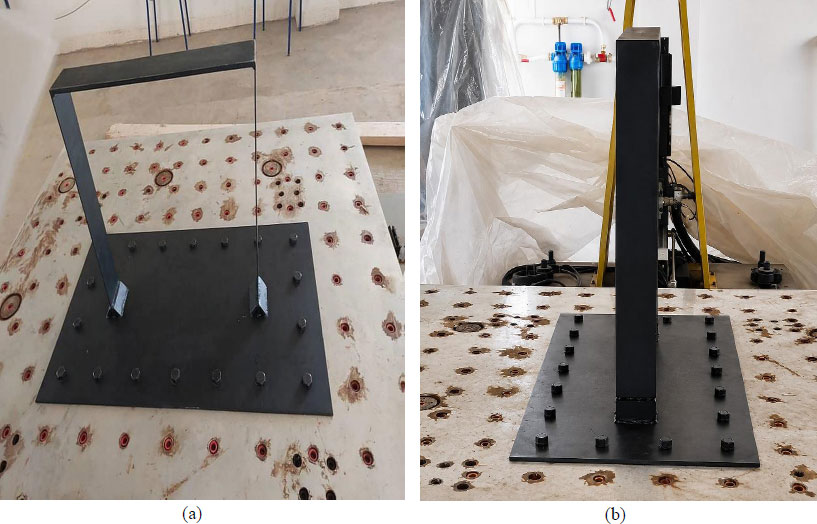
Reduced-scale model of the steel system. a) Frontal view, b) Lateral view.

where b is the section width and h is the thickness in the bending direction. Therefore, Ib for the beam, and Ic for each column.
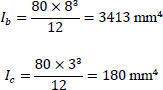
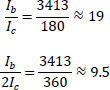
Consequently, the beam is approximately 19 times stiffer than a single column, or 9.5 times stiffer than the two columns acting together. This high stiffness ratio ensures that the beam undergoes negligible flexural deformation compared with the columns during the tests. Furthermore, the column geometry provides much greater stiffness in the transverse direction than in the longitudinal direction, corresponding to the excitation direction of the shaking table. Consequently, the lateral deformation is mainly concentrated in the columns, allowing the experimental model to be reasonably idealized as a single-degree-of-freedom (SDOF) system.
The model is welded to a steel base plate, measuring 85 cm in length and 50 cm in width. Eighteen bolts are used to ensure the fixation of the base plate supporting the reduced model to the shaking table. Figure 5a, b illustrates all dimensions of the SDOF reduced-scale model.
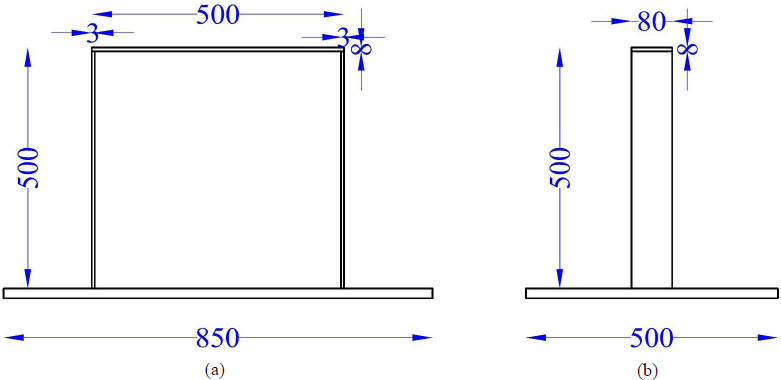
Geometric characteristics of the steel system prototype. a) Frontal view, b) Lateral view.
2.4. Data Acquisition System
The experimental tests are carried out using the RISAM shaking table at the University of Tlemcen. The Setra model 141 accelerometer and the CDP-100 displacement sensors record data in terms of accelerations and displacements, respectively (Fig. 6a, b). These sensors are fixed to the reduced-scale model, as shown in Fig. (7a, b).
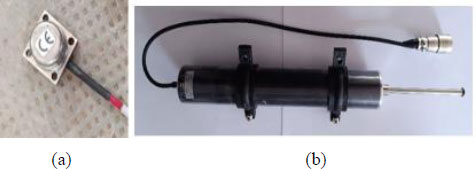
Accelerometer (a) and displacement (b) sensors.
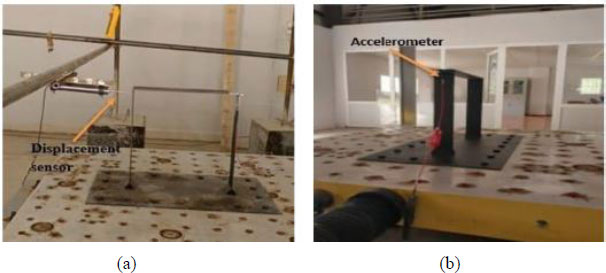
Arrangement of the accelerometer (a) and displacement (b) sensors.
2.5. Experimental Methodology
Using the RISAM shaking table, several dynamic tests are performed for the 1:6 reduced-scale model of the steel system as harmonic forced and harmonic free vibrations. The acceleration and displacement sensors fixed to the reduced model are used to record results.
The experimental tests are carried out by accomplishing the following steps:
(1) Fixing the reduced model to the RISAM shaking table using the eighteen bolts.
(2) To verify the reliability of the acceleration measurements, it is important to compare the results of the Setra 141 accelerometer (mobile) and the accelerometer integrated into the RISAM shaking table (fixed). To do this, the Setra 141 accelerometer should be placed beside the fixed accelerometer of the shaking table. The results of the two accelerometers must be identical.
(3) Attach the accelerometer and displacement sensors to the top of the reduced model to measure the response in terms of acceleration and displacement.
(4) Perform a harmonic forced vibration test on the reduced model at different frequencies.
(5) Collect measurements of accelerations and displacements and compare them with the numerical model results.
(6) Next, free vibration tests are carried out to determine the dynamic characteristics of the system, such as natural frequency and vibration damping.
2.6. Assessing the Effectiveness of Equipment
Before any experiment or test, it is important to thoroughly check all the equipment and instruments involved. This check ensures that the tools used are working properly and capable of providing accurate and reproducible measurements.
First, the accelerometer sensor Setra 141 is positioned on the shaking table, and then a harmonic signal is applied (Fig. 8). The measured acceleration by the accelerometer built into the shaking table and the mobile accelerometer Setra 141 must be compared. Also, the measured displacement that was imposed on the table must be validated. The recorded results in terms of acceleration and displacement must be perfectly identical.
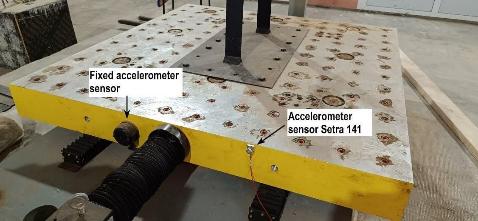
Procedure for accelerometer sensor validation on the shaking table.
Figure 9 shows the parameters of the imposed harmonic signal, namely the amplitude and frequency.
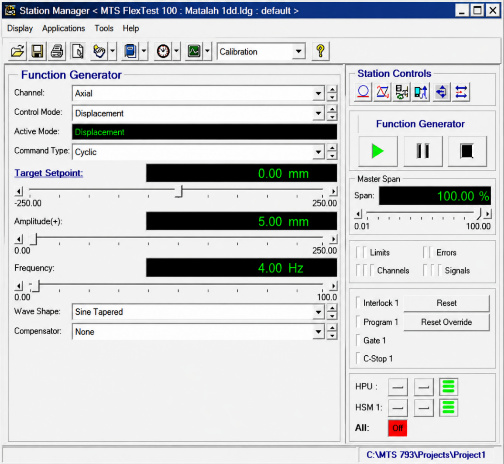
Characteristics of imposed harmonic signal.
with:
- UgO= 0.5 cm
- ω corresponds to a frequency f = 4 Hz.
Figure 10 shows the variation of imposed and measured displacements of the shaking table with time. Figure 11 illustrates the measured accelerations by the accelerometer built into the shaking table with the mobile accelerometer Setra 141. It can be seen that the two curves are similar. These results demonstrate the reliability of the shaking table and Setra 141 accelerometer sensors.
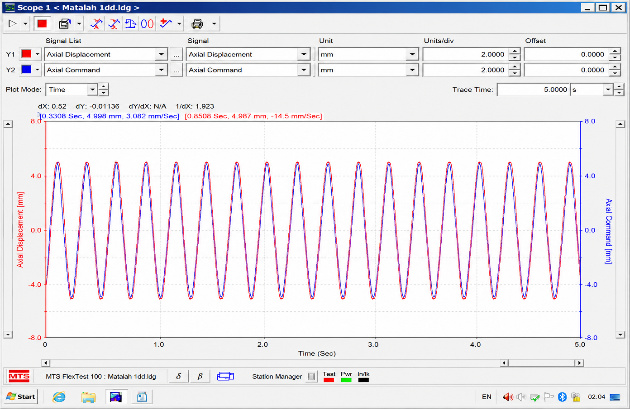
Variation of the imposed displacement on the table with the measured one.
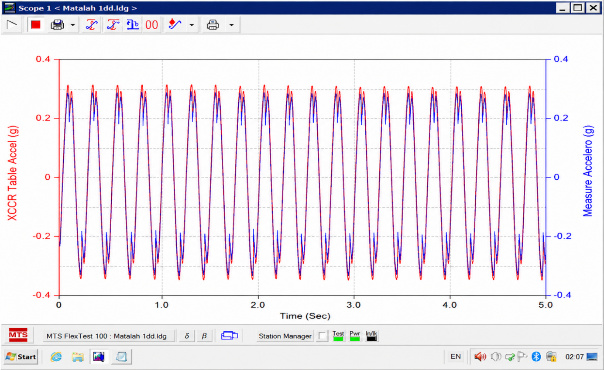
Variation of accelerations measured by the built-in accelerometer and the external accelerometer.
2.7. Finite Element Analysis
A three-dimensional finite element model of the reduced-scale SDOF steel frame was developed using MIDAS Gen 2023 software. Based on the material properties of the reduced-scale model, namely the Young's modulus, density, and Poisson's ratio, a three-dimensional numerical model was established (Fig. 12). The structural members were modeled using three-dimensional frame elements, which are particularly suitable for slender steel members whose behavior is mainly governed by axial and bending actions. The boundary conditions were defined as a perfectly fixed base to reproduce the experimental configuration, where the steel frame was rigidly attached to the shaking table through a bolted steel base. Table 3 summarizes the material properties adopted in the finite element model, including the density (ρ), mass (m), Young's modulus (E), and Poisson's ratio (ν).
| ρ (Kg/m3) | Mass (Kg) | E (Kpa) | ν |
|---|---|---|---|
| 7866.33322 | 3.4461 | 2.1E+08 | 0.3 |
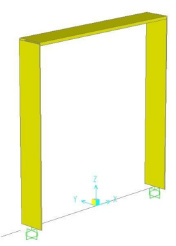
3D Finite element model.
A modal analysis was then performed using the finite element model to determine the dynamic characteristics of the reduced-scale structure. The first vibration mode, together with the corresponding natural period and natural frequency, is presented in Fig. (13).
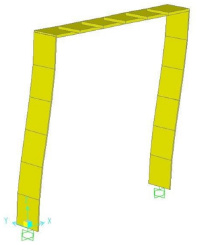
The deformed shape of the finite element model.
(1st mode: T = 0.139 s; f = 7.194 Hz).
3. RESULTS AND DISCUSSION
First, harmonic forced vibration tests are used to measure the dynamic response of the reduced-scale model of the steel system in terms of acceleration and displacement through external sensors. Then, the dynamic response of the finite element model is calculated under harmonic forced numerical signals. The experimental and numerical results are compared.
Finally, the measurement of the real damping of the steel system through the 1:6 reduced-scale model is performed by adopting harmonic free vibration tests.
3.1. Harmonic Forced Vibration Test
In this section, harmonic forced loadings are applied to the scale model, adopting different frequencies. The dynamic response in terms of acceleration and displacement is measured. A minimum of two tests are carried out for the dynamic response measurement.
3.1.1. Acceleration Measurement
According to Eq. (2), two harmonic forced tests are realized by adopting the following parameters:
- 1st harmonic forced test: Amplitude: UgO = 0.5 cm and frequency: f = 4 Hz.
- 2nd harmonic forced test: Amplitude: UgO = 0.5 cm and frequency: f = 2 Hz.
Figure 14a, b show the acceleration measured experimentally and numerically for the first harmonic forced test, and (Fig. 15a, b) illustrate the experimental and numerical acceleration measurements for the second harmonic forced test.
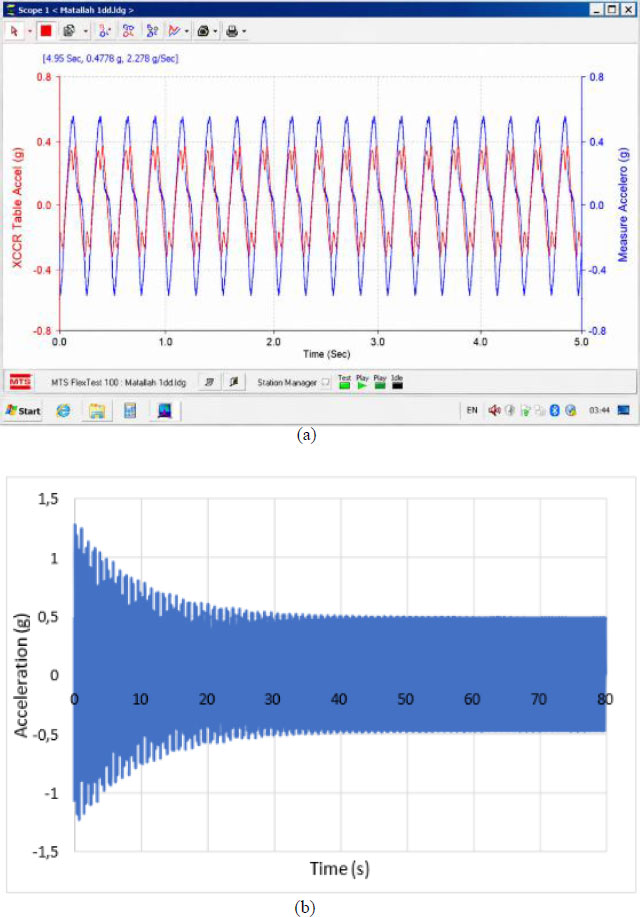
Dynamic response in acceleration under harmonic forced vibrations (1st Test) a) Experimentally measured, b) Numerically calculated.
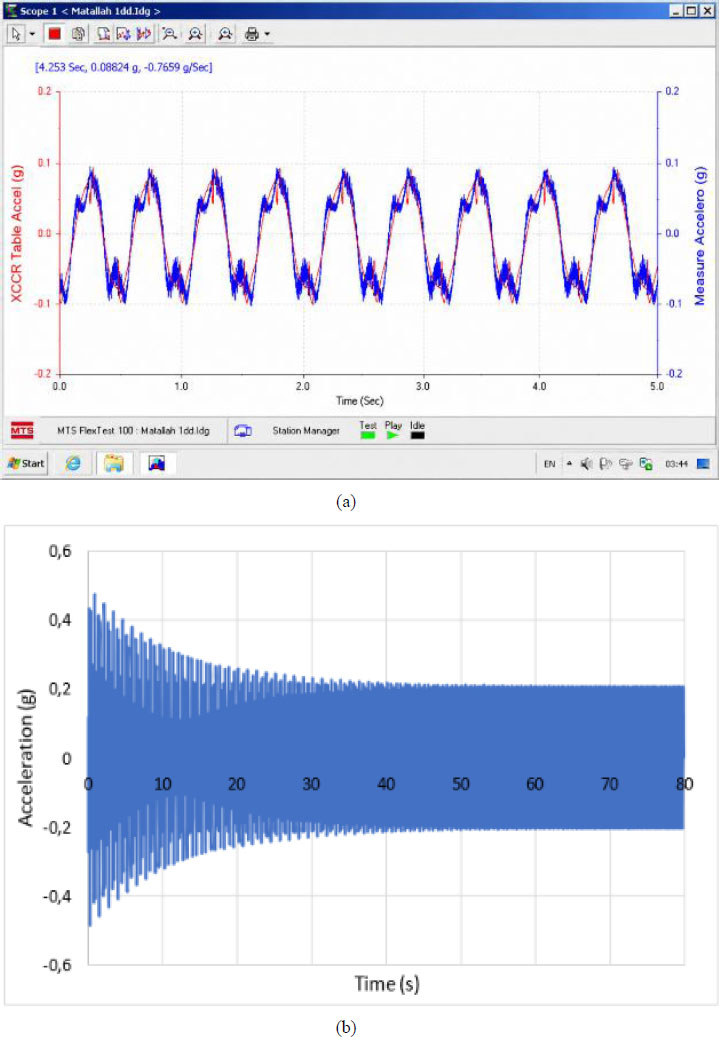
Dynamic response in acceleration under harmonic forced vibrations (2nd Test) a) Experimentally measured, b) Numerically calculated.
Table 4 shows the maximum permanent accelerations to illustrate the comparison between the acceleration measured experimentally and numerically. It can be observed that the experimentally measured maximum accelerations are in good agreement with the numerical results.
|
Experimental Acceleration (g) |
Numerical Acceleration (g) |
RMSE (g) | R2 | |
|---|---|---|---|---|
| Test 01 | 0.44 | 0.48 | 0.028 | 0.974 |
| Test 02 | 0.088 | 0.089 |
A quantitative assessment of the agreement between the experimental and numerical acceleration responses was carried out using statistical indicators. The root mean square error (RMSE) was found to be 0.028 g, indicating a small discrepancy between the measured and predicted values. In addition, the coefficient of determination (R2) reached 0.974, demonstrating a strong correlation between the experimental results and the numerical simulations.
These results confirm that the finite element model is capable of accurately reproducing the acceleration response of the reduced-scale system.
3.1.2. Measurement of Displacement
Based on amplitudes and frequencies shown in Eq. (2), two harmonic forced tests are adopted to obtain the measured displacement experimentally and the calculated displacement numerically as follows:
- 1st harmonic forced test: Amplitude: UgO = 0.5 cm and frequency: f = 4 Hz.
- 2nd harmonic forced test: Amplitude: UgO = 0.5 cm and frequency: f = 10 Hz.
Figures 16a, b, and 17a, b represent the variation in displacement measured experimentally and numerically for the first and second tests, respectively. The maximum displacement measured experimentally is almost equal to that calculated numerically (Table 5).
|
Experimental Displacement (mm) |
Numerical Displacement (mm) |
RMSE (mm) | R2 | |
|---|---|---|---|---|
| Test 01 | 2.417 | 2.37 | 0.085 | 0.976 |
| Test 02 | 1.32 | 1.21 |
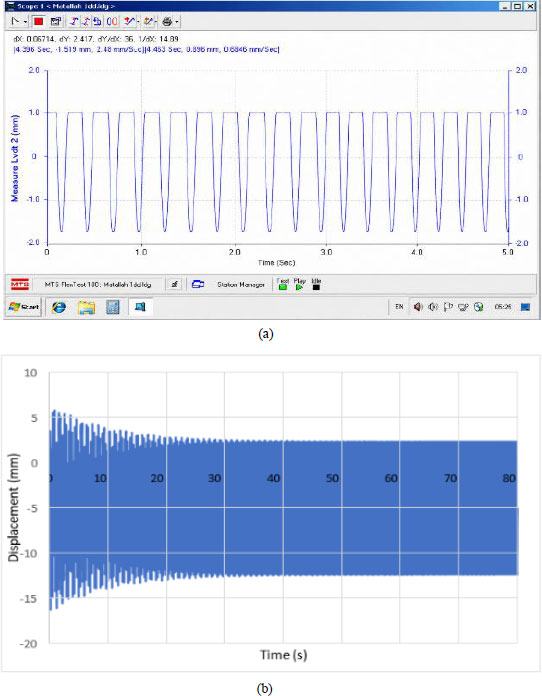
Dynamic response in displacement under harmonic forced vibrations (1st Test) a) Experimentally measured, b) Numerically calculated, (Source: Authors).
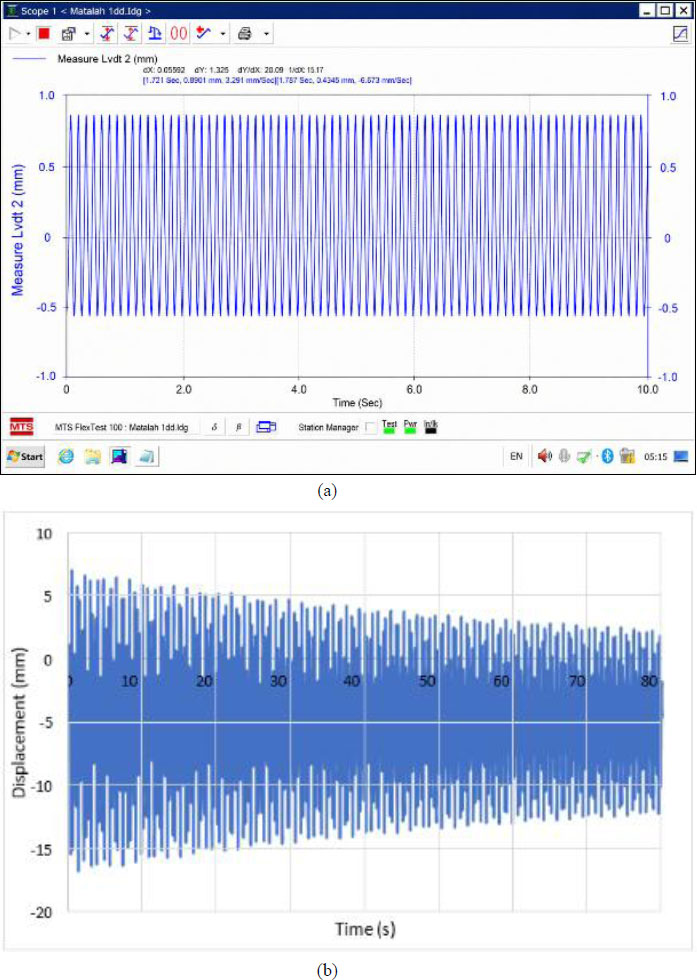
Dynamic response in displacement under harmonic forced vibrations (2nd Test) a) Experimentally measured, b) Numerically calculated, (Source: Authors).
A statistical analysis was performed to assess the consistency between experimental measurements and numerical predictions of displacement. The computed root mean square error (RMSE) is equal to 0.085 mm, reflecting a limited deviation between the two datasets. In addition, the coefficient of determination (R2) was found to be 0.976, indicating a high degree of correlation between the experimental observations and the results obtained from the numerical model.
These findings confirm that the finite element approach provides an accurate representation of the displacement behavior of the reduced-scale structure. The larger discrepancy observed in Test 02 can be explained by the higher sensitivity of displacement measurements to experimental factors, in particular, the accuracy of the mechanical sensors.
3.2. Free Vibration Test
In order to identify the dynamic parameters of the reduced-scale model, including the damped natural frequency and the damping ratio, free vibration responses were obtained following harmonic excitation tests. The experimental procedure consists of initially subjecting the model to a harmonic base excitation using the shaking table.
To perform these tests, harmonic signals (Eq. 2) with different amplitudes and frequencies were applied to the reduced-scale model. After reaching steady-state conditions, the excitation was abruptly stopped, allowing the system to vibrate freely. The resulting free decay response was then analyzed to extract the dynamic parameters.
Three excitation cases were considered:
- 1st test: Amplitude: UgO = 0.5 cm and frequency: f = 4 Hz.
- 2nd test: Amplitude: UgO = 0.5 cm and frequency: f = 2 Hz.
- 3rd test: Amplitude: UgO = 0.1 cm and frequency: f = 4 Hz.
Figures 18, 19, and 20 illustrate the dynamic response in terms of acceleration of the first, second, and third tests, respectively.
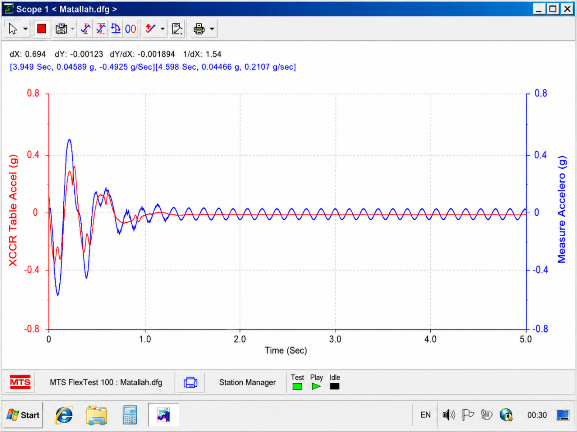
Variation of acceleration in free vibration (1st Test).
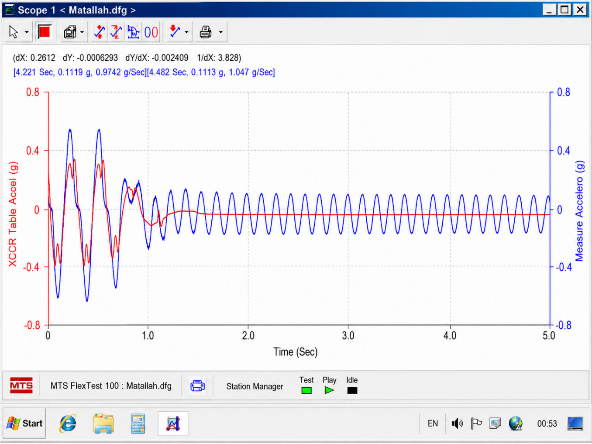
Variation of acceleration in free vibration (2nd Test).
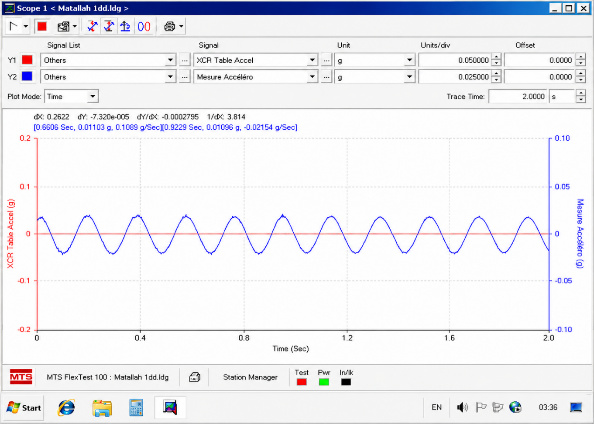
Variation of acceleration in free vibration (3rd Test).
Based on the results of these free vibration tests following harmonic excitation, the damped fundamental frequencies and the damping ratio are calculated by adopting the logarithmic decrement method [21, 22]. For the first test, (Fig. 18) shows the two peaks selected.
The damped period of free vibration, Td, is defined as follows Eq. (3):
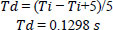
Where:
Ti is the period of the i-th cycle, and Ti+5 is the period of the i+5) -th cycle.
The two accelerations at the two peaks are:
 = 0.04589g and
 = 0.04466g.
Using these two accelerations, the logarithmic decrement is calculated according to Eq. (4):

So, the damping is then obtained from the logarithmic decrement using Eq. (5):
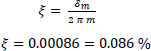
The damped pulse ωd is equal to: ωd = 48.406 rad/s
The natural pulse ωn obtained from Eq. (6):
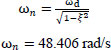
The natural period Tn, is subsequently calculated from the natural angular frequency using Eq. (7):

Rigidity is then calculated using Eq. (8) on the basis of the mass already estimated:
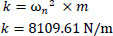
Finally, the damping ratio is determined using Eq. (9):
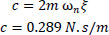
Table 6 summarizes the results of the dynamic parameters for the three free vibration tests.
| Test 01 | Test 02 | Test 03 | |
|---|---|---|---|
| Ti(s) | 4.598 | 4.482 | 0.9229 |
| Ti+n(s) | 3.949 | 4.221 | 0.6606 |
| Td(s) | 0.1298 | 0.1305 | 0.1311 |
| U.1(g) | 0.04589 | 0.1119 | 0.01103 |
| U.2(g) | 0.04466 | 0.1113 | 0.01096 |
| δm | 0.02716 | 0.00537 | 0.00636 |
| ξ | 0.000864 | 0.000427 | 0.000506 |
| ωd (rad/s) | 48.4066 | 48.1470 | 47.9083 |
| ωn (rad/s) | 48.4066 | 48.1470 | 47.9083 |
| Tn(s) | 0.129 | 0.130 | 0.131 |
| fn(s) | 7.752 | 7.692 | 7.634 |
| k (N/m) | 8109.8398 | 8023.0665 | 7943.7370 |
| c (N.s/m) | 0.2897 | 0.1425 | 0.1680 |
The mean damping ratio is 0.06%, corresponding to a damped frequency of 7.692 Hz. Comparing this experimental frequency with the numerical one, shown in Fig. (13), gives practically equivalent values.
As reported in Table 7, the natural frequency of the first mode exhibited a standard deviation of 0.059 Hz and a standard error of the mean (SE) of 0.034 Hz, corresponding to a coefficient of variation (CV) of 0.77%. In comparison, the damping ratio exhibited a standard deviation of 2.33 × 10⁻⁴ and an SE of 0.0134%, resulting in a substantially higher CV of 38.9%. The markedly greater dispersion of the damping ratio compared with the natural frequency is consistent with the greater sensitivity of damping identification to measurement noise, the selected free-decay interval, and the amplitude dependence of energy dissipation. Nevertheless, the three repeated measurements provide only a preliminary assessment of this variability and should not be regarded as sufficient for a comprehensive statistical characterization of the damping parameter.
| Test 01 | Test 02 | Test 03 | Mean | SD | SE | CV | |
|---|---|---|---|---|---|---|---|
| ξ | 0.000864 | 0.000427 | 0.000506 | 0.0599 | 0.0233 | 0.0134 | 38.88% |
| fn(s) | 7.752 | 7.692 | 7.634 | 7.692 | 0.059 | 0.034 | 0.77% |
The identified damping ratio is considerably lower than the values commonly reported for full-scale steel structures, for which damping ratios are typically reported in the range of 2–5%. This discrepancy is mainly attributed to the experimental conditions adopted during the free vibration tests following harmonic excitation, which were conducted at very low excitation amplitudes. In this low-intensity vibration regime, the model exhibits strictly elastic behavior, thereby limiting dissipative mechanisms such as internal friction, micro-cracking, or contact nonlinearities, which contribute significantly to damping in real structures. In addition, the beam-to-column connections of the reduced-scale SDOF steel frame were fully welded, while the base was rigidly bolted to the shaking table, resulting in very limited frictional energy dissipation. Unlike full-scale steel frames, which generally contain semi-rigid connections, connection slip, non-structural elements, and other friction-related energy dissipation mechanisms, the present experimental model was intentionally designed to minimize these effects. Consequently, the measured damping ratio primarily represents the inherent material and structural damping of the steel frame rather than the equivalent damping commonly reported for full-scale steel frame structures (2–5%).
This trend is consistent with results reported for comparable reduced-scale SDOF steel specimens tested on shaking tables. For instance, a 1:6 scale SDOF steel frame model equipped with a viscous damper exhibited a damping ratio of about 2% identified from free vibration tests [23], while an alternative estimation approach validated on single- and two-story steel frame models subjected to low-amplitude ground motions confirmed that damping ratios remain considerably lower than the conventional 2–5% design range when the structure is excited at low amplitude and idealized as an SDOF system [24]. These findings support the amplitude-dependent damping behavior widely reported for steel structures, where damping increases progressively with excitation amplitude and associated deformation level, as discussed in the equivalent modal damping framework of [25]. Part of the remaining discrepancy between the present measurement and full-scale reference values may also relate to inherent limitations of the damping identification method itself, since classical bandwidth-based techniques such as the half-power method can introduce non-negligible estimation errors, particularly for systems departing from ideal single-mode behavior [26]. Overall, this comparison confirms that the low damping ratio obtained in the present study is not an isolated or anomalous result, but a value consistent with the low-amplitude regime under which the tests were conducted.
3.3. Frequency Response Function (FRF)
The Frequency Response Function (FRF) is defined as the ratio between the cross-power spectral density of the system response and the excitation, Syx(ω), and the power spectral density of the excitation, Sxx(ω), as follows [27, 28]:

This formulation, given by Eq. (10), enables a comprehensive characterization of the dynamic behavior of the structure in the frequency domain.
To perform this analysis, a white noise excitation was applied to the structure using the shaking table. Figures 21 and 22 present the acceleration response of the structure and the corresponding excitation signal, respectively. The resulting FRF, shown in Fig. (23), exhibits a clear resonance peak corresponding to the fundamental frequency of the system, which defines its vibration signature.
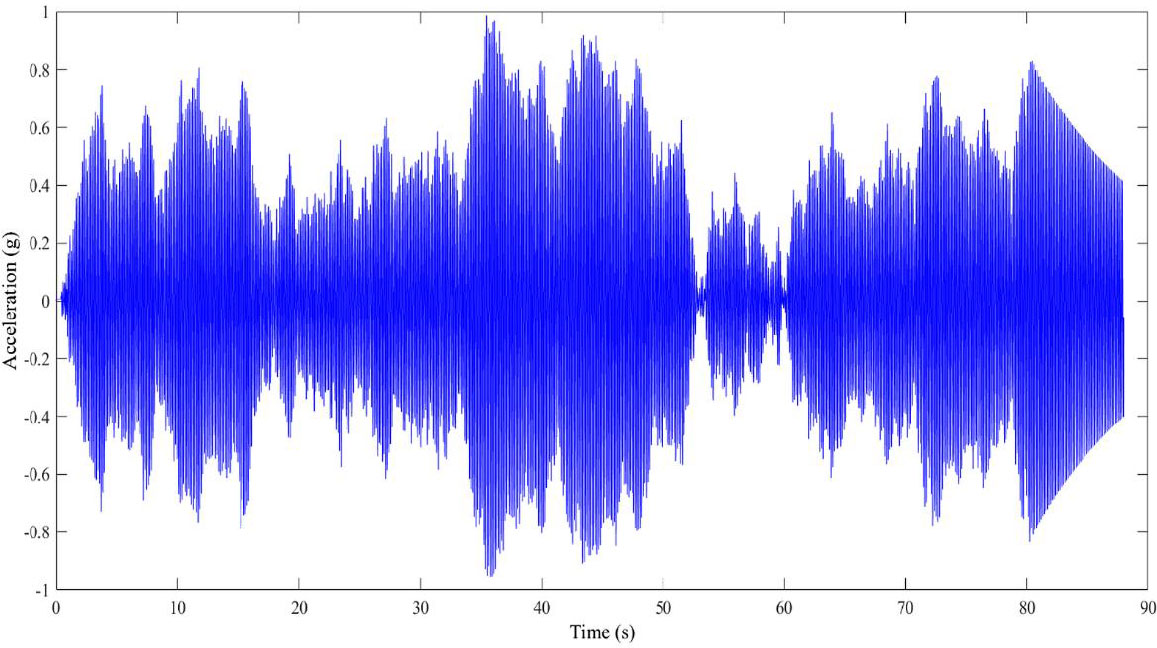
Acceleration response of the structure.
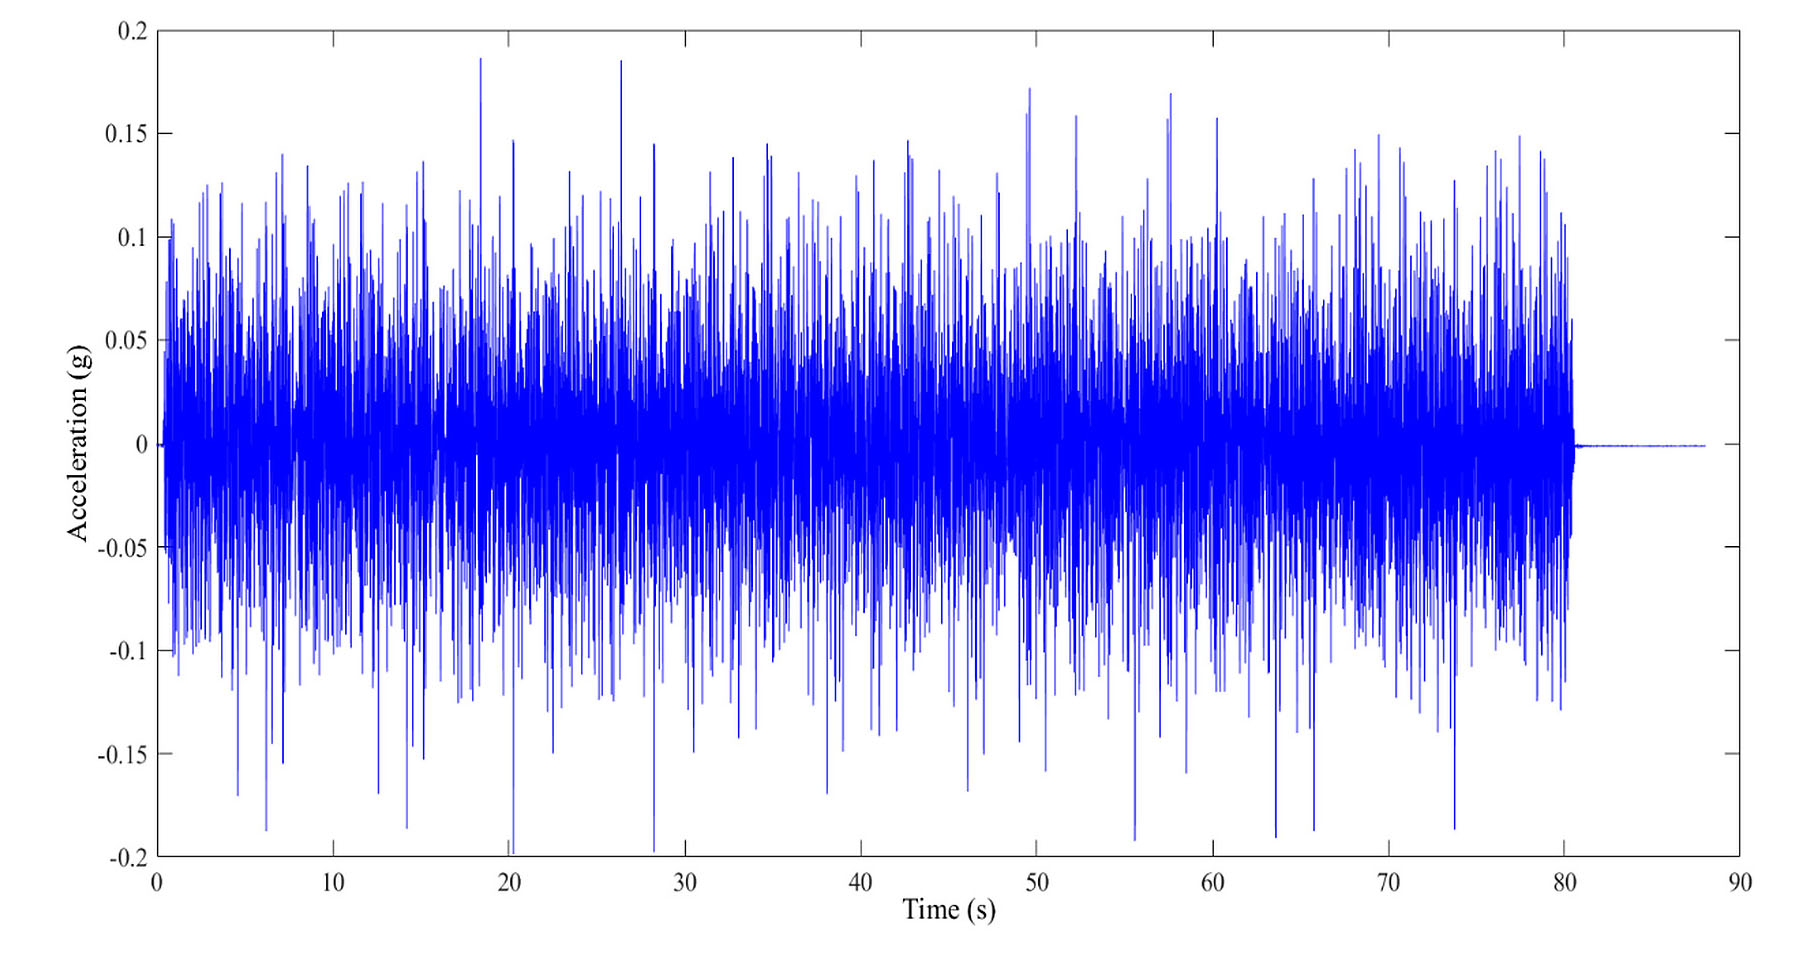
Acceleration signal of the white noise excitation.
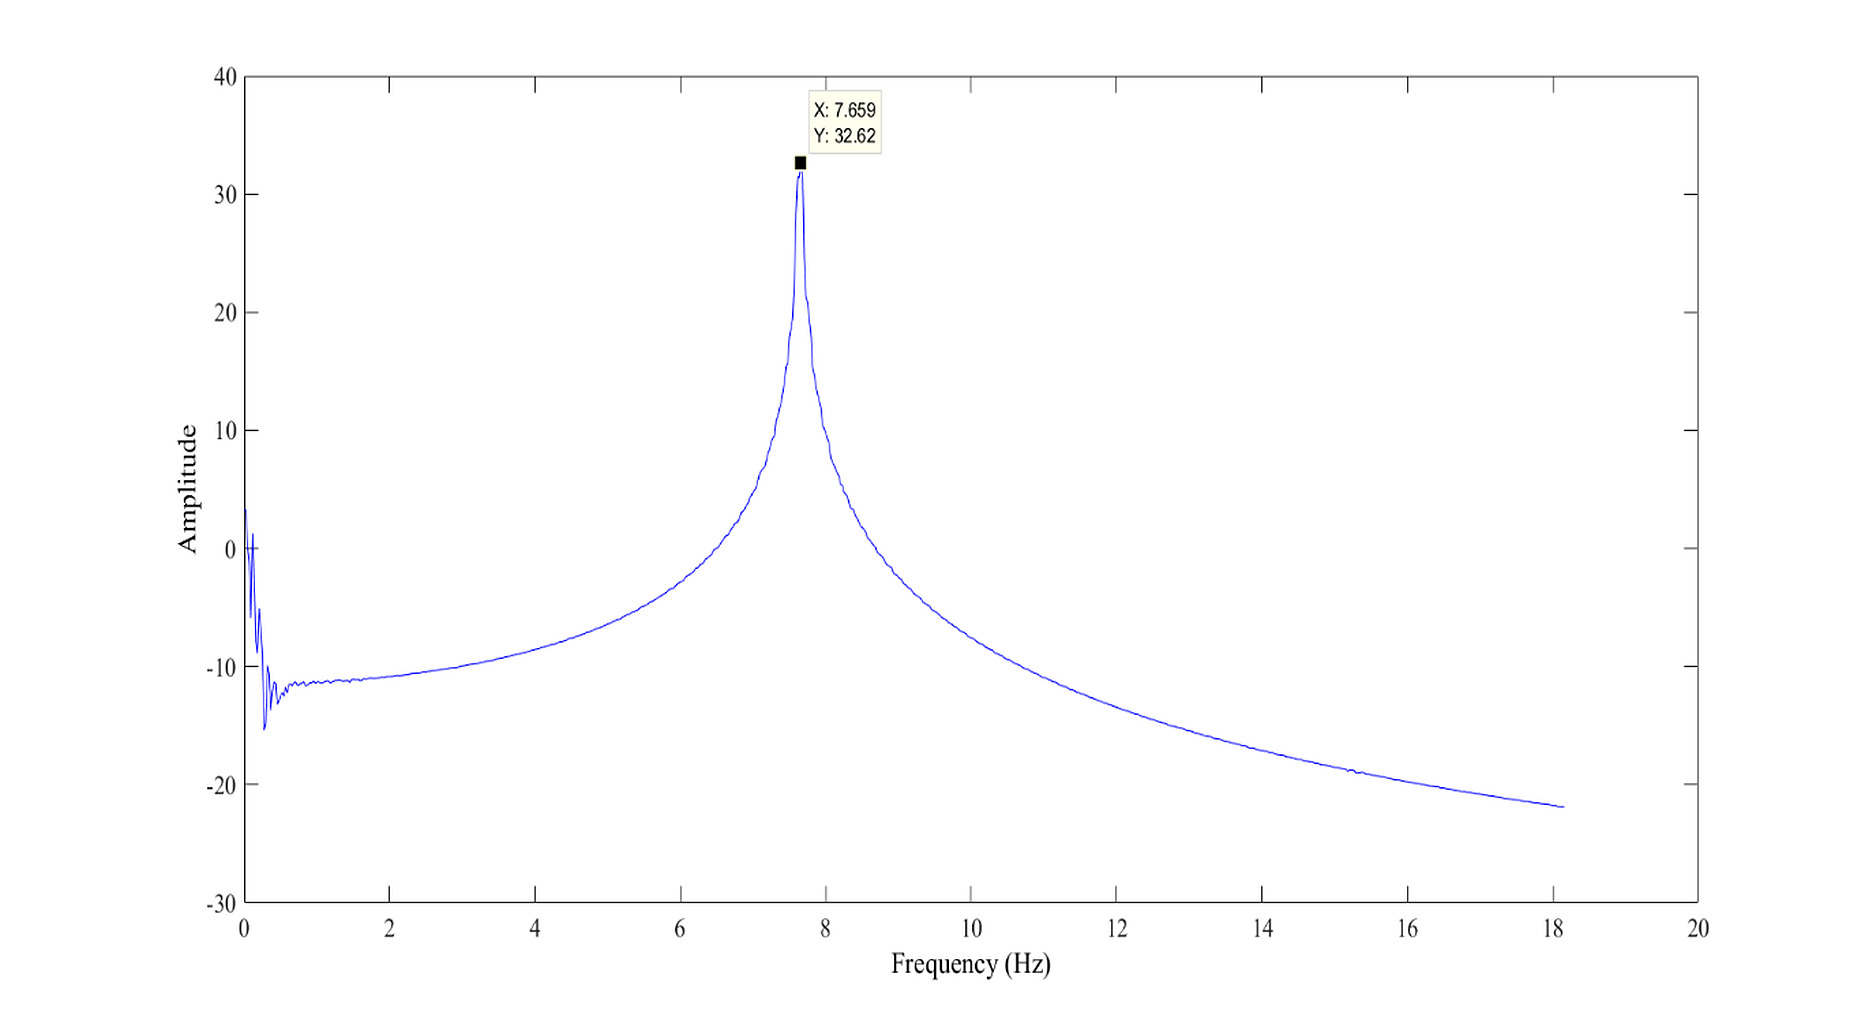
Frequency Response Function (FRF) of the reduced-scale steel model.
The resonance frequency identified from the FRF analysis is f = 7.659 Hz, while the value obtained using the logarithmic decrement method is f = 7.692 Hz. The relative difference between the two estimates is approximately 0.4%, indicating an excellent agreement between the two identification approaches. This consistency confirms the reliability of the determined fundamental frequency and strengthens the validity of the vibration signature of the system.
4. STUDY LIMITATIONS
The present study has several limitations that should be taken into account when interpreting its results. Despite the good agreement between the experimental and numerical results, the investigation is limited to a 1:6 reduced-scale SDOF steel system and a specific range of excitation conditions. The low excitation amplitudes used during the free-vibration tests may also influence the measured damping ratio and limit its direct comparison with full-scale steel structures. These limitations should be considered when extending the present findings to more complex structural configurations and full-scale applications.
CONCLUSION
In this study, the vibration signature identification of a single-degree-of- freedom SDOF steel system is performed. Based on similarity laws, a 1:6 reduced- scale model is constructed. The shaking table of the RISAM laboratory (Risk Assessment and Management) at the University of Tlemcen is used to conduct experimental dynamic tests.
A finite element model of the reduced-scale system was developed and compared with experimental measurements of acceleration and displacement obtained under harmonic forced vibrations. Under harmonic free vibrations, the damped frequency and damping ratio were determined experimentally using the logarithmic decrement method, yielding a damping ratio of ξ = 0.06% and a damped frequency of f = 7.692 Hz.
The comparison between numerical and experimental results showed a strong correlation, with coefficients of determination of R2 = 0.974 for maximum acceleration and R2 = 0.976 for maximum displacement, confirming good agreement between the two approaches within the tested frequency range. These results confirm the validity and effectiveness of the RISAM shaking table for determining the dynamic parameters of structures that are put to the test.
The damping ratio obtained (ξ = 0.06%) using the logarithmic decrement method is relatively low compared to values commonly reported in the literature for similar steel systems (typically in the range of 2–5%). This difference is mainly attributed to the experimental conditions adopted during the free vibration tests following harmonic excitation, which were carried out at very low excitation amplitudes, as well as to the type of connections used.
Future research will focus on extending the proposed methodology to more representative structural configurations, including multi-degree-of-freedom (MDOF) steel frames subjected to different seismic excitations. Additional investigations will also address nonlinear dynamic behavior under higher excitation levels, the influence of connection details and damping mechanisms, and the validation of the numerical model through complementary experimental campaigns. These developments will contribute to improving the understanding of the dynamic behavior of reduced-scale steel structures and to enhancing the reliability of numerical predictions for seismic applications.
AUTHORS’ CONTRIBUTIONS
The authors confirm their contributions to the paper as follows: A.B., R.D., and N.B.: Contributed to conceptualization and methodology; A.B. and A.D.: Performed formal analysis and data curation; A.B., R.D., and A.D.: Carried out the investigation, provided resources, prepared the original draft, conducted review and editing, and handled visualization; N.B.: Supervision was provided. All authors have read and agreed to the published version of the manuscript.
LIST OF ABBREVIATIONS
| FRF | = Frequency Response Function |
| HPU | = Hydraulic Power Unit |
| HSM | = Hydraulic Servo-Valve Manifold |
| I | = Moment of inertia |
| MTS | = Mechanical Testing and Simulation |
| RISAM | = Risk Assessment and Management |
| RMSE | = Root Mean Square Error |
| SD | = Standard Deviation |
| SE | = Standard Error |
| CV | = Coefficient of variation |
| SDOF | = Single-Degree-of-Freedom |
| R2 | = Coefficient of Determination |
| Ug | = Ground displacement |
| UgO | = Amplitude of the imposed ground displacement |
| ω | = Angular frequency |
| t | = Time |
| f | = Frequency |
| ρ | = Density |
| ν | = Poisson's ratio |
| E | = Young's Modulus |
| Td | = Damped Period |
| U. | = Acceleration |
| ξ | = Damping ratio |
| ωd | = Damped Pulse |
| ωn | = Natural Pulse |
| Tn | = Natural Period |
| k | = Rigidity |
| Syx (ω) | = Cross-Power Spectral Density between the system response y and the excitation x |
| Sxx (ω) | = Power Spectral Density of the excitation x |
| λl | = Length scale factor |
| λσ | = Stress scale factor |
| λe | = Elastic modulus scale factor |
| λρ | = Specific mass scale factor |
AVAILABILITY OF DATA AND MATERIALS
All data generated or analyzed during this study are included in this published article.
ACKNOWLEDGEMENTS
The authors would like to acknowledge the support of the Civil Engineering Department, University of Tlemcen, Algeria, in developing the work, and the Ministry of Higher Education and Scientific Research of Algeria for the financial budget for this research interchange.