All published articles of this journal are available on ScienceDirect.
Analysis and Modelling of the Relationship between Stopped and Control Delays by Differential Evolution Algorithm
Abstract
Two delay definitions namely stopped delay and control delay are commonly used to determine the level of service of a signalized intersection. In this research, we first developed a number of new models to describe the relationship between stopped and control delays using Differential Evolution (DE) algorithm. In these models, we considered four cycle lengths of 60, 90, 120 and 150 seconds with the green ratio ranging from 0.35 to 0.60. Taking the saturation flow as 1800 vph, five different traffic volumes were considered ranging from 600 to 1400 vph with 200 vph increments. Three analysis periods were selected as 15, 30 and 60 minutes. The data needed for model development and verification were obtained from a four leg intersection by using CORSIM simulation. In the second part of the study, the effect and sensitivity of cycle length, traffic volumes and green ratio parameters on the conversion ratio (Ds/Dc) to relate stopped and control delays were evaluated based on the selected parameter ranges.
The results revealed that the conversion ratio cannot be accepted constant usually taken as 0.76 for practical purposes since it is dependent on changing operation and traffic conditions. Therefore, it needs to be determined with the use of an appropriate model considering variable traffic conditions as functions of volume, cycle length and green ratio.
INTRODUCTION
The operational efficiency of a signalized intersection is usually expressed in terms of delay, number of stops, degree of saturation and vehicle operation cost. Among these, delay is the most frequently used because it shows the amount of lost travel time, fuel consumption, frustration and discomfort of drivers at signalized intersections. [1-3] Delay is defined as the additional time that a driver has to spend at an intersection when compared to the time to pass through the intersection without impedance at the free flow speed. This additional time is resulted from both the traffic signals and the other effects of traffic at the intersection, and is expressed on a per-vehicle basis. In order to estimate the delay, some models have been developed employing different assumptions [4-9] and several definitions (such as approach delay, control delay, stopped delay, traffic delay, queue move-up delay, acceleration delay and deceleration delay etc.) are used to identify the different types of delays experienced by vehicles at signalized intersections. These definitions provide a good reference to understand delay characteristics and various delay measurement techniques in the field [10-16]. Actually, stopped delay and control delay among them are well-known because they have been used to determine the level of service of a signalized intersection in Highway Capacity Manual (HCM) for years [17-19].
Stopped delay is defined as the time that a vehicle spends for stopping on the approach of the intersection. It depends on the vehicle arrival and departure patterns at an intersection as well as signal timing, but does not represent the total effectiveness of the intersection when compared to control delay. It is basically measured in the field and then is converted to the approach delay or the control delay to obtain the efficiency of a signalized intersection. Control delay, on the other hand, is a portion of total delay and is defined as the delay caused by traffic control devices. In other words, it is the difference between the travel time when a vehicle is affected by a traffic control and the travel time of the same vehicle traversing on the intersection without impedance at the desired free flow speed. It actually incorporates stopped delay, queue move-up delay and the lost time in acceleration and deceleration, as illustrated in Fig. (1). Therefore, it is considered the best measure to describe the operational efficiency of the intersection.
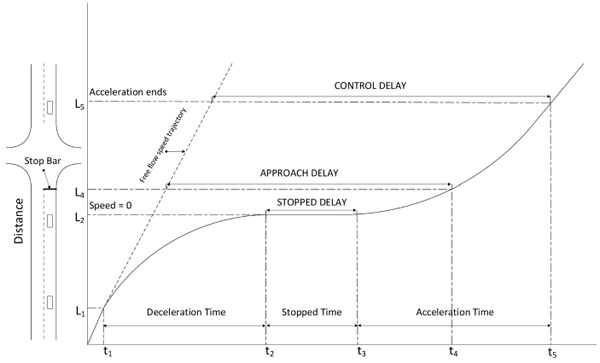
Diagram of intersection delay components [14].
Reilly et al. [20] assumed that the delay ratio between stopped delay and control delay is constant and equal to 0.76. This ratio (Ds/Dc), also called conversion ratio, is commonly used to obtain control delay from measured stopped delay in the field. The 1994 HCM employed Ds/Dc to estimate control delay from stopped delay. On the other hand, some researchers have doubted the accuracy of Reilly’s assumption and further investigated the relationship between stopped and control delays. Akcelik [21] derived a theoretical model given in Eq. 1 to determine acceleration and deceleration delay of a vehicle.
 |
(1) |
where dai is acceleration-deceleration delay for vehicle i, a1 and a2 are respectively deceleration and acceleration rates for vehicle i, v is speed of vehicle i and a is average acceleration and deceleration rate.
Following that he expressed the relationship between stopped and control delays in Eq. 2.
 |
(2) |
in which Ds and Dc are stopped delay and control delay, respectively.
Teply [22] and Olszewski [23] pointed out that the conversion ratio is not constant but is a function of acceleration, deceleration and the duration of red interval. The former used two different techniques, which are known as “the counting of number of vehicles stopped on the intersection approach for fixed time intervals” and “counting queues at the end of red and green intervals” while investigating the relationship between stopped and control delays. He found that the conversion ratio depends on different variables as the delay measurement techniques change. The author proposed the following delay ratio based on the first technique.
 |
(3) |
where r is the duration of red interval, td is deceleration delay.
It is noteworthy that in Eq.3 the delay ratio depends not only on arrival and departure flows but also on red interval duration and deceleration delay [22]. In fact, deceleration delay may be practically constant in most situations. For long or short red intervals, on the other hand, the delay ratio is variable. This indicates that it is not appropriate to use a fixed coefficient to obtain control delay from a measured stopped delay.
Teply [22] proposed the following relationship between stopped and control delays based on the second technique mentioned previously. Here, the delay ratio is completely independent of the signal timing but a function of arrival and saturation flow.
 |
(4) |
where y is flow ratio (i.e., the ratio between arrival flow to saturation flow).
Olszewski [23] developed different expressions for the ratio between stopped and control delays for uniform and overflow components of random arrival conditions. His models were dependent on effective red time, cycle length, degree of saturation and average acceleration-deceleration delay with the delay ratio close to 0.76 only for red periods longer than 60 seconds and random arrivals.
In 1999, Quiroga and Bullock [14] proposed a formula for Ds/Dc given in Eq. 5. Their study showed that the stopped and control delay relationship was linear and their delay ratio did not have a constant value. They revealed that acceleration-deceleration delay had to be added to the stopped delay to obtain control delay. They also expressed cycle length, especially the red interval length, to be incorporated in the relationship between stopped and control delays.
 |
(5) |
A similar study to investigate the relationship between stopped and control delays was performed by Mousa in 2002 [10]. The author focused on acceleration and deceleration rates as well as their lengths. He found the following relationship for Ds/Dc in Eq. 6.
 |
(6) |
Clik [24] investigated the effects of selected parameters including controller type, speed limit, split ratio, number of lanes, cycle length, saturation flow rate, and approach length on the stopped and control delays. His research indicated that controller type, approach speed, split ratio, and number of lanes have a significant effect on the stopped and control delays.
The first objective of this study is to develop models to relate stopped delay to control delay using DE algorithm (a metaheuristic approach) as a first attempt in the literature. Then, the advantage of using a variable conversion ratio due to stochastic nature of traffic, instead of a constant value (i.e., 0.76), for better delay estimations is explored by employing traffic and signalization parameters including volume, cycle length and green ratio with varying parameter values.
This paper is organized as follows: the differential evolution algorithm and developed delay models are presented in the materials and methodology section. The model details and the steps of algorithm are explained in the same section. The model results and the effects of cycle length, traffic volume and green ratio on the relationship between stopped and control delays are given in the results and discussions section. Finally, conclusions are presented in the last section.
MATERIALS AND METHODOLOGY
1. Differential Evolution Algorithm
In 1995, a new evolutionary algorithm called Differential Evolution algorithm was proposed by Price and Storn [25] to solve global optimization problems. The DE algorithm uses operators similar to genetic algorithms (GAs). However, its main difference is the mutation operator. The GA produces random modifications in chromosomes, while the DE algorithm employs differences between chromosomes when arithmetically combining them [26]. This makes it simple and easy to be used for providing optimal convergence. Further, it has relatively fewer tunable parameters, thus it has become one of the popular optimization algorithms in the literature. This algorithm, especially, runs with real parameter values to solve problems making it more efficient population-based stochastic search algorithm when compared to other approaches such as GA, ant colony and bee colony algorithms. Additionally, if problem is non-linear and has many local minimum points, the DE algorithm can easily handle them and give more coherent results. Fast convergence, less control parameters and easy coding features of DE attract many researchers.
In the DE algorithm, the mutation operator should be adaptable inasmuch as the size of the step to be taken into account for optimum changes. The differences between the chromosomes are a good indicator of an appropriate step size [27]. The technique for creating the trial vector obtained by combining a weighted difference vector to a base vector is a main idea in the DE algorithm [26]. A detailed description of DE algorithm is provided in the following paragraphs.
1.1. Initialization Step
Lower and upper bounds for initialization of each parameters should be defined. And then, uniformly distributed random numbers between 0 and 1 are generated as defined in Eq. 7.
 |
(7) |
where Xjmax and Xjmin are the upper and lower bounds of the jth parameter, i = 1... Np (number of population) and j = 1…D (number of parameters).
1.2. Mutation
The DE algorithm employs the differences between the population members and at least three chromosomes from the population are needed to create the mutant vector defined by Eq. 8.
 |
(8) |
in which X'i(G) is the mutant vector, Xa(G) is the base vector, G is generation number, F is the scaling constant, Xb(G) and Xc(G) are random vectors to produce the difference vector.
The DE algorithm offers several variants or strategies for optimization illustrated by DE/x/y/z. Here, x refers to the vector employed to create mutant vectors, y is the number of difference vectors used in the mutation process and z is the crossover scheme utilized in the crossover operation. There are four well-known mutation vectors in the literature given in Eqs. 9-12.
|
DE/rand/1/bin: |
Vi,g=Xr0,g+F(Xr1,g - Xr2,g) (9) |
|
DE/best/1/bin: |
Vi,g = Xbest,g+F(Xr1,g - Xr2,g) (10) |
|
DE/current-to-best/1/bin: |
Vi,g = Xi,g+F(Xbest,g - Xi,g)+F(Xr1,g - Xr2,g) (11) |
|
DE/best/2/bin: |
Vi,g = Xbest,g+F(Xr1,g - Xr2,g + Xr3,g - Xr4,g) (12) |
where X(best,g) is the best fitness in population.
1.3. Crossover
In this step, the aim is to crossover the mutant and target vectors. The trial vectors (Xi'') are generated by crossovering the mutant and target vectors according to the selected probability distribution [28].
 |
(13) |
1.4. Selection
The final step of the DE algorithm is the selection operation to choose better population between the trial and the target vectors for minimizing the fitness function given by Eq. 14. Here, if the trial vector has a better value than the target vector, the former is transferred to the next generation. Otherwise, the latter is retained for the next generation [28].
 |
(14) |
The optimal value ranges of the control parameters including scaling factor (F), crossover rate (Cr), population size (Np) and the number of model parameters (D) are determined as suggested by Storn and Price [25]. They recommend that F changes from 0.5 to 1, Cr ranges from 0.8 to 1 and Np varies between 4D and 10D. The flow chart of DE algorithm is illustrated in Fig. (2).
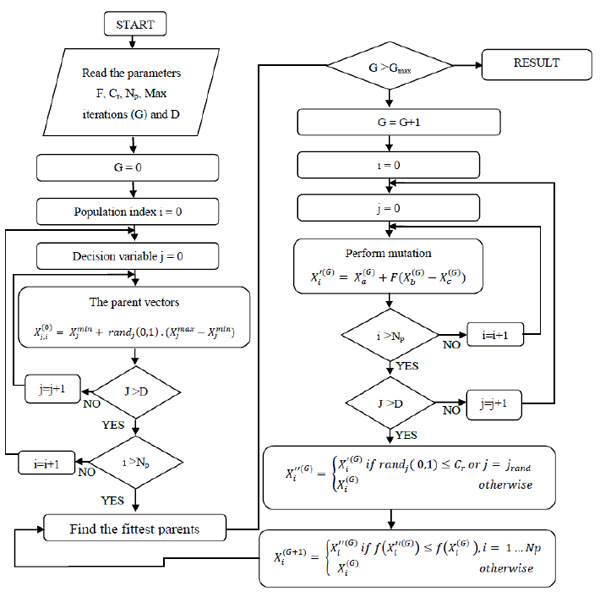
Modelling the relationship between Ds and Dc by the DE algorithm.
2. Modelling the Relationship Between Ds and Dc by the DE Algorithm
Three different mathematical forms namely linear, power and exponential defined by Eqs. 15-18 were utilized in the development of the models by the DE algorithm.
Linear form without intercept:
 |
(15) |
Linear form with intercept:
 |
(16) |
Power form:
 |
(17) |
Exponential form:
 |
(18) |
where Dslinear,Dcpower and Dcexponential are linear, power and exponential forms of the models, respectively, and w1 and w2 are the corresponding weighting factors. The DE algorithm optimizes w1 and w2 based on the objective function defined in Eq. 19 below.
 |
(19) |
in which Dcsim and Dcest are respectively simulated by CORSIM and estimated control delays and m is the number of data.
2.1. Model Development and Evaluation
In order to develop the models, a four-leg signalized intersection was designed by employing CORSIM simulation program [29]. An illustration of the intersection is given in Fig. (3). Passenger cars, trucks and carpools are types of vehicles utilized in this study with shares of 75%, 15% and 10%, respectively. The intersection under study was simulated under varying traffic volumes (v), cycle lengths (C), green ratios (g/C), degree of saturations (x), analysis periods (T) and a constant saturation flow value (s). The parameter ranges taken into account for the simulations are given in Table 1.
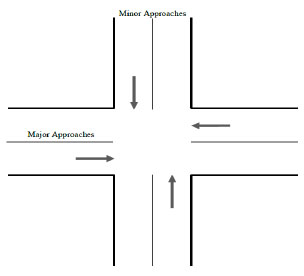
Schematic of intersection.
Parameter ranges for CORSIM simulations.
| Parameter | Parameter Range |
|---|---|
| Traffic volume | 600 to 1400 vph |
| Cycle length | 60 to 150 secs |
| Green ratio | 0.35 to 0.60 |
| Analysis period | 15 to 60 |
| Degree of saturation | 0.6 to 1.4 |
| Saturation flow | 1800 vph |
To determine the effect of traffic condition for both under and over saturated traffic flows, the required parameters are taken from Table 1 where the degree of saturation (i.e., traffic volume/capacity) ranges from 0.6 to 1.4 as generally accepted in the literature. So, traffic volumes varied from 600 to 1400 vph, while green ratio changed between 0.35 and 0.60, and the duration of analysis period is taken from 15 to 60 minutes. The cycle length changes from 60 to 150 seconds to cover different traffic conditions. Four different cycle lengths including 60, 90, 120 and 150 seconds are taken into consideration in simulations according to traffic demand.
In this study, a total of 10 simulation runs with different random seed numbers that CORSIM uses to generate varying driver and vehicle characteristics were performed for each traffic condition. During a simulation, a constant random seed number was considered while v, C, g/C, T and x values were variable as defined earlier to obtain identical traffic movements. Given these, 2700 simulations in total were performed for the model development. For each traffic condition, the average of 10 simulations was determined and, therefore, a total of 270 stopped and control delay data were obtained. For training, 230 of the data were randomly selected to utilize for predicting the model weighting values, while the remaining data were used for testing the model results.
When developing the linear, power and exponential forms of models, we chose the parameter values suggested by Mallipeddi et al. presented in Table 2 for the DE algorithm accordingly [30]. As proposed by Mallipeddi et al., the number of population can be 4 to 10 times of number of model parameters, while crossover rate and scaling factor can range from 0.9 to 1.0, and 0.4 to 0.95, respectively.
The selected parameters for DE application.
| Number of Population (NP): 20 |
| Crossover Rate (Cr) : 0.9 |
| Scaling Factor (F) : 0.8 |
| Mutation Strategy: DE/rand-to-best/1/exp |
| Number of Iteration: 100 |
After application of the DE algorithm, the relationship between stopped and control delays are given in Eqs. 20-23. Here, two different linear models were developed, that is, one without intercept (Eq. 20) and the other with intercept (Eq. 21). In the former, the intercept was forced to zero to get the ratio between stopped and control delays for various traffic conditions. On the other hand, in the latter, the intercept is different than zero so that the equation can present the actual difference between stopped and control delays without affecting the original values of data.
 |
(20) |
 |
(21) |
 |
(22) |
 |
(23) |
3. Investigating the Effect of Traffic Volume, Cycle Length and Green Ratio on Ds/Dc
In this section, the effects of traffic volume, cycle length and green ratio on the relationship between stopped and control delays are assessed. The details are presented in the following paragraphs.
3.1. Traffic Volume Effect
The traffic volume represents total number of vehicles that pass over a given point during a time interval. In order to investigate the effect of traffic volume on Ds/Dc, three traffic volumes of 600, 1000 and 1400 vph were considered for a four leg intersection. The intersection is actually operated under two phases with a common cycle length of 90 seconds. Yellow and all red intervals for all approaches were respectively 3 and 2 seconds. The model equations for the given traffic volumes are defined by Eqs. 24-26 where the delay ratio decreases as the traffic volume increases.
| Ds=0.787Dc (v=600 vph) | (24) |
| Ds=0.763Dc (v=1000 vph) | (25) |
| Ds=0.687Dc (v=1400 vph) | (26) |
3.2. Cycle Length Effect
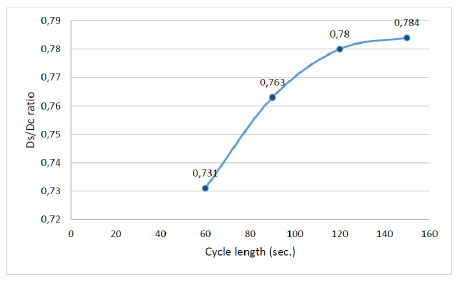
It is known that the optimal cycle length is a significant parameter for efficient traffic operation at a signalized intersection. Here, four different cycle lengths (i.e., 60, 90, 120 and 150 sec.) were selected as the traffic volume was set to 1000 vph. The model equations for the given cycle lengths are defined by Eqs. 27-30 in which the conversion factor is found to increase ranging from 0.731 to 0.784 as the cycle length increases.
| Ds=0.731Dc (C=60 sec.) | (27) |
| Ds=0.763Dc (C=90 sec.) | (28) |
| Ds=0.780Dc (C=120 sec.) | (29) |
| Ds=0.784Dc (C=150 sec.) | (30) |
3.3. Green Ratio (g/C) Effect
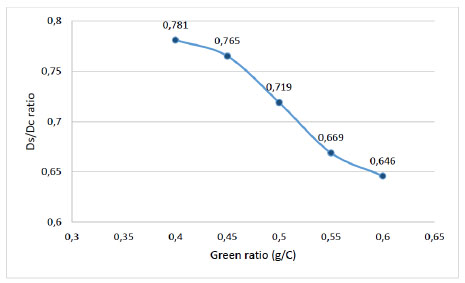
The green ratio is one of the important variables to estimate uniform delay which is resulted from the interruption of traffic flow by the traffic signals at intersections. Since uniform delay is a part of control delay and also consists of stopped and other delay components, green ratio is a key parameter to investigate the relationship between stopped and control delays. In order to determine the effect of green ratio, five different g/C changing from 0.40 to 0.60 with 0.05 increments were used when the cycle length and the traffic volume were set to 90 sec and 1000 vph, respectively. The developed model equations are given in Eq. 31-35 where the delay ratio decreases as the green ratio increases as expected.
| Ds=0.781DC (g/C=0.4) | (31) |
| Ds=0.765DC (g/C=0.45) | (32) |
| Ds=0.719DC (g/C=0.5) | (33) |
| Ds=0.669DC (g/C=0.55) | (34) |
| Ds=0.646DC (g/C=0.6) | (35) |
RESULTS AND DISCUSSION
In order to see the performance of the developed models, the output of training and test data are compared with statistical measures of mean absolute error (MAE), mean square error (MSE) and coefficient of determination (R2) defined by Eqs. 36- 38. The statistical values are given in Table 3. The scatterplots of estimated versus simulated control delays are illustrated in Figs (4-7) where a fairly good agreement between them existing for each model.
 |
(36) |
 |
(37) |
 |
(38) |
Where DCsim and DCest represent simulated and estimated control delays, respectively, and m is the number of data.
As shown in Table 3, all models have significantly high coefficient of determination values for both training and testing. The MAE and MSE values for the linear and power models are relatively lower than those for the exponential model.
Model statistics of training and test data for comparison.
| Linear model without intercept | Linear model with intercept | Power model | Exponential model | |||||||||
| MAE | MSE | R2 | MAE | MSE | R2 | MAE | MSE | R2 | MAE | MSE | R2 | |
| Training | 10.26 | 292.66 | 0.991 | 11.03 | 284.35 | 0.991 | 10.53 | 259.88 | 0.992 | 20.90 | 623.50 | 0.983 |
| Test | 11.67 | 399.45 | 0.989 | 12.26 | 401.75 | 0.989 | 12.40 | 402.50 | 0.990 | 21.80 | 715.88 | 0.985 |
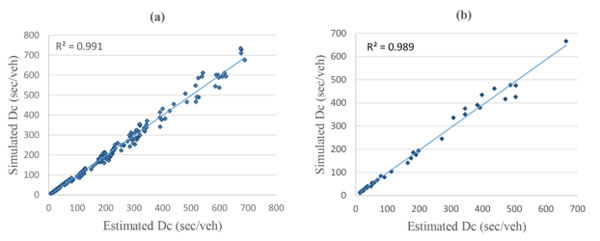
Scatter plots for the linear model without intercept: (a) training, (b) test.
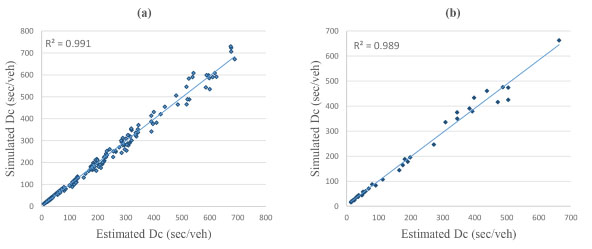
Scatter plots for the linear model with intercept: (a) training, (b) test.
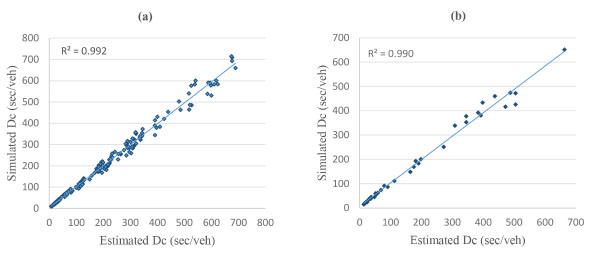
Scatter plots for the power model: (a) training, (b) test.
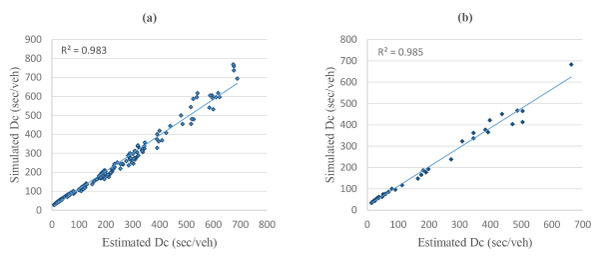
Scatter plots for the exponential model: (a) training, (b) test.
According to the statistical evaluations, the power model generated relatively better outputs. However, the other models also produced fairly good delay results. In this study, the conversion ratio was found 0.74 in average as defined by Eq. 20. This is very close to 0.76 which was used for control delay estimations in 1994 HCM. As a matter of fact, conversion ratio gives an idea for control delay estimates but as explained earlier, to use a constant conversion ratio for delay estimates is not suitable due to stochastic nature of traffic and other uncontrolled factors that are affecting delays. Therefore, specific traffic conditions must be taken into consideration and Ds/Dc relationship should be investigated and modelled accordingly.
The delay ratio between stopped and control delays was 0.787 for 600 vph, 0.763 for 1000 vph, and 0.687 for 1400 vph, respectively. That indicates if traffic volume increases, the amount of control delay also increases. The traffic volume increases on any approach of a signalized intersection due to queue, queue move-up and acceleration-deceleration delay effects resulting in control delay increases. Therefore, traffic volume emerges as an effective parameter on Ds/Dc relationship. The graphical illustration of this effective parameter on Ds/Dc relationship is depicted in Fig. (8).
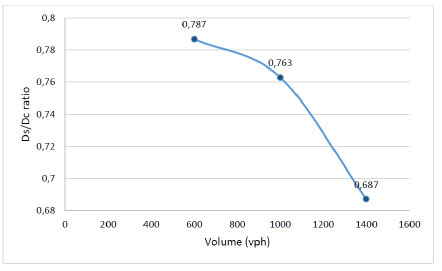
The relationship between volume and conversion factor Ds/Dc
As shown in Fig. (9), a linear relationship between cycle length and Ds/Dc can be observed for relatively low cycle lengths. Additionally, when cycle length is high the change in Ds/Dc value decreases. It is noteworthy to express that the Reilly’s assumption (i.e., the delay ratio between stopped delay and control delays is equal to 0.76) is no longer valid for different traffic conditions (see Eqs. 27-30).
The relationship between cycle length and conversion factor Ds/Dc
It is shown that there is an inverse relationship between the green ratio and Ds/Dc as depicted in Fig. (10). The evaluations of model outputs reveal that an increase in g/C causes noticeable effects on the delay ratio. Actually, as stated by Teply [22] and Olszewski [23] it changes along with the duration of red interval and consequently g/C value.
The relationship between green ratio and conversion factor Ds/Dc
CONCLUSION
The relationship between stopped and control delays depends on various parameters including traffic volume, cycle length, green ratio, approach speed, duration of red interval, deceleration and acceleration rates etc. The effect of duration of red interval, deceleration and acceleration rates, flow ratio and degree of saturation on Ds/Dc relationship have been broadly studied by several researchers. On the other hand, the effect of traffic volume, cycle length and green ratio have not received much attention to determine the conversion ratio.
In the first part of this study, four different forms of analytical models (a linear without intercept, a linear with an intercept, a power and an exponential model with CORSIM simulation data sets) were developed to investigate the relationship between stopped and control delays by applying Differential Evolution algorithm. The model results obtained from various traffic and operating conditions indicate that the conversion ratio was 0.74 in average.
In the second part of the study, the impact of traffic volume, cycle length and green ratio on Ds/Dc relationship was investigated for variable traffic and operating conditions by using one factor at a time approach. The study results showed that Ds/Dc ratio decreases while traffic volume and green ratio increase. On the contrary, it increases as the cycle length increases.
In summary, Ds/Dc ratio was found different than 0.76 as commonly used in the literature. The use of a constant delay ratio is questionable for changing traffic and signalization parameters at intersections. Therefore, an appropriate Ds/Dc ratio needs to be calculated accordingly.
In further studies, additional parameters such as saturation flow, capacity, approach speed and length can be taken into consideration to determine their effect on the conversion ratio. The performance of delay models developed for Ds/Dc relationship can be evaluated by utilizing field data if available.


