All published articles of this journal are available on ScienceDirect.

Deformation Limits of L-Section RC Shear Walls
Abstract
In order to establish the relation between damage state and member deformation of the L-section RC shear wall, 216 FE models designed to meet the requirements of the Chinese codes were set up. The analysis fully considers the variation of parameters including axial load ratio and shear span ratio etc. According to the results, criteria of classifying failure modes of L-section RC shear walls are proposed. Failure modes are determined by shear-span ratio, moment-shear ratio and end columns' reinforcement ratio. Deformation limits corresponding to respective performance levels are put forward. Fitted formulas of calculating the limits are also presented. It is shown that the categorization criteria are reliably accurate in predicting failure modes. Deformation limits of a given L-section RC shear wall could be determined via axial load ratio and moment-shear ratio. The fitted formulas possess a satisfactory correlation with numerical results.
1. INTRODUCTION
The focus of seismic design has shifted from 'strength' to 'performance' over the last few decades [1]. Nowadays, performance based earthquake engineering has become the mainstream of structural earthquake engineering, and has directed the development of design codes. Future documents could involve risk assessment in terms of potential financial loss. As a result, project participants other than engineers could be more well-informed [2]. Inevitably, such trends of development could only be achieved with the quantitative determination of members' state of damage. Immature as it might be, the GB 5001-2010 Code for Seismic Design of Buildings [3] has already recommended the philosophy of performance based design. But it has yet provided deformation limits of different performance levels. The code still relies on capacity check and detailing. As has been implied by many earthquake events, the extent to which members and structures are damaged under a given earthquake is tightly related to their deformations. Thus, it is imperative to study and establish the deformation limits of structural member. The RC shear walls are the most crucial lateral-resistant members of high rise buildings. Research on the deformation limits of RC shear walls is important.
Most research in this field focuses on rectangular walls [4 - 9]. Ji Jing et al. [4] conducted statistical analysis of the rectangular walls experiment data and put forward the formulas of drift angle limits categorized by different failure modes. Qi Yong-le [5] sought to quantify the deformation limits of different performance levels based on material strain. Deformation limits of rectangular walls are presented via a large amount of numerical models. Thomsen, et al. [6] adopted the displacement based design approach to predict the distribution of the normal strain gradient of slender walls. Results show satisfactory agreement with several tests data. Liang Xing-wen et al. [7] conducted experimental study on high strength shear walls with edge columns. Corresponding deformation limits of three performance levels are proposed, the limits are featured by drift ratio. Kazaz Ilker et al. [8, 9] examined and evaluated deformation limits of rectangular shear walls regulated in current codes via FE analysis. A more detailed and accurate method was put forward, which accounts for variation of different factors.
In contrast to rectangular walls, less focus has been put on the study of flanged walls' deformation limits. Although some experimental and numerical studies have focused on the walls' seismic performance and the influence of related parameters (axial load ratio, shear span ratio, flange effects etc.) [10 - 17], studies summarizing the L-section walls' failure modes classification and deformation limits are yet seen.
Flanged walls are some of the most commonly used members in real structures. However, the seismic behavior and performance of the L or T-section walls possess distinct features from rectangular ones. The shear force is almost entirely sustained by the web while moment is sustained by both the web and the flanges [18]. Due to the presence of flange concrete and reinforcement, flanged walls generate much greater moment resistance than rectangular walls with the same length. Since the demand of shear is determined by the actual axial-flexure capacity [19, 20], increase in moment resistance will boost up the shear level in the web. Consequently, the resistance of shear force in the web may be more critical [21]. Ductility is significantly higher when the flange is in compression, and much lower when it is in tension [22]. Mechanical characteristics of an L-section shear wall may change significantly along different directions, which could lead to unexpected failure modes [23]. In addition, performance of two orthogonal directions are coupled and interrelated [24]. Given the considerable difference from rectangular walls, it is thus necessary to gain insight into the L-section wall's deformation limits.
In this study, performance levels of the L-section RC shear walls are defined, numerical analysis on 216 L-section RC shear walls designed to meet the Chinese codes is conducted in ABAQUS. Failure modes categorization criteria are proposed. Deformation limits at 6 performance levels within respective failure modes are presented. Fitted formulas of calculating these limits are attained from statistical study. Results reveal satisfactory accuracy in the anticipation of member failure modes. Deformation limits at any performance levels can be acquired based on moment-shear ratio and axial load ratio. The fitted formulas also show high correlation with numerical data. The study could serve as reference to seismic performance evaluation of L-section RC shear wall.
2. DEFINITION OF PERFORMANCE LEVELS
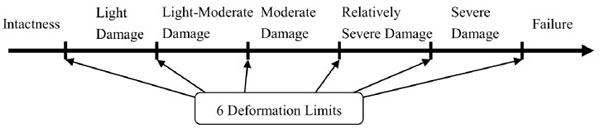
With reference to the code and literature [3, 5], this study adopts the 6 deformation limits which divide the overall deformation development into 7 performance levels: intactness, light damage, light-moderate damage, moderate damage, relatively severe damage, severe damage and failure, as indicated in Fig. (1). Definition of the first 6 performance levels and the corresponding material limits are described in Table 1.
Member performance levels and deformation limits.
Criteria for classifying performance levels of L-section RC shear wall.
| Performance Levels | Damage Description | Concrete Strain Limits | Reinforcement Strain Limits |
|---|---|---|---|
| Intactness | Minor cracks can be observed, no permanent deformation, member remains elastic and retrofit is unnecessary | 0.002 | fy/Es |
| Light Damage | No spalling is observed, yielding of some reinforcement, residual crack width smaller than 1mm, can be retrofitted by plastering or injection of epoxy | 0.004 | 0.015 |
| Light-Moderate Damage | Spalling is observed partly, core concrete remains intact, residual crack width smaller than 2mm, can be retrofitted by attaching fiber material or steel panels | 0.005 | 0.03 |
| Moderate Damage | Spalling is observed, no crushing of core concrete, residential crack width larger than 2mm, member remains economically retrofittable | min(εcu,0.02) | min(0.60εsu,0.05) |
| Relatively Severe Damage | Reinforcement is near fracture, crushing of core concrete is observed, lateral strength drops to 85% of the peak value | 1.5εcu | min(0.90εsu,0.08) |
| Severe Damage | Reinforcement fracture is seen, crushing of core concrete is observed, lateral strength drops to 70% of the peak value | 1.8εcu | 0.1 |
3. NUMERICAL ANALYSIS
3.1. Analyzed Walls
Numerical models shall take account of main variables, and shall be representative in geometry. To achieve this, FE models of 216 L-section RC shear walls designed to meet the Chinese codes are set up. Sizes of these specimens are shown in Fig. (2). Main parameters and their values are: shear-span ratio (λ=2, 2.5 and 3.0), axial load ratio (n=0.071, 0.21, 0.36 and 0.50, 0.50 is beyond the code's regulation), longitudinal reinforcement ratio of the web and flange end columns as well as corner column (ρ=1.15%, 2.36% and 3.68%), the confinement reinforcement(stirrups) ratio of the web and flange end columns and corner column (ρv1=Ф8@200, Ф10@200, Ф12@200) and the horizontal shear reinforcement ratio(ρv2=1.14% and 1.55%). Shear span ratio is defined as λ=M/(V·h) where M and V are moment and shear force at a given cross section, and h is the length of the section. For cantilever walls, λ equals to L/ h where L is the height of the walls. Axial load ratio is n=F/(fc·A) where F is the applied axial load, fc is the compressive strength of concrete and A is the gross area of wall section. Moment-shear ratio refers to m=Mu/(Vu·L) where Mu is the ultimate sectional moment capacity, Vu is the shear resistant capacity. Note that the value of moment-shear ratio is influenced by reinforcement ratio, axial load ratio, horizontal reinforcement ratio and the height of the wall. It is a comprehensive index that characterizes the shear level in the web and is not treated explicitly as an independent variable herein. However, given the wide range of the influencing variables, moment-shear ratio will has a representative distribution.
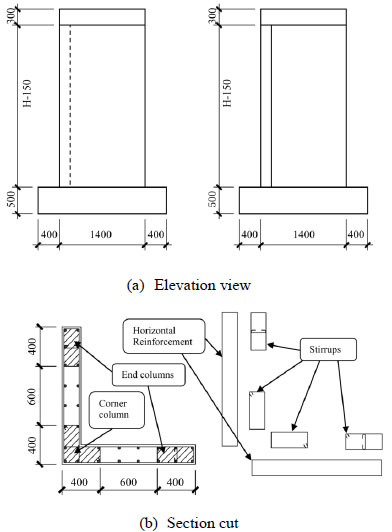
Elevation view and section cut of the L-section RC shear wall (Unit: mm).
3.2. Numerical Modeling of the Analyzed Walls
FE software ABAQUS is adopted. The Concrete Damaged Plasticity constitution model is used to simulate material behavior of concrete. A general plastic model is used to model steel bars. According to [26], dilation angle of concrete is between 36° to 40°, an optimal value based on material test is 38° which is adopted herein. Kc is the ratio of the distances between the hydrostatic axis and respectively the compression and tension meridian in the deviatoric section [27]. It is taken as recommended value 2/3 which conforms to test results [27]. Eccentricity describes the rate of approach of the plastic potential hyperbola to the asymptote. The recommended value of 0.1 is used. The parameter fbo / fco refers to the ratio of strength in the biaxial state to that in the uniaxial state. It is taken as the default value 1.16 which is also suggested by material test [27]. With respect to steel, the simple plastic model considering strengthening is adopted. Yield stress is 400 MPa for class HRB400 steel, ultimate strength is 570 MPa with corresponding ultimate strain of 0.075. These values are based on Code for design of concrete structures (GB 50010-2010) [28].
The concrete body uses 3D cubic elements and steel bars are simulated by truss elements. Truss elements can capture the steel bars' axial behavior. Moments from rotation is not considered since it is generally negligible comparing with axial force. Connection between concrete and steel bars is realized by embedded element technique. Nodal displacement of truss elements is interpolated by the shape function of the surrounding concrete element. Such restraint can well reveal the behavior of reinforced concrete members when steel bars are gripped tightly by concrete. In real specimens, slipping only concentrates in limited areas undergoing severe nonlinearity, such as plastic hinges. This study mainly focuses on the macro deformation capacities to which slipping is not as influential in terms of numerical analysis. Moreover, taking account of slipping is too costly in computation for 216 models. Therefore, effect of slipping is not considered herein. FE models are firstly loaded with axial force. Monotonic lateral displacement loading is carried out with constant axial load. Monotonic curves are the upper bound of the hysteretic curves, and they are usually close [18]. According to Shen Ju-min et al. [29], error of ultimate resistance is below 10%, which is acceptable. Also, cyclic loading is extremely costly in computation. Thus, the push-over loading is considered rational.
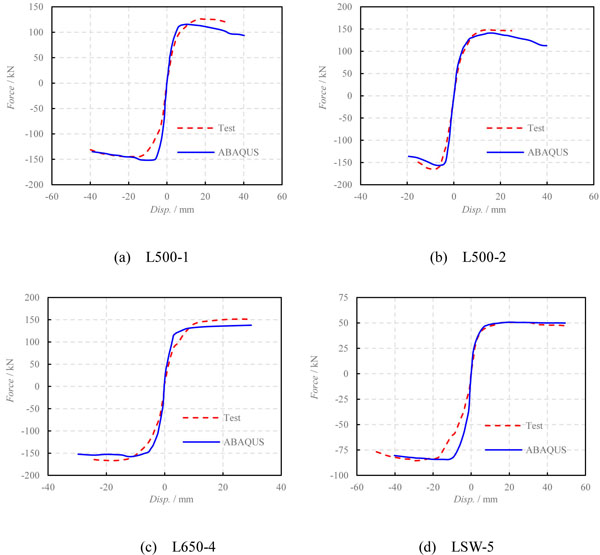
Comparison of load-displacement relation of test specimens and FE models.
3.3. Comparison Between FE Models and Test Results
To verify the parameters of the FE analysis, comparison between numerical models and test specimens is necessary. Data of 49 tests of L-section RC shear walls and L-section RC columns from literature [10 -12, 30 -39] are collected. Finite element analysis is performed to 9 of them. Parameters of the 9 specimens are given in Table 2. These walls are representative in geometry, and include a wide range of axial load ratio, shear-span ratio and reinforcement ratio. Values of parameters are determined according to the discussion in last section. Comparison between numerical load-displacement curves and backbone curves attained from tested specimens are shown in Fig. (3).
Factors and failure modes of L-section RC shear wall specimens.
| Specimens | Reference | λ | n | ρ /% | ρv/% | Failure Modes |
|---|---|---|---|---|---|---|
| L500-1 | [10] | 2.80 | 0.20 | 2.26 | 0.48 | Flexure |
| L500-2 | 2.80 | 0.40 | 2.26 | 0.97 | Flexure-Shear | |
| L650-4 | 2.15 | 0.10 | 2.26 | 0.97 | Flexure-Shear | |
| LSW-5 | [11] | 3.00 | 0.20 | 1.13 | 0.60 | Flexure |
| LSW-6.5 | 2.31 | 0.20 | 0.85 | 0.72 | Flexure | |
| LSW-8 | 1.88 | 0.20 | 0.85 | 0.66 | Flexure | |
| L1 | [35] | 3.78 | 0.29 | 1.94 | 0.25 | Flexure |
| L2 | 3.78 | 0.25 | 1.94 | 0.50 | Flexure | |
| L3 | 3.03 | 0.21 | 1.51 | 0.50 | Flexure |
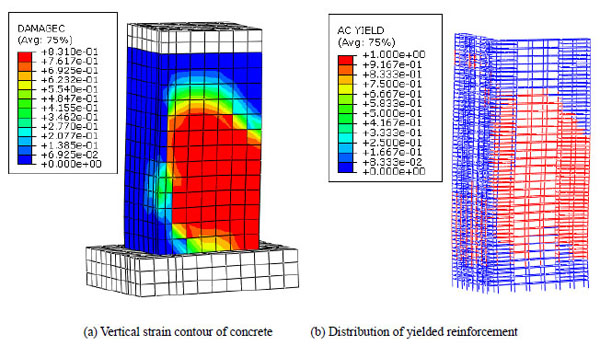
It is seen that the FE analysis and tests results show general agreement on backbone curves, maximum resistance and deformation abilities. Error of maximum resistance is limited within 15%, which guarantees the accuracy of FE models. With respect to failure modes, analysis and tests also display very similar features. Take the specimen LSW-6.5 as an illustrative example. Failure modes of both the tested specimen and numerical model are given in (Fig. 4). As described in the literature, lateral cracks were first seen, concrete crush occurred at the eighth cycle, spalling was observed at the tenth cycle together with the buckling of longitudinal bars (Fig. 4a). The model's concrete compressive damage, tensile damage and yielding of reinforcement are respectively presented in Fig. (4b-d) The concrete's damage represents the comprehensive extent of material nonlinearity. The results of the FE model reveal satisfactory accordance with the tested specimen.
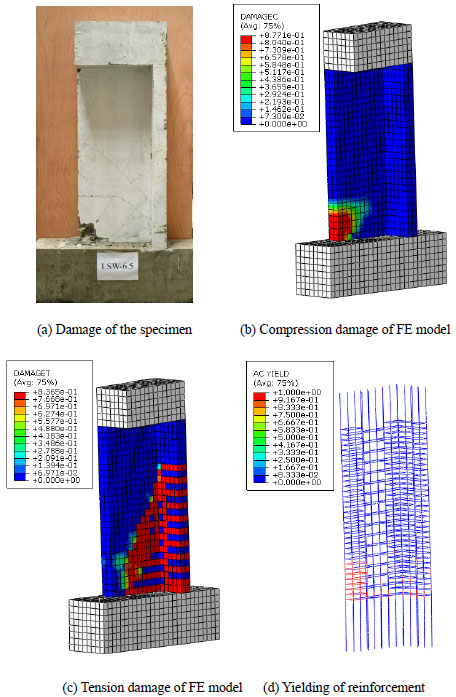
Comparison of test specimen and FE model of LSW-6.5.
3.4. Failure Modes Categorization
Failure modes of the collected 49 specimens show strong relevance with shear-span ratio λ and moment-shear ratio m Fig. (5). Specimens' moment and shear capacities are calculated according to formulas and regulations in technical specification for concrete structures of tall building (JGJ3-2010) [39]. Relation between failure modes and shear-span ratio and end column reinforcement ratio are given in Fig. (6). As can be seen, shear failure specimens are mostly distributed in the range of λ<1.5 and m>0.9 while flexure failure dominates the phase of λ>3.5 and m<0.5. This indicates an increasing involvement of shear effect with the ascendance of moment-shear ratio. Positive correlation between flexure-shear failure and end column reinforcement ratio can be observed when shear-span ratio λ is below 3.0. The correlation weakens when λ is over 3.5.
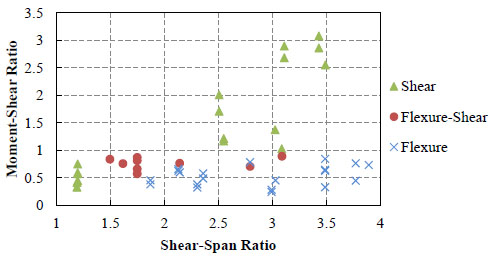
Relation between failure modes and shear-span ratio and moment-shear ratio.
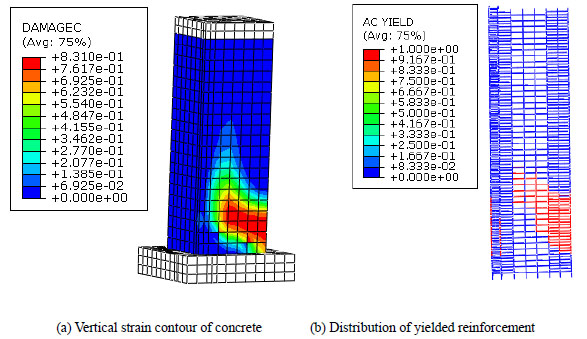
To compensate for the limit amount of specimens and the unavoidable divergence of test data, FE models are analyzed to do further study and gain quantified evaluation of the connection between failure modes and the above mentioned factors. 3 categories of failure modes are defined: flexure failure, flexure-shear failure and shear failure. Typical characteristics of the 3 modes in ABAQUS are shown through (Fig. 7-9). The sign of a flexure failure mode (Fig. 8) includes: yielding of the tensile longitudinal reinforcement, horizontal shear reinforcements' remaining elastic, damage concentration in the bottom confined area. The sign of a flexure-shear failure mode (Fig. 8) includes: yielding of the tensile longitudinal reinforcement, following small amount of yielding horizontal shear reinforcement, the damage's incline stretching out to web area from the bottom. The shear failure mode's indication (Fig. 9) includes: large amount of yielding shear reinforcement and saturation of concrete tensile damage in the web. The state of failure, with reference to literature [40], is defined as one of the following: 1). strain of the longitudinal reinforcement reaches the ultimate value, 2). strain of the compressive concrete surpasses the ultimate value, and 3). resistance of lateral load drops by 15%.
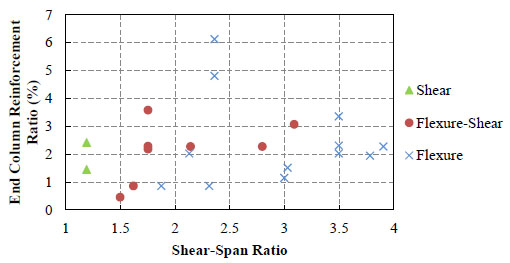
Relation between failure modes and shear-span ratio and reinforcement ratio of end columns.
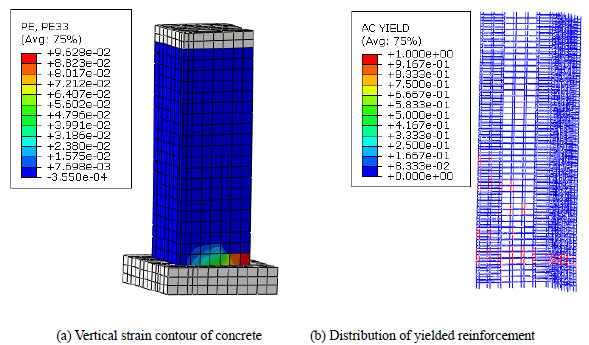
Typical features of flexure failure mode.
Typical features of flexure-shear failure mode.
Typical features of shear failure mode.
With reference to the collected 49 specimens and 216 FE models, further study of the influence of shear-span ratio, moment-shear ratio, reinforcement ratio and stirrup ratio of end columns on failure modes is carried out. Given the potential difference in two reversed directions, a judgment criterion for discerning failure modes of the overall shear wall is defined herein. The criterion is based on damage features of the flange submitted to both tension (negative direction) and compression (positive direction) and is listed in Table 3.
Criterion for failure modes discernment.
| Direction | Positive | Negative | Overall |
|---|---|---|---|
| Failure Modes | Flexure | Flexure | Flexure |
| Flexure-Shear | Flexure-Shear | ||
| Shear | Flexure-Shear | ||
| Flexure-Shear | Flexure | Flexure | |
| Flexure-Shear | Flexure-Shear | ||
| Shear | Shear | ||
| Shear | Flexure | Flexure-Shear | |
| Flexure-Shear | Shear | ||
| Shear | Shear |
To verify the above method, FE analysis is performed to several specimens. Failure modes prediction is shown in Table 4 where satisfactory coincidence between of test specimens and FE models is seen. Prediction for the 216 FE models is also conducted. The relation between the anticipated failure modes and factors including shear-span ratio, moment-shear ratio, reinforcement ratio of end columns is given in Fig. (10).
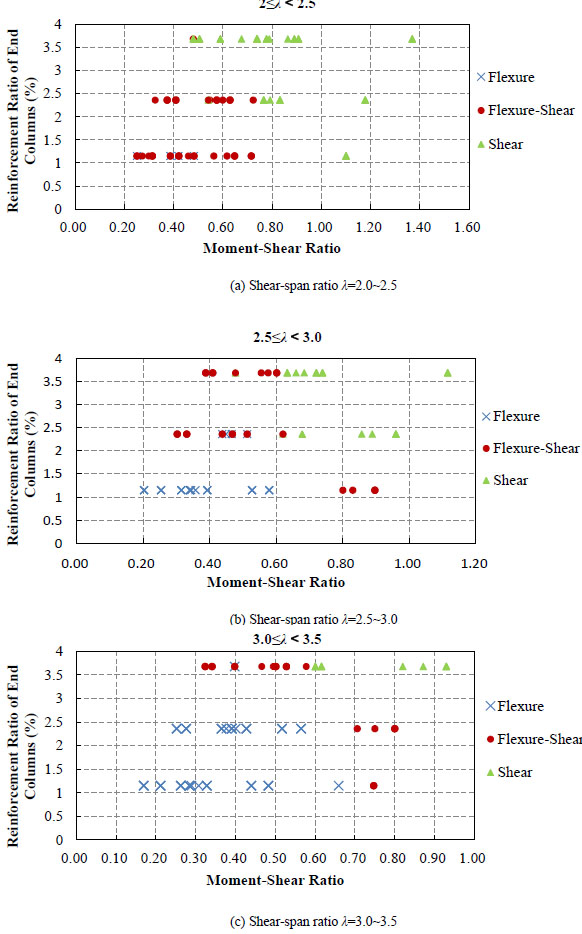
Relation between failure modes and shear-span ratio, moment-shear ratio and reinforcement ratio of end columns.
Comparison of failure modes of the L-section RC shear walls.
| Specimens | Failure Modes of FE Models | Failure Modes of Specimens | ||
|---|---|---|---|---|
| Positive direction | Negative direction | Overall | ||
| LSW-5 | Flexure | Flexure | Flexure | Flexure |
| LSW-6.5 | Flexure | Flexure | Flexure | Flexure |
| LSW-8 | Flexure | Flexure-Shear | Flexure-Shear | Flexure |
| SDL500-01 | Flexure | Flexure | Flexure | Flexure |
| SDL500-02 | Flexure-Shear | Flexure | Flexure-Shear | Flexure-Shear |
| SDL650-04 | Flexure | Flexure-Shear | Flexure-Shear | Flexure-Shear |
| L4 | Shear | Shear | Shear | Shear |
| L6 | Shear | Shear | Shear | Shear |
| ZL4 | Shear | Flexure-Shear | Shear | Shear |
According to ASCE/SEI 41-13 [41], failure is controlled by flexure when λ≥3, and by shear when λ<1.5, and by both flexure and shear when λ is in between. In addition to the geometric dimensions, the mechanical state under various loads is also as influential. But this factor has been omitted by ASCE/SEI 41-13. Thus, a more detailed criterion for failure modes judgment of L-section RC shear wall is given in Table 5. It is summarized on the basis of the numerical models, and has further involved the impact of flexure-shear ratio and reinforcement ratio of end columns. In Table 5, λ is the shear-span ratio, m is the moment-shear ratio and ρ is the reinforcement ratio of end columns.
Criterion for judgment of failure modes of the L-section RC shear wall.
| Failure Modes | Conditions | |
|---|---|---|
| Shear | λ<1.5 | |
| λ≥1.5 | m > 0.9 | |
| 1.5≤λ<2.0 | m≤0.9 & ρ > 2.5% | |
| 2.0≤λ<2.5 | 0.75<m≤0.9 & ρ≤3% | |
| m≤0.9 & ρ > 3% | ||
| 2.5≤λ<3.0 | 0.6<m≤0.9 & ρ > 2% | |
| 3.0≤λ<3.5 | 0.6<m≤0.9 & ρ > 3% | |
| Flexure-Shear | 1.5≤λ<2.0 | m≤0.9 & ρ≤2.5% |
| 2.0≤λ<2.5 | m≤0.75 & ρ≤3% | |
| 2.5≤λ<3.0 | 0.6<m≤0.9 & ρ≤2% | |
| m≤0.6 & ρ > 2% | ||
| 3.0≤λ<3.5 | m≤0.6 & ρ≥3% | |
| 0.6<m≤0.9 & ρ≤3% | ||
| Flexure | 2.5≤λ<3.0 | m≤0.6 & ρ≤2% |
| 3.0≤λ<3.5 | m≤0.6 & ρ≤3% | |
| λ<3.5 | m≤0.9 & ρ≤4% | |
The above standard is proved with satisfactory accuracy by comparing the predicted failure modes with the actual failure modes observed in the 49 specimens and 216 FE models. The rate of correct predictions is given in Table 6.
Statistical accuracy of failure modes prediction.
| Failure Modes | Accurately Predicted | Total Amount | Rate of Accuracy /% |
|---|---|---|---|
| Flexure | 89 | 111 | 80.2 |
| Flexure-Shear | 88 | 97 | 90.7 |
| Shear | 91 | 98 | 92.9 |
4. DEFORMATION LIMITS OF THE L-SECTION RC SHEAR WALLS
4.1. Selection of Deformation Index
The index of deformation shall represent the actual state of member performance, that is, to have high correlation with the extent of damage. The drift angle, as indicated by this study, is qualified to serve as reliable indicator of damage states. Calculation of drift angle is illustrated in Fig. (11). Total drift angle is the sum of the elastic and plastic drift angle. The elastic limits (the first limits) use elastic drift (also total drift) while other limits use plastic drift. This could give direct clues of the nonlinear deformation at each level, and is more convenient for practical use in most software.
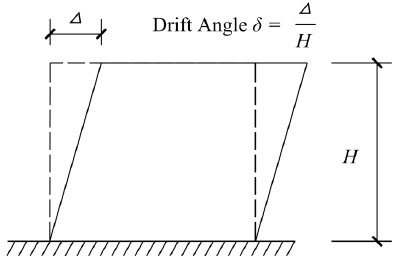
Drift angle of shear wall.
The derivation of the deformation limits in the loading direction that imposes tension to the flange is analyzed. Determination of the limits in the opposite direction follows exactly the same process and will not be presented herein for the sake of conciseness.
4.2. Factors Influencing the Deformation Limits
Based on the 7 damage levels of the L-section RC shear wall, 6 deformation limits represented by drift angle δ1e, δ2, δ3, δ4, δ5 and δ6 are put forward. Correlation analysis is carried out to study the relevance between deformation limits and factors including shear-span ratio, axial load ratio, end columns' longitudinal reinforcement ratio, end columns' stirrup ratio and moment-shear ratio, respectively. Relevance is considered strong when the p value of F-statistic is lower than 0.05.
According to the results given in Table 7 and Table 8, the axial load ratio and flexure-shear ratio are the two dominant factors over the deformation limits of flexure failure and flexure-shear failure. Since shear failure is brittle, large ductility is not expected. The deformation of the peak resistance δultimate is defined as ultimate deformation limit for shear failure. Moreover, data show high divergence of the limits δ2, δ3, δ4, δ5 defined in Table 1 when shear failure occurs. Some of the intermediate limits are even greater than δultimate. Thus, performance evaluation and control of shear-failure-walls only relies on the elastic limit δ1e and the ultimate limit δultimate. As can be seen in Table 9, shear-span ratio and longitudinal reinforcement ratio are main influential factors of δultimate.
Coefficient of correlation of various factors and the p value under flexure failure.
| Factor | Parameter | δ1e | δ2 | δ3 | δ4 | δ5 | δ6 |
|---|---|---|---|---|---|---|---|
| Axial Load Ratio | COV | 0.049 | -0.838* | -0.826* | -0.542* | -0.589* | -0.556* |
| p | 0.703 | 0.000 | 0.000 | 0.000 | 0.000 | 0.000 | |
| Shear-Span Ratio | COV | 0.761* | -0.056 | -0.077 | 0.277* | 0.183 | 0.213 |
| p | 0.000 | 0.664 | 0.551 | 0.028 | 0.151 | 0.094 | |
| Reinforcement Ratio of End Columns | COV | 0.841* | -0.213 | -0.213 | 0.052 | 0.032 | 0.106 |
| p | 0.000 | 0.093 | 0.094 | 0.684 | 0.801 | 0.410 | |
| Characteristic Value of Stirrup Ratio of End Columns | COV | 0.030 | 0.119 | 0.143 | 0.018 | -0.035 | -0.068 |
| p | 0.815 | 0.355 | 0.264 | 0.887 | 0.788 | 0.597 | |
| Moment-shear Ratio | COV | 0.152 | -0.699* | -0.715* | -0.667* | -0.640* | -0.598* |
| p | 0.212 | 0.000 | 0.000 | 0.000 | 0.000 | 0.000 |
Note: * Significant correlated at 0.1, * significant correlated at 0.05
Coefficient of correlation of various factors and the p value under flexure-shear failure.
| Factor | Parameter | δ1e | δ2 | δ3 | δ4 | δ5 | δ6 |
|---|---|---|---|---|---|---|---|
| Axial Load Ratio | COV | -0.426* | -0.749* | -0.743* | -0.718* | -0.602* | -0.556* |
| p | 0.015 | 0.000 | 0.000 | 0.000 | 0.000 | 0.000 | |
| Shear-Span Ratio | COV | 0.664* | -0.214 | -0.244 | 0.027 | 0.051 | 0.083 |
| p | 0.000 | 0.031 | 0.018 | 0.533 | 0.668 | 0.869 | |
| Reinforcement Ratio of End Columns | COV | 0.843* | 0.074 | 0.094 | 0.335 | 0.317 | 0.262 |
| p | 0.000 | 0.989 | 0.747 | 0.857 | 0.886 | 0.611 | |
| Characteristic Value of Stirrup Ratio of End Columns | COV | 0.016 | 0.268 | 0.275 | -0.047 | -0.082 | -0.107 |
| p | 0.385 | 0.043 | 0.022 | 0.194 | 0.111 | 0.087 | |
| Moment-shear Ratio | COV | -0.277* | -0.612* | -0.610* | -0.808* | -0.719* | -0.660* |
| p | 0.151 | 0.000 | 0.000 | 0.000 | 0.000 | 0.000 |
Note: * Significant correlated at 0.1, * significant correlated at 0.05
Coefficient of correlation of various factors and the p value under shear failure.
| Factor | Parameter | δ1e | δultimate |
|---|---|---|---|
| Axial Load Ratio | COV | -0.898** | 0.034 |
| p | 0.000 | 0.584 | |
| Shear-Span Ratio | COV | -0.028 | 0.660** |
| p | 0.364 | 0.000 | |
| Reinforcement Ratio of End Columns | COV | 0.407** | -0.559** |
| p | 0.000 | 0.000 | |
| Characteristic Value of Stirrup Ratio of End Columns | COV | 0.211 | -0.151 |
| p | 0.252 | 0.624 | |
| Moment-shear Ratio | COV | -0.757** | 0.007 |
| p | 0.000 | 0.311 |
Note: * Significant correlated at 0.1, * significant correlated at 0.05
4.3. Fitted Formulas of Deformation Limits
Deformation limits at different performance levels are fitted into linear formulas. Only the 2 most dominant variables are considered as variables. The fitted formulas are given in Table 10.
Fitted formulas of deformation limits (Drift Angle).
| Failure Mode | Fitted Formula | COV |
|---|---|---|
| Flexure | δ1e = 0.0019+0.0003<+0.0004ρ | 0.928 |
| δ2 = 0.00625-0.0057n-0.0023m | 0.849 | |
| δ3 = 0.0084-0.0071n-0.0041m | 0.843 | |
| δ4 = 0.0168-0.0010n-0.0139m | 0.806 | |
| δ5 = 0.0217-0.0012n-0.0159m | 0.837 | |
| δ6 = 0.0254-0.0019n-0.0163m | 0.849 | |
| Flexure-Shear | δ1e = 0.0018+0.0002<+0.0005ρ | 0.867 |
| δ2 = 0.0039-0.0030n-0.0001m | 0.819 | |
| δ3 = 0.0051-0.0042n-0.0001m | 0.849 | |
| δ4 = 0.0134-0.0028n-0.0080m | 0.837 | |
| δ5 = 0.0168-0.0022n-0.0097m | 0.812 | |
| δ6 = 0.0201-0.0023n-0.0103m | 0.787 | |
| Shear | δ1e = 0.0025+0.0001<+0.0004ρ | 0.871 |
| δultimate = 0.0075+0.0028<-0.0010ρ | 0.851 |
4.4. Criteria of Deformation Limits
The criteria of deformation limits are established based on axial load ratio and moment-shear ratio. Limits of shear failure mode are determined conservatively as a lower bound value. The limits criteria are given in Table 11 value of the limits is determined as mean minus one time standard deviation.
Deformation limits for the L-section RC shear walls.
| n | m | δ1e | δ2 | δ3 | δ4 | δ5 | δ6 | ||
|---|---|---|---|---|---|---|---|---|---|
| i. Flexure Failure | |||||||||
| Flange in Compression | ≤0.1 | ≤0.3 | 0.0025 | 0.0090 | 0.015 | 0.018 | 0.023 | 0.026 | |
| ≤0.1 | ≥0.5 | 0.0025 | 0.0080 | 0.014 | 0.017 | 0.020 | 0.023 | ||
| ≥0.3 | ≤0.3 | 0.0025 | 0.0070 | 0.013 | 0.016 | 0.018 | 0.021 | ||
| ≥0.3 | ≥0.5 | 0.0025 | 0.0060 | 0.012 | 0.015 | 0.016 | 0.019 | ||
| Flange in Tension | ≤0.1 | ≤0.3 | 0.0020 | 0.0045 | 0.007 | 0.013 | 0.018 | 0.021 | |
| ≤0.1 | ≥0.5 | 0.0020 | 0.0030 | 0.005 | 0.010 | 0.015 | 0.018 | ||
| ≥0.3 | ≤0.3 | 0.0020 | 0.0020 | 0.003 | 0.008 | 0.012 | 0.015 | ||
| ≥0.3 | ≥0.5 | 0.0020 | 0.0015 | 0.002 | 0.005 | 0.008 | 0.010 | ||
| ii. Flexure-Shear Failure | |||||||||
| Flange in Compression | ≤0.1 | ≤0.3 | 0.0025 | 0.0070 | 0.014 | 0.016 | 0.021 | 0.024 | |
| ≤0.1 | ≥0.5 | 0.0025 | 0.0060 | 0.012 | 0.014 | 0.018 | 0.021 | ||
| ≥0.3 | ≤0.3 | 0.0025 | 0.0040 | 0.010 | 0.012 | 0.016 | 0.018 | ||
| ≥0.3 | ≥0.5 | 0.0025 | 0.0030 | 0.008 | 0.010 | 0.012 | 0.015 | ||
| Flange in Tension | ≤0.1 | ≤0.3 | 0.0020 | 0.0030 | 0.005 | 0.010 | 0.015 | 0.018 | |
| ≤0.1 | ≥0.5 | 0.0020 | 0.0020 | 0.004 | 0.008 | 0.013 | 0.016 | ||
| ≥0.3 | ≤0.3 | 0.0020 | 0.0010 | 0.003 | 0.006 | 0.008 | 0.010 | ||
| ≥0.3 | ≥0.5 | 0.0020 | 0.0010 | 0.002 | 0.004 | 0.006 | 0.008 | ||
| iii. Shear Failure | |||||||||
| Drift Angle | 0.0025 | 0.008 | |||||||
CONCLUSION
- Categorization criteria of failure modes of L-section RC shear wall are proposed on the basis of 49 collected specimens and 216 FE models. The criteria not only consider shear-span ratio, but also take account of the moment-shear ratio and longitudinal reinforcement ratio.
- In accordance with the Chinese seismic code, 7 performance levels are put forward: intactness, light damage, light-moderate damage, moderate damage, relatively severe damage, severe damage and failure. The strain-based standard of determining such states are also presented.
- Statistical study of test specimens and FE models is conducted. Fitted formulas of calculating deformation limits at 6 performance levels are concluded. The formulas fully account for the impact of axial load ratio and moment-shear ratio. The deformation limits criteria are summarized in the form of a table, which shall supply technical supports for performance based earthquake engineering.
CONFLICT OF INTEREST
The authors confirm that this article content has no conflict of interest.
ACKNOWLEDGEMENT
This research is supported in part by National NSFC (Natural Science Foundation of China) (51378221) and State Key Laboratory of subtropical Building Science Foundation (20152A05).

