All published articles of this journal are available on ScienceDirect.

Prediction on Water-flowing Fractured Region Based on 3D Simulation Technology
Abstract
Caving zone and fractured zone both appear in the Changzhi Basin in China as the a large number of coal are mined from the area. Based on ore cluster mining and on GIS (Geographic Information System) technology, in the paper, it combines the 3-D (three dimensional) simulation technology and adopts the spacial interpolation method to develop the 3-D stratigraphic model of the studied region, the 3D stratigraphic model and the division idea which is applicable for the study region are obtained. The virtual drilling technology is applied to obtain precise stratigraphic data and calculate the heights of the caving zone and fractured zone of Changzhi Basin, their relative locations to the overlying aquifer and the water-flowing fractured region of influence based on computer-simulated data are both analyzed. In addition, it also puts forward the concept of effective water-flowing fractured rate, which lays a solid foundation for further study on the heterogeneous evolution of the spatial structure of regional aquifers after the coal mining which also can provide a data support for future studies on the heterogeneous evolution features of water-bearing media.
1. INTRODUCTION
As known that coal mining can directly affect underground water as a result of coal mining, the overlying aquifers of mined-out area are destructed to various extents due to the breaking and collapse of the roof; as long as the overlying aquifers are destructed, the impact will be permanent. Changzhi Basin is extremely rich in coal resource, and its coal-bearing area reaches 1,334km2, which accounts for about 2/3 of the gross area of the basin. Although the coal mining has not caused large scale collapse, but the collapses can be seen everywhere locally and in small scale, which means that certain impact has already been affected by the surface and underground water resource. According to statistics, coal mining has caused the drop of water level, and the cutoff of springs and wells in Changzhi Basin, and about 170,000 people have difficulty in getting drinking water as a result. The increasingly intensified conflict between coal mining and water conservation has seriously influenced both on the sustainable development of resources and environment as well as the daily life of people in the mining area.
Previous studies mainly are concern on the development of "three zones" (caving zone, fractured zone and sagging zone) and the complex relationships among various influencing factors of the stratum; as far as the collapse scope of mined-out area is concerned, now the studies mainly concern on its formation mechanism. Some of them use mathematical methods to forecast the fissure height of mined areas [1-4], but they have not analyzed the influence of fractured area with the use of three-dimensional computer simulation technology and virtual drilling technology. 3D geological modelling is a rapidly expanding discipline as demand for knowledge about the structure and composition of the subsurface is increasing, Additionally, this growth is facilitated by developments in computer technology and software [5]. The science team of UCGS established a Three-dimensional hydrogeologic framework model for use with a steady-state numerical ground-water flow model of the Death Valley regional flow system, Nevada and California [6], and since then many scholars have carried out the application research of groundwater resources information management and visualization technology, they have built a series of three-dimensional hydrogeological models [7-11]. Three-dimensional hydrogeological modeling technology broke the previous limitations of two-dimensional expression of geological body, it can be more intuitive description of the image and groundwater storage space and property-related geological structure, can be used as a platform for numerical simulation of groundwater, improve hydrogeological calculation results of the evaluation.
Through applying the 3D simulation technology, the study can precisely determine the thickness of the stratum, and the fractured region of mined-out area. Under the condition of ore cluster mining, the underground water resource within the region is destructed, so the protection and utilization of water resource in the mining area through the computer simulation technology are very important and the variation analyzing of regional aquifers after coal mining is also necessary.
The area of study.
Three-dimensional monolayer stratum model.
2. OVERVIEW OF STUDY REGION
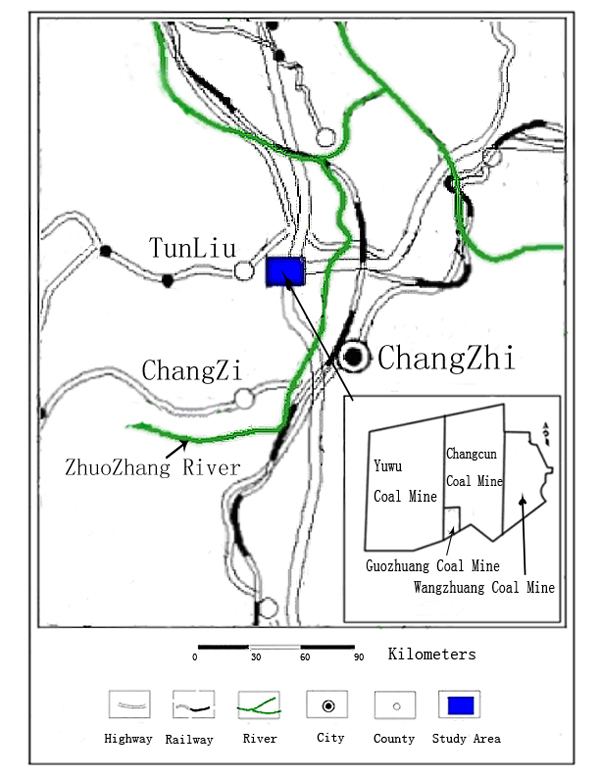
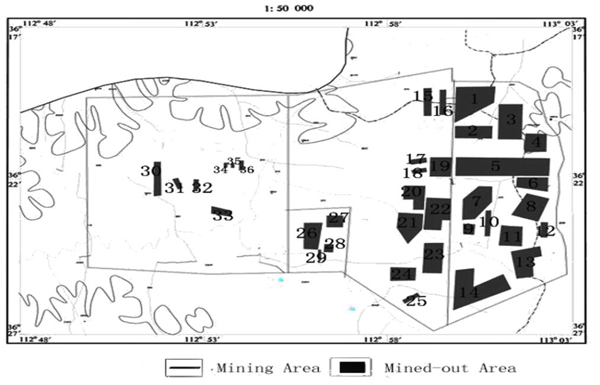
The study region is constituted by Wangzhuang Coal Mine, Changcun Coal Mine, Guozhuang Coal Mine and Yuwu Coal Mine, they are located in the southeast of Lu'an Mining Area in China, on the west side of the middle section of Taihang Mountains and in the northwest of Changzhi Basin. From a general survey of the whole region, its altitude trend is high in the northwest and low in the southeast, with gentle and low mountains and hills distributed mainly in the north; falling within the typical continental climate zone, this region has a dry and windy climate and has four distinctive seasons and it has significant annual and daily temperature differences, hot in the afternoon and cool at night in summers; the rivers run across in this region include the south source and west source of Zhuozhanghe River, both of which belong to the Zhanghe River System of Haihe River Basin; the region also has the features of water-coal intergrowth, and has a complete hydrogeological unit. Its relative location of the mining area is as in Fig. (1). Among the coal mines in the study region the primary mining objective is the coal seam #3, which is a flat seam, featuring of high thickness (with an average thickness of about 6.56m) and stability, and runs approximately in the south-north direction, and inclining angle to the west is about 2-6°.
3. 3-D STRATIGRAPHIC LAYERED MODEL
3.1. Modeling Basis and Method
In the study of underground geologic body, given that the underground drilling data are limited and mostly discrete data. It is necessary to conduct a quantitative and systematic study; if the existing data can not satisfy the study demand, data and information must be supplemented in a sufficient amount. The computer simulation technology usually employs the given data on the interior of a geologic body to execute spatial interpolation for other regions; although there exists errors in the data obtained through spatial interpolation. The accuracy results can be obtained at a low input. Therefore, the spatial data interpolation method has become an effective approach for supplementation of geologic data, and has been extensively applied in numerical simulation.
The topography is flat and drilling distribution is uniform in the research region. The inverse distance interpolation method is combined with GIS technology and drilling data in the study for modeling. The inverse distance weighted interpolation method was first proposed by Shepard, and later received a gradual development; the method is mainly based on the principle of the nearer, the shorter the distance between two objects, the more similar their properties will be. It takes the distance between the interpolation point and the sample point as the weight for weighted average; the shorter the distance between a sample point and the interpolation point, the higher the weight of the sample point will be. The algorithm of grid surface produced by the inverse distance weighted interpolation method is simple and is easy to be realized, and currently many 3D geologic modeling software have provided the method to build the grid interpolation surface. Under the circumstances of the geological conditions changing insignificantly and the data being uniformly distributed or relatively rare, the surface produced by interpolation is relatively smooth [1]. The basic idea here is that, if given the coordinates (xi,yi) (i=1, 2, 3, n ) and the attribute values (zi) (i=1, 2, 3, n ) of various points in the space and the coordinate z(x, y) of the point to be estimated, the attribute value z (x, y) of the point to be estimated can be defined as the weighted average of the attribute values of these points as below:
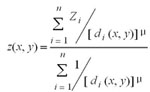 |
(1) |
where,  , represents the distance (i=1,2,3,...,n) between the point (x, y) and the point (xi, yi) , while the power exponent μ of weight coefficient is assigned with the value of 2.
GIS technology is the product of interdisciplinary cross based on geographic space, it adopts the geographic model analysis approach to provide various spatial and dynamic geographic information. The study takes MapGIS K9 software as the platform and utilizes SQL Server 2005 database to build drilling database.
Drilling data are the first-hand technical data recorded and complied by geologic technicians in field drilling site, and the basic modeling data which must be entered into the database before modeling by MapGisK9. After being read in the database, drilling data also need the generalization processing before being used for modeling. In addition, drilling data can clearly reflect the actual stratum situation, and realize stratigraphic division based on the actual stratum situation of the study region.
3.2. Example of Layered Modeling
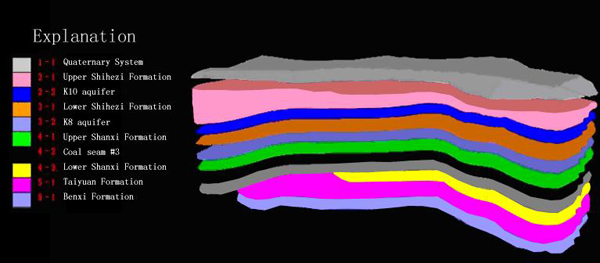
In the study region the primary mining objective is the coal seam #3, the analysis of the aquifers and aquicludes influenced by the primary mining seam in the study region is exploited for the generalization of drilling data, the standardization of initial stratum and the stratigraphic division. The MapGis K9 platform-based urban 3D geologic modeling system is employed in the 3D modeling. The first move is to build the 3D stratigraphic model of the study region at initial state on the ground of the stratigraphic information of the region under unmined state. The strata from above to below are divided into quaternary system, Upper Shihezi Formation, Lower Shihezi Formation, Shanxi Formation, Taiyuan Formation and Benxi Formation, etc.; the study coal seam is seam #3, and the aquifers studied are the overlying aquifers K10 and K8 which are influencing the seam #3. The stratigraphic division is shown in Table 1.
Stratigraphic sequence table.
| Stratum Code | Stratum Name |
|---|---|
| 1-1 | Quaternary System |
| 2-1 | Upper Shihezi Formation |
| 2-2 | K10 Aquifer |
| 3-1 | Lower Shihezi Formation |
| 3-2 | K8 Aquifer |
| 4-1 | Upper Shanxi Formation |
| 4-2 | Coal Seam #3 |
| 4-3 | Lower Shanxi Formation |
| 5-1 | Taiyuan Formation |
| 6-1 | Benxi Formation |
The data needed in the model mainly includes drilling data, surface contour line map, geologic and geomorphologic map, remote sensing data, etc. First the top elevation of the drilling should be employed to execute the elevation-based interpolation for the surface, so as to produce the drilling point-position map which is mainly used to control the surface-section morphology of the model. In essence, the drilling point-position map and surface contour map can be combined to complete the import of the geomorphologic division map of the model. The second step is to construct the stratigraphic division map, i.e., the distribution of a single stratum in the modeling region. Based on the drilling point-position map and drilling data, the corresponding stratigraphic distribution map is constructed, and the horizontal modeling scope of the stratum is thus drawn up in line with the actual geologic situation.
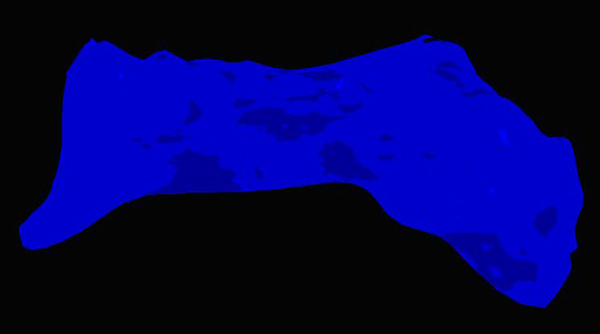
The third step is to build a 3D model. For one type of models, the top surface can be obtained through a direct combination of the bottom surfaces of other strata and the exposure stratum section, and they are collectively referred to as the simple models; for the other type of models, the top surface can not be obtained through such a simple combination and must be obtained through a combination of the exposure stratum section and the geologic surface produced by cutting the bottom surface of its upper stratum as indicated by the stratigraphic division map, and they are collectively referred to the complex models. The complex model is constructed in the study, and a mono-stratum block model needs to be constructed for each stratum of the study region after generalization. After the top surface, bottom surface and side surface models of a stratum are constructed, these three surfaces can be used to construct the block model of the stratum. Fig. (2) gives an example of a mono-stratum block model, and Fig. (3) gives an example of the combined block model of a stratum.
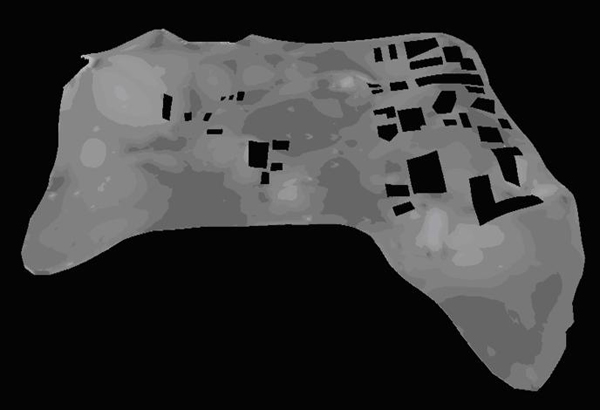
After the completion of stratigraphic modeling, GIS technology needs to be employed to determine the specific location of mined-out area, and to number various mined-out areas based on the mine boundary, so as to produce the mined-out area model, as indicated in Fig. (4). Among all the mining areas, Wangzhuang Coal Mine, Changcun Coal Mine and Guozhuang Coal Mine have gone through long mining periods, so their mined-out areas are relatively large; while the mined-out area of Yuwu Coal Mine is relatively small. On the basis of the distribution map of mined-out area, 3D simulation can be conducted on the scope of mined-out area, so as to precisely produce a 3D collapse model of mined-out area, as indicated in Fig. (5), or a stratigraphic section can be prepared as needed for analytic study. After determining the location of mined-out area, the virtual drilling technology can be employed to dig out the virtual drillings on the boundary and within the regional content of mined-out area, and the data hereby obtained can be used to analyze the height of the breaking zone and the region of influence of the fracture in mined-out area.
4. VIRTUAL DRILLING
Virtual drillings are hypothetical control drillings affixed as needed at certain locations during the process of geologic modeling; the information of the stratigraphic position reflected by these drillings are not obtained through actual drilling practice, but deduced by researchers on the basis of data obtained through experience and other supplementary means [2, 3]. The study here has employed a 3D strati-graphic model to determine the locations of these virtual drillings in accord with the scope and shape of mined-out area. The data on these virtual drillings can be used to obtain relatively precise data of various strata in the model, and calculate out the average mining thickness of coal seam for further study. Data on virtual drillings are collected in various mined-out areas of the study region, and used to calculate out the average mining thickness of coal seam, as indicated in Table 2.
Statistical table of the average mining thickness on coal seam #3.
| Numberof Mined-Out Areas | The Average Mining Thickness | Numberof Mined-Out Areas | The Average Mining Thickness | Numberof Mined-Out Areas | The Average Mining Thickness |
|---|---|---|---|---|---|
| (m) | (m) | (m) | |||
| 1 | 6.75 | 13 | 6.6 | 25 | 5.78 |
| 2 | 5.81 | 14 | 7.02 | 26 | 5.21 |
| 3 | 6.61 | 15 | 5.82 | 27 | 5.08 |
| 4 | 6.58 | 16 | 5.77 | 28 | 5.11 |
| 5 | 6.7 | 17 | 6.18 | 29 | 5.32 |
| 6 | 6.55 | 18 | 6.15 | 30 | 4.98 |
| 7 | 6.33 | 19 | 6.23 | 31 | 5.75 |
| 8 | 6.16 | 20 | 6.05 | 32 | 7.12 |
| 9 | 6.06 | 21 | 6.17 | 33 | 7.25 |
| 10 | 6.26 | 22 | 6.26 | 34 | 7.21 |
| 11 | 6.55 | 23 | 5.87 | 35 | 7.02 |
| 12 | 6.35 | 24 | 6.35 | 36 | 4.97 |
5. ANALYSIS ON FRACTURED REGION OF INFLUENCE
5.1. Fractured Zone Height of Water Flowing
The determination of water flowing fractured zone height is one of the important work of surface mining under waterbodies. It is one of the important basis for management of coal mine roof water disasters. It is the main basis of waterproof coal pillar size [3, 4].
Three-dimensional stratum model.
The traditional empirical formula for calculation the value of the height of fractured zone only considers the factor of mining thickness, while the actual development of conductivity fracture zone height also has the relationship with coal mining, length of working face, mining method, the gob area, the dip angle of coal seam and coal seam roof lithology combination and other factors. Effective numerical simulation method can overcome the disadvantages of empirical formula, in the study, it is through the FLAC numerical simulation method to get the height of water flowing fractured zone.
The distribution of gwag.
In the numerical model, it take No.3 coal seam of wangzhuang coal mine as an example, and the three-dimensional numerical model is established based on the characteristics of mining parameters, and its characteristics are as follows: dip angle of coal seam is 2°-6° and is nearly horizontal seam, model of profile control is divided into 3500 units, in order to simplify the grid subdivision work workload, the lithology and mechanics properties of rock close are looked as a modeling layer, the rock mechanics simulation parameters are shown in Table 3.
Rock mechanics simulation parameters.
| No | Characteristics | Tensile Strength(Mpa) | Cohesion(Mpa) | Angle of Internal Friction (°) | Poisson's Ratio | Modulus of Elasticity (104Mpa) |
|---|---|---|---|---|---|---|
| 1 | Siltstone | 4.68 | 4.59 | 36.2 | 0.22 | 0.96 |
| 2 | Sandy mudstone | 1.56 | 3.62 | 38.6 | 0.19 | 0.51 |
| 3 | Grit | 2.52 | 4.91 | 42.8 | 0.17 | 1.17 |
| 4 | Sandy mudstone | 2.36 | 6.52 | 36.5 | 0.28 | 0.88 |
| 5 | Mudstone | 1.15 | 2.22 | 26.7 | 2.06 | 0.12 |
| 6 | Fine sandstone | 2.92 | 7.16 | 38.1 | 0.18 | 1.72 |
| 7 | Siltstone | 10.34 | 10.58 | 37.9 | 0.11 | 1.96 |
| 8 | Coal | 1.35 | 2.40 | 42.5 | 0.26 | 0.67 |
| 9 | Sandy mudstone | 1.21 | 10.67 | 31.8 | 0.15 | 0.76 |
Through FLAC simulation, the output simulation results can be obtained, the maximum height of mined-out area overlying water transmitting fissure zone is 111.67m. Through the same simulation principle and calculation method, maximum height of the other 35 mined-out area overlying water transmitting fissure zone are as shown in Table 4.
Through numerical simulation analysis, the No. 3 coal mining overburden water flowing fractured zone height is 114.75 m, the top of the floor of k10 aquifer is 65 m to the the top of floor K8 aquifer on average, when the coal seam mining, rock lead water crack brings total height will be over 80 m, in this way, K8 aquifer and k10 aquifer water will flow into the underground as shown in Fig. (6).
5.2. Advance Distance of Influence
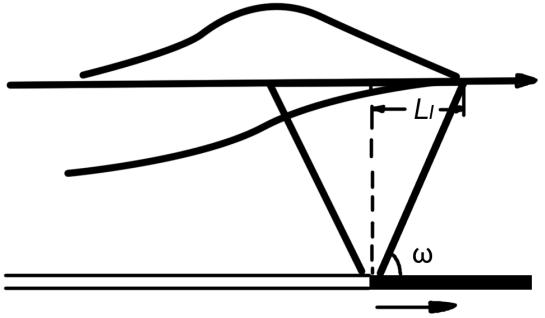
The data on rock movement and deformation during the mining process can be partially obtained through geophysical prospecting work, and partially obtained through computer simulation based on the data acquired in field operation. Advance angle of influence is the included angle between the horizontal line and the connecting line from the point located at a surface subsidence of 10mm in front of the working face to the location of working face in the driving surface then on the coal pillar side on the actually measured subsidence curve of trending principal section in the driving process of the working face after the expression of mined-out area in trending direction reaches full subsidence or nearly full subsidence; such an angle is represented as ω. The length of influence along the working face direction is referred to as the advance distance of influence, and represented as L1. The corresponding relationship is shown in Fig. (7).
Based on the empirical value of coal mine subsidence and the actual observed information of coal mine in the study region, ω, the advance angle of influence of mined-out area, is assigned with a value of 67° to calculate L1, the advance distance of influence. When we assign tan23 with a value of 0.4245, the tangent function formula is employed to calculate the advance distance of influence based on the heights of breaking zone of various mined-out areas, as indicated in Table 5.
Three-dimensional collapse model of coal seam #3.
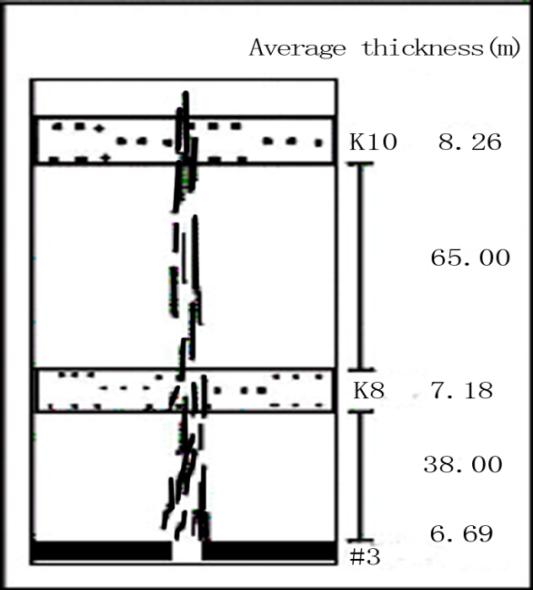
Coal seam #3 and overlying aquifer.
5.3. Fractured Region of Influence
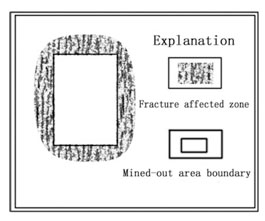
Based on the numeric simulation and operational analysis, after the subsidence of mined-out area of the coal seam #3 in the study region becomes stable, an approximately elliptic or round fractured region of influence will be formed around the mined-out area within the spatial scope of influence of advance distance of influence, as indicated in Fig. (8).
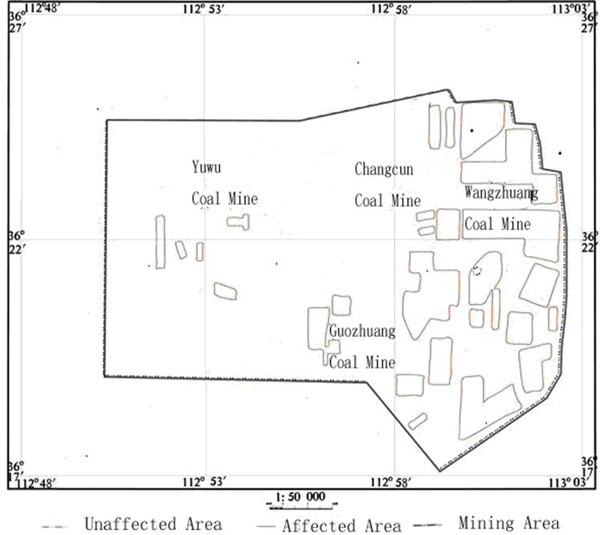
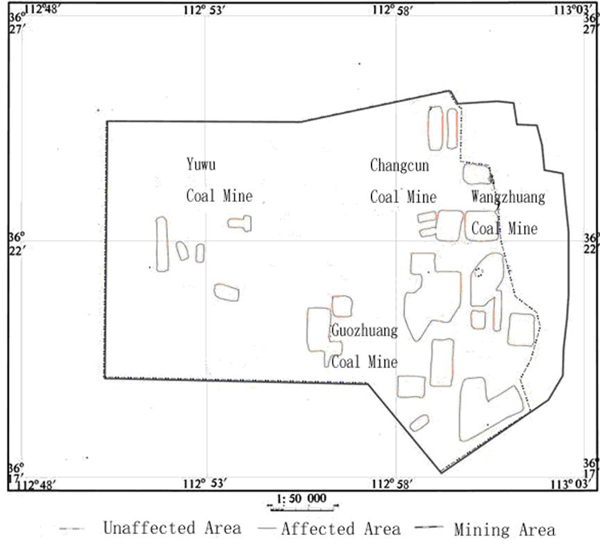
The overlying sandstone aquifers K8 and K10 of the coal seam #3 in the study region are mainly distributed in the fractured zone. In the fractured region of influence, the water of aquifers will partially swarm into the pit, resulting in obvious variation of water yield and imposing certain influence on coal mining; in the non-fractured region of influence, as influenced by the landform and the low water yield of aquifers, the variation of water yield of aquifers is relatively slow. See the fractured regions of influence of aquifers K8 and K10 respectively in Figs. (9 and 10). The fractured region of influence of mined-out area obtained through analysis can be employed to support the determination of actual geophysical prospecting region.
Advancing affected distance.
Fracture influence region of exploration area.
5.4. Effective Water-flowing Fractured Rate
The achievements of study on the water-flowing fractures can lay a foundation for studying the deformation of overlying rock stratum within the coal mining region of influence in a typical mining area, and can be employed to support the analysis of the heterogeneous evolution features of water-bearing media within the coal mining region of influence.
The study has thereby put forward the concept of effective water-flowing fractured rate, which is defined as the ratio of the volume of mined-out area to the fractured region of influence, and can be determined mainly through the simulation experiment, calculation and field exploration. The study of effective water-flowing fractured rate is mainly applied on the variation of the fractured rate of water-bearing media and the combination features of new water-bearing media. The time-varying distribution process and dynamic evolution of the water-flowing fractures of rock mass in the 3D space is the root cause which leads to the heterogeneous evolution of water-bearing media under mining condition. Current studies mainly focus on the water conductivity of fractures after connection, and study on the spatial dynamic evolution process of the development, expansion, connection and local closure of mining-induced fractures are still relatively weak.
High statistical table of fractured zone on no. 3 coal seam.
| Area Number | Water Flowing Fractured Zone Height (m) | Water Transmitting Fissure Zone Aquifer |
|---|---|---|
| 1 | 111.67 | K8, K10 |
| 2 | 106.81 | K8, K10 |
| 3 | 108.67 | K8 |
| 4 | 110.7 | K8 |
| 5 | 110.62 | K8, K10 |
| 6 | 109.32 | K8 |
| 7 | 107.7 | K8, K10 |
| 8 | 106.61 | K8 |
| 9 | 105.46 | K8, K10 |
| 10 | 106.12 | K8, K10 |
| 11 | 110.29 | K8, K10 |
| 12 | 106.75 | K8 |
| 13 | 110.82 | K8, K10 |
| 14 | 112.67 | K8, K10 |
| 15 | 103.22 | K8, K10 |
| 16 | 102.26 | K8, K10 |
| 17 | 106.42 | K8, K10 |
| 18 | 109.27 | K8, K10 |
| 19 | 105.97 | K8, K10 |
| 20 | 107.37 | K8, K10 |
| 21 | 106.73 | K8, K10 |
| 22 | 107.84 | K8, K10 |
| 23 | 104.3 | K8, K10 |
| 24 | 106.92 | K8, K10 |
| 25 | 103.5 | K8, K10 |
| 26 | 101.12 | K8, K10 |
| 27 | 97.27 | K8, K10 |
| 28 | 98.84 | K8, K10 |
| 29 | 100.88 | K8, K10 |
| 30 | 96.37 | K8, K10 |
| 31 | 102.76 | K8, K10 |
| 32 | 113.85 | K8, K10 |
| 33 | 114.75 | K8, K10 |
| 34 | 113.12 | K8, K10 |
| 35 | 112.93 | K8, K10 |
| 36 | 95.88 | K8, K10 |
Fracture influence region of k8 aquifer.
CONCLUSION
The application of 3D simulation technology, combined with virtual drilling auxiliary calculation, is a practical and feasible method and has features of a certain degree of universalità.
According to the actual situation, a 3D stratigraphic model and a division idea applicable for the study region has been put forward. Based on the lithologic features of the drilling data, the stratigraphic sequence of the 3D model of the core study region in Changzhi Basin can be divided layer by layer, so as to build a 3D stratigraphic model.
The 3D collapse model of mined-out area of coal seam #3 is built, and the fractured region of influence of mined-out area is discussed on the basis of data obtained through computer simulation, which provides referential opinions for further field geophysical prospecting work in selecting the exploration coverage. Meanwhile, the concept of effective water-flowing fractured rate is proposed in the study, which provides a data support for future studies on the heterogeneous evolution features of water-bearing media.
Distance statistical table of advancing affected distance on no. 3 coalSeam.
| Area Number | Water Fractured Zone Height (m) | Advance Distance (m) |
|---|---|---|
| 1 | 111.67 | 47.40 |
| 2 | 106.81 | 45.34 |
| 3 | 108.67 | 46.13 |
| 4 | 110.7 | 46.99 |
| 5 | 110.62 | 46.96 |
| 6 | 109.32 | 46.41 |
| 7 | 107.7 | 45.72 |
| 8 | 106.61 | 45.26 |
| 9 | 105.46 | 44.77 |
| 10 | 106.12 | 45.05 |
| 11 | 110.29 | 46.82 |
| 12 | 106.75 | 45.32 |
| 13 | 110.82 | 47.04 |
| 14 | 112.67 | 47.83 |
| 15 | 103.22 | 43.82 |
| 16 | 102.26 | 43.41 |
| 17 | 106.42 | 45.18 |
| 18 | 109.27 | 46.39 |
| 19 | 105.97 | 44.98 |
| 20 | 107.37 | 45.58 |
| 21 | 106.73 | 45.31 |
| 22 | 107.84 | 45.78 |
| 23 | 104.3 | 44.28 |
| 24 | 106.92 | 45.39 |
| 25 | 103.5 | 43.94 |
| 26 | 101.12 | 42.93 |
| 27 | 97.27 | 41.29 |
| 28 | 98.84 | 41.96 |
| 29 | 100.88 | 42.82 |
| 30 | 96.37 | 40.91 |
| 31 | 102.76 | 43.62 |
| 32 | 113.85 | 48.33 |
| 33 | 114.75 | 48.71 |
| 34 | 113.12 | 48.02 |
| 35 | 112.93 | 47.94 |
| 36 | 95.88 | 40.70 |
The developmental height of the overlying breaking zone of the core mined-out area is calculated, in order to analyze its relative relationship with the overlying aquifer. The conclusion is that, within the scope of influence of the mined-out area, the overlying aquifers K8 and K10 fall within the water-flowing fractured zone, and the water contained in these aquifers will partially swarm into the pit, imposing certain influence on coal mine production.
Fracture influence region of k10 aquifer.
CONFLICT OF INTEREST
The authors confirm that this article content has no conflict of interest.
ACKNOWLEDGEMENTS
The study is supported by Key project of national natural science funds of China “The research of regional ground water circulation trend caused by Group mining leads to aquifer structure variation” (NO: 41130637).

