All published articles of this journal are available on ScienceDirect.
Spatio-temporal Effect of Urbanization on Surface Water Bodies: A Method of RS and GIS
Abstract
This paper focuses on the spatio-temporal effects of urbanization on surface water resources in Wuhan, China. Specifically, the relationships between surface water bodies and their surrounding land use changes are discussed quantitatively by remote sensing (RS) and geographic information system (GIS). In this paper, surface water bodies and land use classifications in 1991 and 2005 are detected from Landsat TM/ETM+ images. On this basis, the area changes of water bodies and their transformations are extracted by overlap analysis. The result proves that most of the reduced surface water bodies had transformed into developed land in the urban districts. Finally, a comparative analysis indicates that the rate of increment of developed land in 100 m buffer (14%) is higher than in 1000 m buffer (8.8%). In other words, urban development is growing towards water bodies as urbanization. Therefore, the effects of urbanization on surface water bodies can be summarized as follows: (1) water bodies are likely to be occupied directly by developed land with urbanization; (2) the space of surface water is compressed due to urban expansion. This paper would provide a suggestion for urban planners and water resource managers.
INTRODUCTION
Over the past 30 years, urbanization has been improved significantly in China [1]. Especially in some large cities, population has increased sharply, and the real estate industry has become more prosperous. So the cities have expanded rapidly. At the same time, the rapid development put heavy pressures on ecology, resource and environment for the cities. For example, some extreme phenomena of water resources, such as water shortage, water pollution and urban stormwater, occur more frequently [2-6]. These problems are hindering the development of the cities and people’s lives. Surface water resource is an important part of urban water resources. It not only can provide the water supplies for productions and livings, but also would be useful for communities in regulating micro-climate and enhancing the capacity of flood storage [7]. In this paper, we focus on the spatio-temporal effect of urbanization on surface water resources in Wuhan, China. It would be very significant for water resources protection.
In terms of land use and cover change (LUCC), urbanization could be reflected in that urban land, such as residence and commercial land, is increasing. Researches about LUCC have been studied extensively. A part of researches focused on monitoring land use changes and modeling urban expansion by remote sensing (RS) and geographical information system (GIS).For instance, Zheng systematically investigated the conservation and recovery of grassland and forestland in Sichuan Province by CBERS II [8]; Du proposed a method to monitor urban impervious surface area change using CBERS images and one scene of HJ-1 image [9]; Abdullahi and Pradhan evaluated the mixed land use for Kajang City based on GIS [10]; and Razavi combined artificial neural network with Markov chain model to predict the trend of LUCC in Kermanshah City [11]. Some other researchers put emphasis on climatic and environmental changes due to urban development. Dale proved that there are some implied linkages between land use, climate change and energy [12]. Deng reviewed the impacts of LUCC on regional climate and discussed regional climate models in the development of agricultural land and urban land [13]. Lei and Radhi analyzed the urban heat island effect with urbanization and LUCC based using RS in Xuzhou, China and Bahrain respectively [14, 15].
In recent years, the effects of urbanization on water resources have been concerned widely. For example, Huang, Hettiarachchi and Chen indicated that urbanization led to a reduction in lakes and wetlands [16-18] Thulborn’s study improved the adjustment factor to predict the effect of urbanization on the flood frequency curve [19]; Miller proved that the relative increase in peak flows and reduction in flood duration and response time of a catchment is greatest at low levels of urbanization [20]; and Qin investigated water quality deterioration over the rapid urbanization in Shenzhen River catchment [21]. Liu, Jet and Du illustrated the effects of land use change on the quantity and quality of urban water resources using RS and GIS [22-24].
In spite of the above mentioned, there are still some lacks in the research about urban surface water area changes. Firstly, the studied area in most of the previous researches was usually considered as a catchment instead of a city. Secondly, the spatial scale difference of LUCC with location was usually ignored. In order to overcome these shortages, this paper tries to quantitatively investigate the area change of surface water bodies in Wuhan, China by RS and GIS. And the effect of spatial scale of land use on surface water bodies is discussed.
The main works of this paper are organized as follows: (1) to extract surface water bodies and land use classifications from Landsat TM/ETM+ images; (2) to compare the surface of water bodies in different periods and measure transformations from the reduced water area; (3) to measure land use changes in the riparian buffer zones; (4) and finally, to compare urban development in the different distances of riparian buffer zones.
MATERIALS AND METHODOLOGY
Study Area and Data Sources
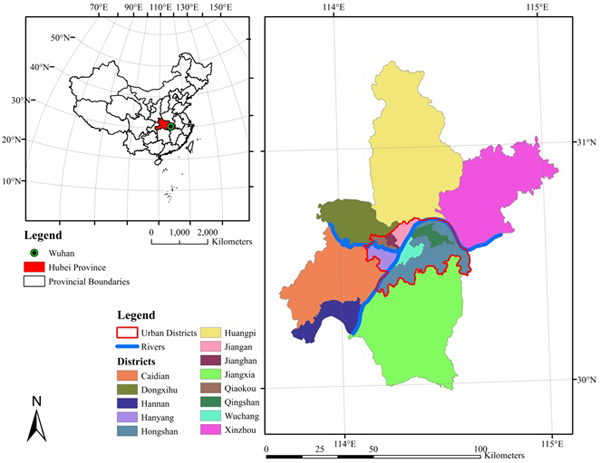
Wuhan (113°41’-115°05’ E, 29°58’-31°22’ N) is located in Central China, and is the capital of Hubei province. It lies in the eastern Jianghan Plain. And the Yangtze River and Han River intersect here. Wuhan is one of the biggest cities in China. The total area of Wuhan is 8 494.14 km2. As shown in the Fig. (1), there are 13 districts in Wuhan, seven central districts such as Jiang’an District are regarded as urban area, and the rest of them are considered as suburban area. The urban area is totally 888.42 km2, which accounts for approximately 10% of total area. On the other hand, according to Wuhan Statistical Yearbook in 2006, as of 2005, the total population was over 8 580 000 persons, and 5 317 000 persons of them lived in the urban area. So, the average population density in the urban area is 5 984 person per km2, even over 20 000 person per km2 in some central districts. It is considerably higher than 429 person per km2 in the suburban area.
Wuhan has a subtropical monsoon climate with abundant rainfall and four distinctive seasons. The annual average precipitation is 1 315.8 mm (1951-2013). And the Yangtze River and Han River intersect here as well. So, Wuhan has plentiful fresh water resources. There is approximately a quarter of the city covered by water bodies. But since the 1990s, with the rapid development of economy, the urban area has expanded significantly. The expansion of urban land led to irretrievable damages for water resources. Especially, filling in the lakes due to the development of real estate industry caused serious damage to surface water in Wuhan. A few lakes have even disappeared. A statistical result showed that 89 lakes had vanished away completely since the 1950s [26].
In this paper, surface water bodies in Wuhan are detected from Landsat images in 1991 and 2005 respectively (Table 1). During this period, the sharp growth of population led to the rapid development of real estate industry. Residences and commercial facilities had sprung up in Wuhan. And industries had been reconstructed. At the same time, the legislation for protection of surface water resources was not perfect yet. Therefore, the effect of urbanization on surface water bodies is typical during 1991and 2005. And according to the data from the National Climate Center of China, the accumulated precipitation before the image acquisition was 872 and 816 respectively, which showed that there was a similar nature condition in these two years.
| Date | Sensor | Spatial Resolution |
|---|---|---|
| 1991.7.19 | TM | 30 m (Band 1-5 and Band 7) |
| 2005.9.11 | ETM+ | 30 m (Band 1-5 and Band 7) |
Detection of Surface Water and Land Use Classification
The spectral characteristic of water is decreasing with wavelength. Thus surface water bodies is usually detected from Landsat images by Normalized Difference Water Index (NDWI) as Equation (1) [27]:
 |
(1) |
Xu [28] indicated that using NDWI is often mixed with built-up land noise. And the modified NDWI (MNDWI) as Equation (2) can enhance surface water bodies while suppressing and even removing built-up land noise as well as vegetation and soil noise.
 |
(2) |
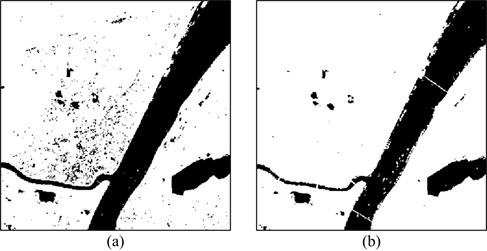
Fig. (2) shows extracted surface water bodies using NDWI and MNDWI respectively. MNDWI can surely suppress built-up land noise and enhance water bodies in Fig. (2b).
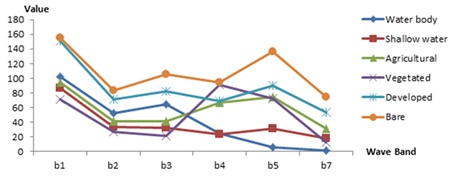
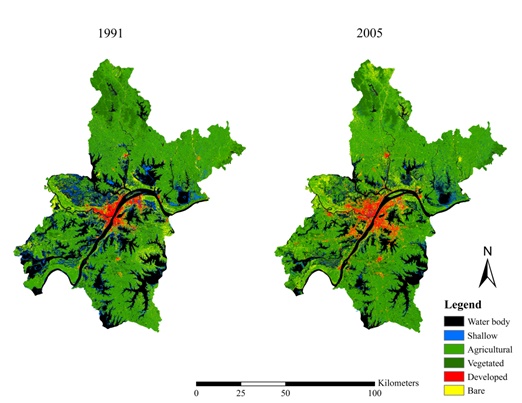
According to spectral characteristic, land use is divided into 6 categories as shown in Table 2. The reflectivity of each category was sampled and drawn in Fig. (3). Apart from the surface water bodies extracted by MNDWI, riparian land use was classified using ISODATA, which is a kind of cluster algorithm based on minimum spectral distance [29]. The ISODATA is a modification of the k-means clustering algorithm. In an iteration cycle, clusters are merged if their distance in multispectral feature space is less than a specified value; and a single cluster is split into two new clusters if its variance is larger than a specified value. The algorithm repeats these procedures until specified result is obtained or maximum number of iterations is reached. The ISODATA is the default method of unsupervised classification in Erdas Imagine software. So land use maps of Wuhan in 1991 and 2005 have been drawn by Erdas Imagine software as Fig. (4).
| Category | Remarks |
|---|---|
| Water body | Surface water bodies: rivers, lakes and ponds |
| Shallow water | Edge of water bodies: wetlands |
| Agricultural | Dry land and paddy fields |
| Vegetated | Nature forests and grasslands |
| Developed | Artificial areas: residential, commercial and industrial areas |
| Bare | Bare surfaces: bare lands and construction sites |
Measurement of Surface Water Bodies and Riparian Land Use Changes
In the ArcGIS software, spatial analysis tools such as overlap analysis and buffer analysis are applied to measure surface water bodies and their surrounding land use changes. There are three phases in this study.
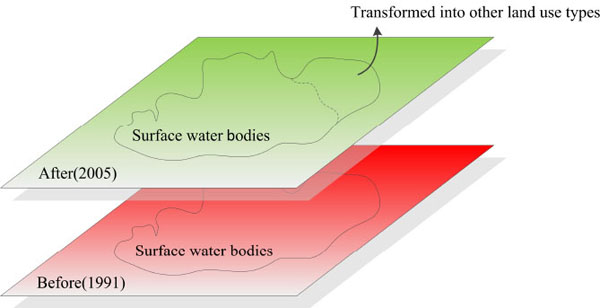
Firstly, extracted surface water bodies in 1991 and 2005 are compared to each other by overlap analysis as Fig. (5). Particularly, the decrement of surface water bodies during this period is calculated quantitatively. In order to indicate whether the decrement of surface water bodies is related with urbanization or not, the transformation of these reduced water bodies into other laud use types is detected. If most of reduced water bodies had been changed into developed land during this period, it can prove that urban development occupied surface water areas as urbanization. Then, the magnitude of each land use type from reduced water bodies is calculated with the districts as Fig. (1). If the decrement of surface water bodies is connected with urbanization, the spatial distributions of the transformation of reduced water bodies in the urban and suburban districts are different. In other word, reduced water bodies transformed into developed land in the urban districts are greater than in the suburban districts.
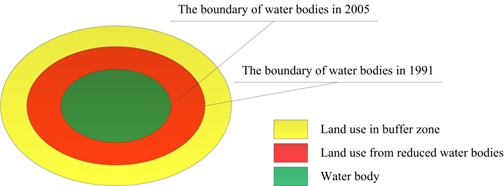
Secondly, in order to measure riparian land use change as urbanization, as shown in Fig. (6), a riparian buffer zone with 100 m width is drawn around the boundary of water bodies in 1991 using buffer analysis in ArcGIS software. And land use changes in this buffer zone during 1991 and 2005 are calculated with the districts as Fig. (1). If the proportion of developed land in riparian was raised during this period, it can indicate that urban development is becoming increasingly active around surface water bodies.
Even if develop land was increased in riparian, it could be independent of surface water bodies. So, in order to investigate the relationships between surface water bodies and urban expansion, finally, a riparian buffer zone with 1000 m width is delineated around the boundary of water bodies in 1991. And the proportion of developed land in 1000 m buffer zone is compared with it in 100 m buffer zone. It can indicate that the urban expansion is growing towards surface water bodies and compress the space of surface water bodies if the growth of developed land in 100 m buffer zone is faster than in 1000 m buffer zone.
RESULTS AND DISCUSSIONS
Decrement of Surface Water Bodies and their Transformations
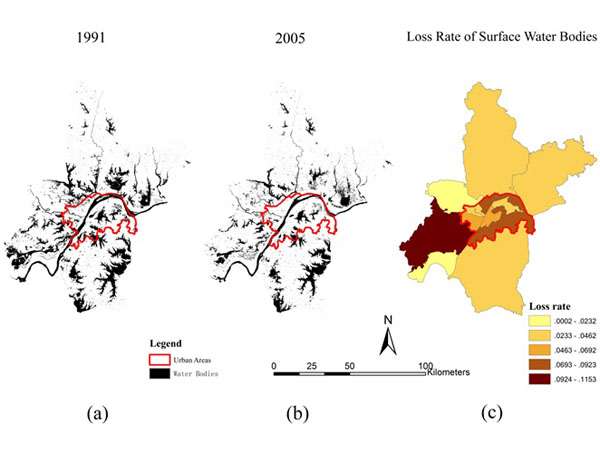
Surface water bodies in 1991 and 2005are extracted respectively as shown in Fig. (7a, b). There is an obvious decrement of surface water bodies in Wuhan during this period. In 1991, surface water bodies covered 20% of Wuhan and even 29% in the urban area. In 2005, the proportion of surface water bodies had been reduced to 15% and 22% in Wuhan and its urban area respectively. In other words, the decrement of surface water bodies in the urban area was more than in the suburban area. And it is validated as shown in Fig. (7c). Two of urban districts, Jiangan District and Hongshan District, had the greatest loss rate of 10.2% in the urban area. Note that about 14% of surface water bodies had been covered by other land use types in CaiDian District, which is even greater than any district in the urban area. It is possible that Wuhan Economic and Technological Development Zone has been developed since 1991.
The transformation of reduced surface water bodies is listed as Table 3. In the suburban area, most of reduced surface water bodies transformed into agricultural land (37%). And only 7.25% of reduced water area had been used to developed land after they were covered. And in the urban area, about 24% of reduced surface water bodies changed into developed land as well as agricultural and vegetated land. On the one hand, water resources conservation has been valued in Wuhan since the 2000s. So there are greenbelts in riparian zones to isolate water bodies from human activities. On the other hand, agricultural land is still main land use type in the edge of urban area.
| Category | District Name | Transformation (%) | ||||
|---|---|---|---|---|---|---|
| Shallow Water | Agricultural | Vegetated | Developed | Bare | ||
| Urban | HANYANG | 18.74 | 31.51 | 25.07 | 19.75 | 4.93 |
| WUCHANG | 12.81 | 10.81 | 16.06 | 47.96 | 12.36 | |
| QIAOKOU | 16.73 | 25.75 | 32.82 | 20.97 | 3.72 | |
| JIANGHAN | 8.82 | 3.54 | 7.22 | 69.21 | 11.21 | |
| QINGSHAN | 18.31 | 28.62 | 24.81 | 24.48 | 3.77 | |
| HONGSHAN | 19.75 | 25.35 | 26.76 | 18.83 | 9.3 | |
| JIANG'AN | 13.07 | 15 | 17.54 | 41.85 | 12.53 | |
| Average | 18.21 | 24.16 | 24.79 | 24.11 | 8.73 | |
| Rural | HANNAN | 28.50 | 41.96 | 17.95 | 10.45 | 1.14 |
| JIANGXIA | 35.19 | 36.84 | 16.47 | 9.05 | 2.46 | |
| CAIDIAN | 18.81 | 43.37 | 25.41 | 4.53 | 7.88 | |
| DONGXIHU | 19.19 | 32.7 | 27.8 | 13.7 | 6.6 | |
| XINZHOU | 28.02 | 31.57 | 27.06 | 8.28 | 5.07 | |
| HUANGPI | 27.53 | 36.19 | 22.21 | 6.03 | 8.04 | |
| Average | 26.41 | 37.43 | 23.01 | 7.25 | 5.89 | |
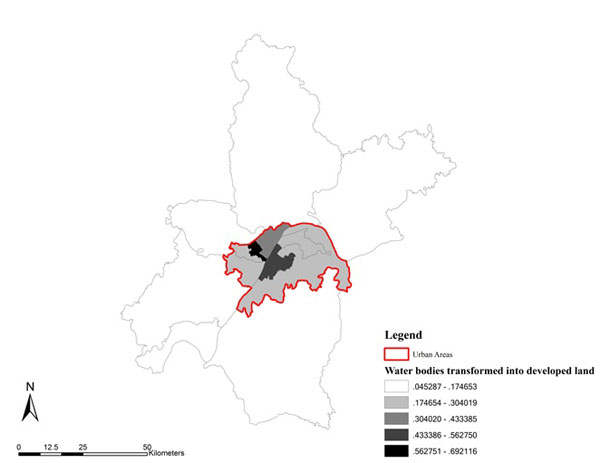
According to Table 3, the spatial distribution of the transformation of reduced surface water bodies into developed land could be drawn as Fig. (8). As shown, in the urban area, reduced water bodies were more likely to transform into developed land than in the suburban area. Particularly 69% of reduced water area had been used to commercial land or residential land in Jianghan District, the most prosperous district in Wuhan. Therefore, there is a correlation between surface water area change and urbanization.
Land Use Change in Buffer of Surface Water Bodies
Table 4 lists the proportion of each land use type in 100 m buffer of surface water bodies. As shown, the proportion of developed land in the urban area had been raised from 15.9% to 29.9% during 1991 and 2005, as well as bare land that had been raised from 2.5% to 11.7%. On the other hand, both these two land use types had slight and even negative growth in the suburban area.
| Category | District Name | Year | Percentage (%) | ||||
|---|---|---|---|---|---|---|---|
| Shallow | Agricultural | Vegetated | Developed | Bare | |||
| Urban | HANYANG | 1991 | 45.51 | 26.29 | 7.64 | 17.37 | 3.19 |
| 2005 | 11.29 | 25.67 | 23.66 | 29.13 | 10.26 | ||
| WUCHANG | 1991 | 37.99 | 22.37 | 2.03 | 34.55 | 3.05 | |
| 2005 | 7.55 | 10.82 | 8.33 | 65.63 | 7.67 | ||
| QIAOKOU | 1991 | 51.39 | 19.02 | 02.43 | 25.63 | 1.54 | |
| 2005 | 8.45 | 18.60 | 24.93 | 36.68 | 11.33 | ||
| JIANGHAN | 1991 | 35.56 | 20.86 | 2.91 | 37.26 | 3.41 | |
| 2005 | 5.06 | 2.37 | 6.67 | 74.75 | 11.15 | ||
| QINGSHAN | 1991 | 51.23 | 26.06 | 4.9 | 15.55 | 1.72 | |
| 2005 | 12.53 | 28.26 | 21.77 | 32.84 | 4.6 | ||
| HONGSHAN | 1991 | 46.9 | 33.19 | 7.63 | 9.77 | 2.52 | |
| 2005 | 10.68 | 28.98 | 27.69 | 20 | 12.66 | ||
| JIANG'AN | 1991 | 42.62 | 21.06 | 8.26 | 25.99 | 2.07 | |
| 2005 | 5.57 | 12.57 | 19.52 | 43.85 | 18.49 | ||
| Average | 1991 | 46.06 | 28.74 | 6.75 | 15.93 | 2.52 | |
| 2005 | 10.03 | 24.56 | 23.84 | 29.91 | 11.66 | ||
| Rural | HANNAN | 1991 | 46.37 | 30.93 | 14.79 | 6.45 | 1.46 |
| 2005 | 19.9 | 44.47 | 20.61 | 5.97 | 9.05 | ||
| JIANGXIA | 1991 | 37.2 | 33.54 | 14.28 | 4.58 | 10.4 | |
| 2005 | 8.24 | 41.71 | 21.34 | 7.88 | 20.83 | ||
| CAIDIAN | 1991 | 45.9 | 33.24 | 10.06 | 6.53 | 4.27 | |
| 2005 | 8.75 | 45.28 | 24.26 | 6.98 | 14.73 | ||
| DONGXIHU | 1991 | 52.46 | 25.45 | 6.4 | 13.41 | 2.28 | |
| 2005 | 13.15 | 40.73 | 22.11 | 12.15 | 11.87 | ||
| XINZHOU | 1991 | 29.81 | 28.82 | 16.99 | 8.73 | 15.65 | |
| 2005 | 13.91 | 49.25 | 27.6 | 5.31 | 13.93 | ||
| HUANGPI | 1991 | 24.84 | 37.73 | 15.63 | 6.18 | 15.62 | |
| 2005 | 9.37 | 40.81 | 27.26 | 3.63 | 18.94 | ||
| Average | 1991 | 35.66 | 32.93 | 13.76 | 6.94 | 10.7 | |
| 2005 | 10.46 | 41.61 | 24.65 | 6.38 | 16.89 | ||
Tables 5 and 6 list the land use transfer matrixes of the 100 m buffer during 1991 and 2005 in the urban and suburban areas respectively. According to Tables 5 and 6, shallow water and agricultural land are the main inputs in the urban area as well as in the suburban area. However the main outputs in Tables 5 and 6 are different: developed land (31.9%) is the most output in the urban area; and vegetated (34.6%) and agricultural (31.6%) land are the main output in the suburban area. Therefore, with urbanization, the wetlands in the waterside would be developed.
| Input\Output (%) | Shallow Water | Agricultural | Vegetated | Developed | Bare | Total Input |
|---|---|---|---|---|---|---|
| Shallow Water | 7.191911 | 10.55486 | 9.471465 | 12.59442 | 3.296413 | 43.10907 |
| Agricultural | 1.642699 | 8.71441 | 8.85397 | 7.275798 | 3.74077 | 30.22765 |
| Vegetated | 0.210793 | 1.413129 | 2.492882 | 1.58613 | 1.516723 | 7.219658 |
| Developed | 0.921922 | 1.625604 | 2.517753 | 9.418678 | 2.255183 | 16.73914 |
| Bare | 0.062835 | 0.207085 | 0.502591 | 1.077401 | 0.854577 | 2.70449 |
| Total Output | 10.03016 | 22.55509 | 23.83866 | 31.91243 | 11.66367 | 100 |
| Input\Output (%) | Shallow Water | Agricultural | Vegetated | Developed | Bare | Total Input |
|---|---|---|---|---|---|---|
| Shallow Water | 6.087833 | 12.02253 | 8.590296 | 2.398836 | 2.382144 | 31.48164 |
| Agricultural | 2.538382 | 12.58757 | 13.18718 | 1.739684 | 4.854365 | 34.90718 |
| Vegetated | 0.600363 | 3.961423 | 6.452917 | 0.595055 | 3.338526 | 14.94828 |
| Developed | 0.7781 | 1.758779 | 2.091873 | 1.117736 | 1.372147 | 7.118634 |
| Bare | 0.459812 | 1.283448 | 4.325935 | 0.531811 | 4.943257 | 11.54426 |
| Total Output | 10.46449 | 31.61375 | 34.6482 | 6.383122 | 16.89044 | 100 |
Table 7 shows the proportions of developed land in 100 m and 1000 m buffers respectively. In the suburban area, developed land is negligible both in 100 m and 1000 m buffers. However, it is obviously increased both in 100 m and 1000 m buffers in the urban area. It is worth noting that although 33.3% of developed land in 100 m buffer is smaller than 42.1% in 1000 m buffer, about 14% of the increment of developed land in 100 m buffer is larger than 8.8% in 1000 m buffer. Therefore, Table 7 indicates that the growth of developed land in 100 m buffer is faster than in 1000 m buffer. In other words, urban expansion is growing towards surface water bodies so that it tends to compress the space of surface water bodies with urbanization.
| Buffer Distance = 100m | Buffer Distance = 1000m | |||||
|---|---|---|---|---|---|---|
| 1991 | 2005 | Increment | 1991 | 2005 | Increment | |
| Urban | 15.93% | 29.91% | 13.98% | 33.31% | 42.12% | 8.81% |
| Suburban | 6.94% | 6.38% | -0.56% | 4.1% | 3.19% | -0.91% |
CONCLUSION
In this paper, surface water bodies and land use classifications were extracted from Landsat TM/ETM+ images of Wuhan in 1991 and 2005 respectively. An overlap analysis based on GIS proved that surface water bodies in Wuhan had been reduced during this period as urbanization. By measuring the transformations of reduced water area and riparian land use changes, the main effects of urbanization on surface water bodies could be summarized as follows: (1) surface water bodies is likely to be covered by developed land with urbanization; (2) the space of surface water bodies is compressed by urban expansion.
Therefore, in order to protect surface water resources, it is necessary to enhance the supervision of surface water bodies and isolate them from urban development by wetlands or greenbelts. Since the 2000s, the Wuhan government made some regulations for water resources conservation to preserve the ecosystem of rivers, lakes and wetlands, including their surrounding land utilizations. The practices of Wuhan could provide a reference for urban surface water resources conservation.
CONFLICT OF INTEREST
The authors confirm that this article content has no conflict of interest.
ACKNOWLEDGEMENTS
This study was supported by the Natural Science Foundation of Hubei Province, China (2015CFA134) and the National Natural Science Foundation of China (41072199).


