All published articles of this journal are available on ScienceDirect.

Performance Evaluation of Bus Routing Scheme During Subway Construction Using Fuzzy Aggregation
Authors Info & Affiliations
Abstract
To evaluate the layout adjustment scheme of bus line during subway construction, the method combining quantitative survey and fuzzy aggregation is used. One criterion is transit service level, which considered nonlinear coefficient, line length, transfer distance and average waiting time. Another criterion is traffic impact degree incorporating three factors: saturation degree on work-zone section, saturation degree at intersection, passenger volume. The fuzzy aggregation is based on these two criteria. The evaluation method is applied in Ningbo of China. Via quantitative survey, it is found that most of the factors with respect to these two criteria are degraded, when the bus routing scheme comes out during the construction of subway # 1. For instance, new layout such as bus line relocation and bus stop displacement increases traffic volume on some of the south-north links. Most of these links intersect with work-zone links on Zhongshan Road. However, when comparing the evaluated performance of bus line adjustment condition to the one of previous condition under subway construction stage, the gap is well within the acceptable limit. Therefore, the increased traffic may affect the traffic passing on some south-north roads, but will not hinder citizen's daily travel. These analysis and evaluation of bus routing scheme provide reference for the subway construction in other cities with respect to road traffic management.
1. INTRODUCTION
Subway travel is featured by large passenger volume, high speed, low pollution, excellent safety level and strong comfort, thus it is a perfect choice as public transport for big cities. Subway proposal was approved by the Ningbo Council in 2008 and started construction in 2009. Subway # 1 goes across the Ningbo core area along Zhongshan Road. Because of the subway construction, the traffic along Zhongshan Road and adjacent roads is mostly impacted. Survey shows that the average traffic saturation along Zhongshan Road in the rush hour is 0.9, which belongs to the congestion state. Moreover, it is shown that some bus passengers had a bad experience during their travel. Buses have the highest utilization rate of road resource among various travel modes in the city. Adjusting bus operation should be an important way to reduce the negative impacts during subway construction.
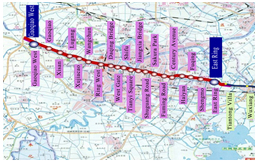
As shown in Fig. (1), influenced area of subway construction is mainly distributed along (1) east-west line named Daqing Bridge <-> West Gate <-> Tianyi Square <-> Jiangxia Bridge <-> Sakura Park, (2) north-south line named Cuibai Road, Jiefang Road, Yonggang Road, etc. During subway construction, a total of 101 bus lines are affected. Among them, 49 bus lines, 680 operating vehicles, 10 bus stops with each serving 10 bus lines along Zhongshan Road were mostly influenced. Among a total of 49 bus lines passing through Zhongshan Road, 2 lines were canceled and 19 lines were relocated. In addition, the type of bus is changed into 2 bus lines; their double-decker buses were changed to the single-decker buses. During the construction of Subway # 1, the stops located along or near the construction line should be relocated in principle. Finally, the bus stop number required to be shifted within the construction area is totally 10, e.g., Tianyi Jiayuan, Daqing Bridge, etc. In short, Ningbo has already adjusted the bus operation, but its effectiveness is unknown. We summarize the effectiveness factors firstly, and then use fuzzy aggregation to do the evaluation.
2. LITERATURE REVIEW
As to the evaluation factor selection for bus operation, a number of previous studies have studied this from varied service perspectives [1-5]. For instance, Alter (1976) [3] evaluates transit LOS (level of service) by a composite of basic accessibility, travel time, reliability, directness of service, frequency of service and passenger density. Recently, Sheth (2003) [6] evaluated the efficiency of bus routes taking into consideration the service providers, the users and the societal perspectives. Litman et al. (2008) [7] investigate the value transit travelers place on qualitative factors, such as comfort and convenience, and practical ways to incorporate these factors into transport planning and project evaluation. De Oña et al. (2012) [8] evaluate all the attributes of transit service quality, and find that some attributes (e.g. proximity, speed and safety) become more important than frequency. However, these methods do not effectively take the fuzziness of factor value into account. It means each factor is assigned a certain value (generally an average value). In fact, the value perceived by each passenger or driver is different; and we could only acquire the data range and data appearance frequency. Therefore, the factor fuzziness should be considered. As to the evaluation method of bus operation in uncertain conditions, fuzzy multicriteria analysis approach [9], multiagent approach [10], DEA (Data envelopment analysis) approach [11], evaluation approach by Heterogeneous Customer Satisfaction Index [12] are used.
In addition, most of previous researches evaluate the effectiveness of regular bus operation. However, the impact of special events to bus operation is seldom considered, such as subway construction. In these conditions, we should consider passenger and car driver perceptions as a whole for evaluation. It means we should consider the impact to other road users, such as Hayat (2002)’s [13] evaluation of consumer satisfaction of transport networks. It includes traffic delay, commercial speed, cleanness, system safety, accessibility and comfort. In the following, we use the fuzzy aggregation method to evaluate the bus routing scheme from both passenger and car driver perspectives. The fuzzy aggregation is superior to other fuzzy models in the aspect of its wide applicability. Then, we do the comparison analysis for the evaluation results.
3. EVALUATION METHOD BY FUZZY AGGREGATION
The values of evaluation factors and weights are uncertain; therefore we use fuzzy aggregation method to evaluate the level of the whole bus operation. For the implementation of fuzzy aggregation, various techniques have been adopted including a fuzzy weighted average, fuzzy multi-attribute analysis, fuzzy eigenvector method, fuzzy entropy method, etc. The fuzzy weighted average is an improvement over classical weighting methods. It is widely used in the fields of group decision, multi-objective decision, and quality control. It would also be used in this study. If the membership functions with regard to each factor and weight are given, the bus operation performance can be acquired by using the following fuzzy operation.
 |
(1) |
where, i represents the factor whose total number is m (m=7 in this paper).
 is a fuzzy number representing the value of factor i.
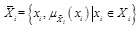
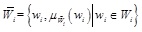 is the normalized fuzzy weight of factor i, which determines its importance among all the factors. Xi and Wi are fuzzy sets of factor and weight respectively.
 and
and
 are the membership functions of factor and weight respectively, which are represented as triangular functions (shown as Fig. (2) in this study.
 and
and
 are fuzzy operations using α-cut interval analysis.
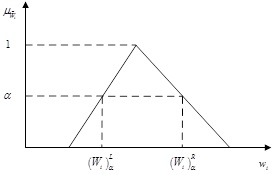
The illustration of α-cut is shown in Fig. (2). The first step of fuzzy operation would help to understand the α-cut. The fuzzy operation in the computation of fuzzy weighted average is an extended algebraic interval operation. This operation can achieve the membership function
 with respect to fuzzy variable
 , which is described in the following five steps [14].
(1) Discretize the complete range of the membership [0, 1] of the fuzzy numbers into the following finite number of n α-cuts, α1, …, αn, where an instance is shown in Fig. (2).
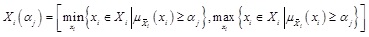
(2) For each αj, using the following equations to find the corresponding interval for Wi in
 and Xi in
 . Denote the end-points of the intervals of
and
by
. Denote the end-points of the intervals of
and
by
 and
and
 , respectively.
 |
(2a) |
 |
(2b) |
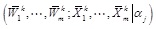
(3) Construct the 22m distinct permutations of the 2m array
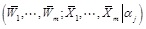 that involve just the interval end-points of the fuzzy number intervals.
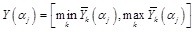
(4) Compute
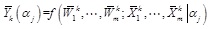 , where
 is the kth permutation of the 22m distinct permutations. Then the desired interval for
 is:
is:
 |
(3) |
(5) Repeat step (2-4) for every αj, compute
using every Y(αj) and an α-cut decomposition theorem, i.e., let
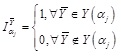 |
(4a) |
so that,
 |
(4b) |
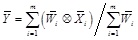
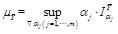
Since the output variables are expressed by fuzzy numbers, they should be defuzzified into a crisp number to be used as a certain level. Out of several defuzzification methods, we choose the center of gravity method due to its simplicity and ease of computation. The estimated performance is represented in Formula (5). Via comparing the bus operation performances before and after line adjustment, we can evaluate the effectiveness of bus routing scheme during road working.
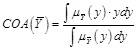 |
(5) |
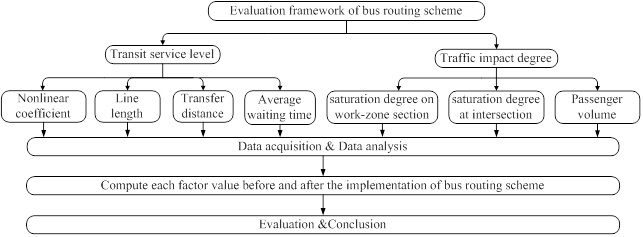
4. EVALUATION SYSTEM OF BUS ROUTING SCHEME
Evaluation of bus operation is mainly standing on the angle of transit service level and traffic impact degree. These two representative criteria can reflect the passenger satisfaction of transit operation and the driver satisfaction of traffic operation. The evaluation system is shown in Fig. (3), where seven factors were selected. These factors are chosen by two reasons: (1) These factors are quantitative, and can easily be detected. (2) The Ningbo government has investigated and found that these factors are considered the most important.
4.1. Transit Service Level
4.1.1. Nonlinear Coefficient (h1)
The nonlinear coefficient of bus line is the actual line length between first and last bus stop divided by straight-line distance. It is influenced by the indexes such as the shape of the urban road network, layout of urban land use. So we should better set the shortest line or a line closer to the shortest path as a bus line. The Code for Transport Planning on Urban Road (GB50220-95) (hereinafter referred to as the “Standards”) specified that the nonlinear coefficient [15] should satisfy h1≤[l/d]=1.4 (d means the shortest path length). As Table 1 shows, the nonlinear coefficient increased after line adjustment, but most of the area's average nonlinear coefficient values are within the maximum nonlinear coefficient of 1.4.
| Section Name | # of changed lines | Previous | Implemented | Change rate (%) |
|---|---|---|---|---|
| West Ring Road—West Gate | 7 | 1.12 | 1.51 | 34.82 |
| Shifu Road—Tianyi Square | 12 | 1.09 | 1.24 | 13.76 |
| Jiangxia Bridge-Sakura Park | 12 | 1.25 | 1.37 | 9.60 |
| Fuming Road-Century Avenue | 9 | 1.19 | 1.28 | 7.56 |
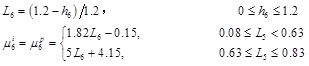
For convenient evaluation, normalize the factor into a level index which is in the range [0, 1]. The function of level index and the factor can be shown in Formula (6). The membership functions of previous and implemented conditions are represented by μ1p and μ1i separately. The average of all the level indexes is used as a median value corresponding to maximum membership degree. The occurrence probabilities of minimum and maximum level indexes are used as the corresponding membership degrees. The triangular membership function is then constructed.
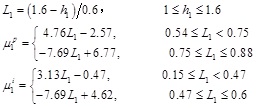 |
(6) |
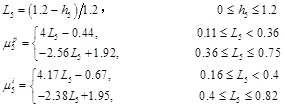
4.1.2. Line Length (h2)
During the period of construction, many bus lines in the influenced area are rerouted and thus their line lengths are extended. Fortunately, average bus line length in the area is within the maximum value 13 km, which is required by “Standards” (Table 2).
| Section Name | # of changed lines | Previous | Implemented | Change rate (%) |
|---|---|---|---|---|
| West Ring Road—West Gate | 7 | 10.35 | 12.12 | 17.10 |
| Shifu Road—Tianyi Square | 12 | 12.89 | 14.88 | 15.44 |
| Jiangxia Bridge—Sakura Park | 12 | 9.11 | 10.01 | 9.88 |
| Fuming Road—Century Avenue | 9 | 9.89 | 11.28 | 14.05 |
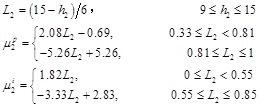 |
(7) |
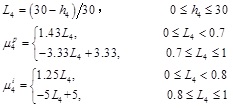
4.1.3. Transfer Distance (h3)
Transfer distance is an important factor reflecting reasonability of bus line distribution and stop setting, which directly related to the convenience of bus riding. “Standard” specifies that: transfer distance for the same direction should be less than 50 m, and for opposite direction should be less than 100 m; even in the case of intersection and grade separation, transfer distance should not be longer than 150 m, and must be less than 200 m. According to the previous scheme, transfer distance in the current scheme has increased. Fortunately, most of the transfer distances are within the range which is allowed in “Standard” [16, 17] (Table 3).
| Stop Name | Previous | Implemented | Change rate (%) |
|---|---|---|---|
| West Ring | 61.4 | 83.9 | 36.64 |
| Da Qingqiao | 68.9 | 83.3 | 20.90 |
| West Gate | 72.4 | 85.7 | 18.37 |
| Shifu | 70.9 | 113.3 | 59.80 |
| Jiangxia Bridge | 65.8 | 73.3 | 11.40 |
| Zhangbin Bridge | 59.1 | 71.2 | 20.47 |
| Sakura Park | 58.8 | 111.5 | 89.63 |
| Jiangdong School | 66.9 | 80.4 | 20.18 |
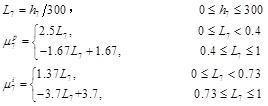
4.1.4. Average Waiting Time (h4)
The average waiting time is important for evaluating transit service level. It is generally believed that passengers can accept 5 ~ 10 minutes to wait a bus. If the waiting time is more than 10 minutes, passengers will be suffering from anxiety; if the waiting time is more than 15 minutes, some passengers would consider using other travel mode. The survey covers 64 bus lines around Subway #1. The statistical distribution is shown in Fig. (4).
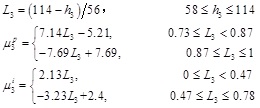 |
(8) |
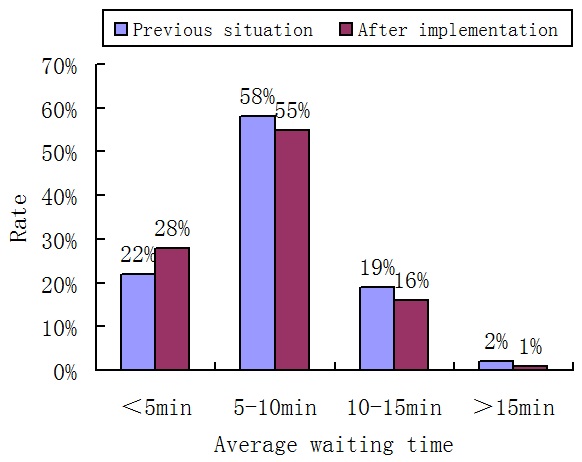
From the figure above, we could find that most of the average waiting time is in 10 minutes around the influenced area after the implementation of the bus routing scheme. 28% of the passengers' average waiting time is less than 5 minutes, 56% of the average waiting time is 5 ~ 10 minutes.
Level index and membership function are shown in the following.
 |
(9) |
In conclusion, the implementation of bus routing scheme has increased some factors of transit service level. Fortunately, the increasing degree is within the range of “Standard” specification. Therefore, the bus routing scheme can roughly satisfy the need of residents' bus travel.
4.2. Traffic Impact Degree
4.2.1. Saturation Degree on Work-zone Section (h5)
For the construction period of Subway # 1, Zhongshan Road is the main affected zone. However, traffic of Zhongshan Road has improved via the proposed bus routing scheme. It was partly because the implementation of bus priority measures affected the travel mode of residents. Some residents reduce the use frequency of private car use; and alternately, they take the bus to work. The other reason of the improvement in saturation lies in that most buses take the use of south-north road around Zhongshan Road to detour.
By the survey statistics (Table 4), the average flow along the subway line in the rush hour is 2670 pcu/h before the implementation of the bus routing scheme. Moreover, the traffic saturation is 0.71 on average, with 40% of them higher than 0.9 and 80% of them higher than 0.7. After the scheme implementation, the average flow along the subway line in the rush hour is 2609 pcu/h. The average traffic saturation is 0.65, with 20% of them higher than 0.9 and 50% of them higher than 0.7.
| Surveyed road | Rush-hour flow (pcu/h) | Capacity (pcu/h) | Saturation degree (V/C) | ||
|---|---|---|---|---|---|
| Previous situation | After implementation | Previous situation | After implementation | ||
| Liyuan Road~West Ring Road | 2493 | 2316 | 3409 | 0.73 | 0.68 |
| Cuibai Road~Mayuan Road | 2464 | 2307 | 3563 | 0.69 | 0.65 |
| Wangjing Road~Xiaowen Street | 3442 | 3248 | 3563 | 0.97 | 0.91 |
| Xiaowen Street~Zhenming Road | 3737 | 3606 | 3563 | 1.05 | 1.01 |
| Jiefang Road~Kaiming Street | 2884 | 2767 | 3175 | 0.91 | 0.87 |
| Kaiming Street~Qizha Street | 2912 | 2837 | 3175 | 0.92 | 0.89 |
| Jiangdong Road~Shuguang Road | 2356 | 2249 | 3303 | 0.71 | 0.68 |
| North Caihong Road~North Yonggang Road | 2673 | 2503 | 3466 | 0.77 | 0.72 |
| North Yonggang Road~Zhongxing Road | 2434 | 2301 | 3413 | 0.71 | 0.67 |
| Fuming Road~Canghai Road | 1574 | 1308 | 5472 | 0.29 | 0.24 |
| Average value | 2670 | 2514 | 3996 | 0.71 | 0.64 |
The three groups of these data show that the previous and current traffic states in Zhongshan Road are relatively stable; because the change of bus line and stops has increased the transit use on the one hand, and decreased the traffic saturation degree correspondingly on the other hand.
 |
(10) |
4.2.2. Saturation Degree at Intersection (h6)
Bus line updating has directly influenced traffic flow of south-north roads which crosses Zhongshan Road. Before the implementation of the bus routing scheme, the average flow and saturation degree along these south-north roads in the rush hour are 1698 pcu/h and 0.44 respectively. Moreover, 3% of traffic saturation is higher than 0.9 and 18% higher than 0.7. After the implementation of the bus routing scheme, the average flow and saturation degree along these south-north roads in the rush hour are 1735 pcu/h and 0.45 respectively. Meanwhile, 6% of traffic saturation is higher than 0.9 and 18% higher than 0.7.
The urban center owns a number of south-north links. The data show that the state of traffic flow in these links is relatively stable. Although measures such as bus line updating and bus stop shift could make the bus traffic and car traffic increase, the rise margin is low and won't have too much effect on people's daily travel. Meanwhile, the private cars are effectively restrained because of the transit service level increasing.
Level index and membership function are shown in the following.
 |
(11) |
4.2.3. Passenger Volume (h7)
Currently, Public Transport occupies more than 20% of the residents' travel in Ningbo [18]. It is one of the main urban travel modes. The new bus routing scheme would inevitably cause serious impact on travel mode choice of neighboring residents along Zhongshan Road. We investigated the passenger volume at stops before and after the scheme implementation respectively.
The survey shows that the line adjustment and bus stop shift reduced passenger volume and the traffic burden of Zhongshan Road. Meanwhile, it increased the passenger volume along the north-south links crossing Zhongshan Road. The increased passenger volumes are caused by the increased by-pass buses. So traffic pressure along Zhongshan Road is reduced. Although the increased passenger may produce certain effect to north-south traffic, it would not cause too serious effect to the residents' daily travel.
Level index and membership function are shown in the following.
 |
(12) |
5. EVALUATION RESULTS
In the evaluation, the weight is used to reflect the importance of the corresponding factor. The weight should be a fuzzy number, but we make it as a certain value for simplicity. We specify the 7 weights as [0.10,0.10, 0.10,0.15,0.15,0.10,0.30].
Before implementation, the evaluation result is 0.58. After implementation, the evaluation result is 0.55. Their gap is within 10%, which cannot influence the traffic state too much. Therefore, we judge the feasibility of the implementation of the bus routing scheme. In addition, if we let the weights of evaluation factors value within 20% of their original values, the performance gaps are all within 10% of their original values. It means the weight factor has little influence on the performance value. When we do a detailed analysis, we find the factors related to transit service have low values in the implemented scheme. It is the main reason why the evaluation result is lower than that of the previous condition. In the transit service criterion, average waiting time in the implemented condition is improved. The reason is that some buses take the use of south-north road around the subway constructed road to detour; and the travel reliability is improved. However, some waiting times for a few bus lines in the influenced area are long. It is easy to understand. When the bus number is not increased, lengthening the bus line inevitably leads to the extension of the average waiting time for passengers. Nonetheless, the results for the traffic impact criterion in the implemented scheme are better than those of the previous condition. It means the road saturation is improved and passenger volume is increased in the implemented scheme.
If each factor in our study is assigned its average value, the evaluation results are 0.59 and 0.61 before and after implementation respectively. They are different from the results of fuzzy aggregation. Compared with the performance evaluation with every index under the condition of certainty, our result is analyzed by considering each value of uncertain range. Thus, our method is more comprehensive and could be applied to the city where decisions should be made under the environment of uncertainty.
CONCLUSION
A series of measures such as rerouting bus lines and shifting bus stops are used to alleviate traffic congestion during subway construction. We extend quantitative survey to analyze the factor values before and after the implementation of the bus routing scheme from both passenger and car driver perspectives. We use fuzzy aggregation to evaluate the performances of these two situations. It is found that the feasibility of the implementation of the bus routing scheme can be guaranteed.
In order to improve the attractiveness of bus services and maximize the use of the existing resources during subway construction, some bus priority measures must be implemented, which can be as follows: (1) Set up bus-only lanes. Considering the road resources are limited during subway construction, we can let the use of this lane to be permitted for private cars in off-peak hours. This measure could avoid spending too much money and can maximize the use of the existing road. (2) Implement bus signal priority. We can adjust the signal cycle and set up bus-actuated signal to improve the bus operation efficiency during subway construction [19, 20]. In the future work, we would compare the traffic system performance before and after the implementation of these bus priority measures during subway construction.
CONFLICT OF INTEREST
The authors confirm that this article content has no conflict of interest.
ACKNOWLEDGEMENTS
This research is supported by the National Natural Science Foundation of China (Nos. 51408321, 51408190), and Zhejiang Social Science Planning Program (No. 16NDJC015Z), and Zhejiang Provincial Natural Science Foundation (No. Y15E080035), and Ningbo Natural Science Foundation (No. 2015A610162).

