All published articles of this journal are available on ScienceDirect.

Historic City Centers After Destructive Seismic Events, The Case of Finale Emilia During the 2012 Emilia-Romagna Earthquake: Advanced Numerical Modelling on Four Case Studies
Abstract
Introduction:
The recent wave of seismic shocks in Central Italy (2016) had once more disastrous consequences for the local monuments, which consisted of old masonry churches and towers. The permanent, seismic-induced damage to cultural heritage has become a serious issue that can no longer be downsized, and questions have been raised about how to satisfactorily assess the vulnerability of such heritage in advance. This paper deals with the investigations into the actual condition of a historic city center partially destroyed by the seismic sequence occurred in May 2012 in Emilia-Romagna. Namely, the case of Finale Emilia – a small to medium-sized village located at the very center of the stricken area – is considered.
Methods:
Three important heritage masterpieces were numerically analyzed using Finite Element meshes to deepen the knowledge of their seismic vulnerability and try to avoid similar disasters in the future. The first structure is a masonry castle known as “Castello delle Rocche”, which underwent severe damages during the seismic sequence. The second and third examples deal with the structural analysis of two towers, both collapsed due to the quakes: the Fortified Tower of the castle and the Clock Tower of the village. The last analysis is devoted to study the seismic behavior of a medium-sized masonry church (Santa Maria del Rosario), heavily damaged by the seismic sequence and whose bell tower collapsed due to the formation of a hinge at mid-height.
Results and Conclusion:
Numerical models were created for all the buildings involved, and a variety of advanced analyses were carried out, including nonlinear static and dynamic ones, to have a deep insight into their expected vulnerability, also finding reasonable correspondence between the numerical results and the actual state of damage observed during the surveys made in the aftermath of the seismic events.
1. INTRODUCTION
Many Italian regions have always been subject to earthquakes, whose intensity ranged from moderate to strong. In fact, a small tectonic plate known as Adriatic Plate covers Southern Sicily, the Ionian and Adriatic Seas, and most of the Po Valley. Some geological models consider this plate as being independent from the African one, a theory supported by geodetic results [1], and it is shifting towards the North-North East direction with a slight counter-clockwise rotation. Therefore, it is colliding with the Eurasian plate all along its geological faults, which extend through the Apennines up to the Western part of the Po Valley. All the earthquakes occurred throughout the centuries originated because of this motion, including the most recent ones in Emilia-Romagna (2012) and Central Italy (2016-2017). These resulted in heavy losses of human lives, collapses and widespread damages to many structures. Historical masonry buildings were especially affected by severe consequences, inflicting a serious blow to the Italian cultural heritage.
In the second half of the 2000s the Italian Ministry of Cultural Heritage and Activities and Tourism (MiBACT) cooperated with the Civil Protection Department in devising specific guidelines for assessing and mitigating the seismic risk of the cultural heritage. Such guidelines where first issued in 2006, but a thorough revision was needed after the publication of the New Italian Building Code in 2008, and the updated version was issued in 2011. These guidelines stand out for being state-of-the-art and well-conceived, providing simplified yet complete assessment tools for masonry palaces, towers, churches, and bridges [2]. However, they maybe lack in giving exhausting indication on masonry castles, which are an integral part of the Italian cultural heritage.
Nevertheless, academics and researchers have extensively dealt with the vulnerability assessment of historical masonry churches and towers, carrying out advanced numerical investigations such as nonlinear static and dynamic analyses on case studies [3-9]. Conversely, only some general insights have been given about masonry castles due to the difficulties in finding a unified approach for the assessment of such a complex, one-of-a-kind type of structure [10, 11].
Exactly five years have passed since the 2012 Emilia-Romagna seismic sequence. In order to provide quantitative informations on the condition of heritage buildings located in historic city centers, this paper focuses on the city center of Finale Emilia, a village which is small to medium-sized yet is rich of historical buildings and heritage masterpieces. The condition of the most important monuments of the city will be reviewed and their behavior during the seismic sequence investigated by means of complex numerical Finite Element approaches, including nonlinear static and dynamic analyses.
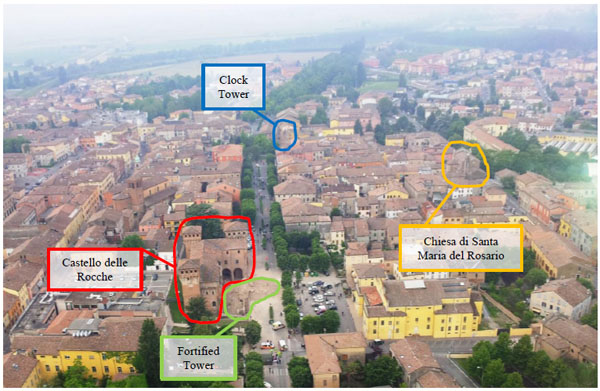
The first monument here considered is the city castle, called “Castello delle Rocche” – hereafter referred to as only “the Castle”. The second and third structures are two important medieval masonry towers: the Fortified Tower of the Castle (whose Italian name is “Mastio”) and the Clock Tower of the village, also known as “Torre dei Modenesi”. The Castle was already scrutinized, dealing exclusively with structural analyses, in a paper published by the authors in [12], which presented for the first time a complete analytical investigation on a masonry castle; the two towers were originally investigated in [13]. The last example – whose results are presented here for the first time – deals with one of the masonry churches of Finale Emilia (“Chiesa di Santa Maria del Rosario”), a medium-sized building severely damaged by the seismic events along with its bell tower. The location of all the case studied investigated in this paper is shown in Fig. (1).
2. BRIEF HISTORICAL NOTES
Finale Emilia was officially founded in 1213 near the course of the Panaro River, which is a tributary of the more prominent Po River, about halfway between the cities of Modena and Ferrara. The establishment of the village was aimed at overseeing the goods transported through the Panaro, and two controlling towers were built at its extremities as twofold checkpoints along the West-East direction. At the end of the 13th century Finale was overtaken by the House of Este, which at that time ruled Ferrara and had just extended its dominion to Modena. The position of the village became strategic not only for controlling the passage of goods but also because it could serve as a bulwark against enemy attacks. Hence, fortified buildings were erected around the Eastern tower during the 14th century, but they were soon demolished at the very beginning of the 15th century to be substituted with a proper castle – later labelled “Castello delle Rocche” and depicted in Fig. (2). The two old controlling towers changed their function: the one located at the Western end of the village was turned into a Clock Tower, while the Eastern one became the Fortified Tower of the Castle.
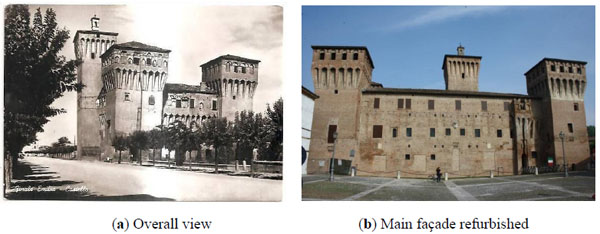
The Castle had been plagued by structural problems on the roofing system since shortly after its construction. Moreover, the proximity of the river had caused constant decay to the structure, which worsened starting from mid-18th century after some spaces were used for storing salt. In 1947 the Castle was so deteriorated that it had to be abandoned; hence, extensive renovation works were carried out throughout the 1960s, which greatly improved its overall conditions and static behavior. Further interventions were executed in the 1990s, and in 2009 the main façade was completely refurbished and strengthened. The final outcome of the latter intervention is shown in Fig. (2).
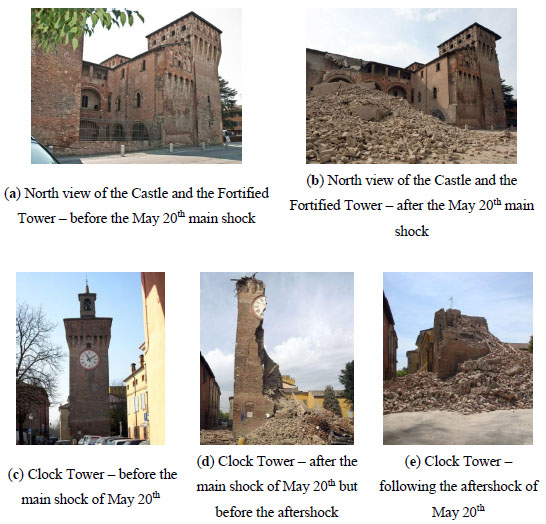
Finale Emilia was at the very heart of the area struck by the 2012 seismic sequence. On May 20th at 4.03 am (local time), an earthquake hit the village with a magnitude of 5.9, causing the complete destruction of the Fortified Tower, the partial collapse of the Clock Tower and widespread damages on the upper parts of the Castle (namely, the crown of its three towers). Following some minor aftershocks – mostly occurred during the night – a major one struck at 3.18 pm (local time) with a magnitude of 5.1, which obliterated the remaining part of the Clock Tower and generated further damages to the Castle. Fig. (3) shows meaningful images of the damages displayed by the Castle and of the collapse of the towers.
3. NUMERICAL INVESTIGATION OF THE CASTLE
3.1. General Information, FE Meshes
Two distinct finite element meshes were used for the computational analyses of the castle, which were carried out in the 3D FE software Abaqus. Both were created on a simplified 3D geometric model of the building conceived with Rhinoceros, where it was possible to define in advance the parts of the castle employing different material properties (wooden floor, infill, etc.). The two FE meshes are pictured in Fig. (4). A more complete description is provided in [12], where the reader is referred to for further details.
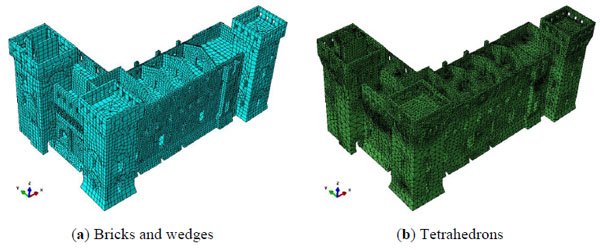
The first mesh consisted mainly of brick elements, with a few wedge elements near the openings. The geometric parts were independently and directly imported from Rhinoceros in Abaqus, where the corresponding mechanical properties were assigned to each part. The different structural elements were then meshed and subsequently assembled, imposing tie constraints at the contact interface to secure continuity of displacements. This mesh was used when performing nonlinear static analyses.
The second mesh was more refined and consisted only of tetrahedrons. However, in this case the geometric model was first imported into Strand7, where it was meshed and used for carrying out modal analyses. Then, the meshed model was written into a Nastran code and imported in Abaqus, where again each part received its own mechanical properties. This second mesh was used when performing nonlinear dynamic analyses.
3.2. Material Properties
The results of the numerical analyses here presented aim at investigating the seismic vulnerability of the Castle, mirroring its actual condition at the time of the earthquake also in terms of material properties.
The mechanical elastic properties employed for the materials are listed in Table 1. Since the façade of the castle was extensively refurbished and restored during the 2009 interventions, two different sets of mechanical properties were used for masonry: one with higher values of strength and Young’s modulus – representing the façade, and one with lower values – representing the remaining parts of the castle.
| Material | Density [kg/m3] | Young’s Modulus [MPa] |
|---|---|---|
| Restored masonry | 1800 | 1500 |
| Non-restored masonry | 1800 | 900 |
| Vaults infill | 1600 | 600 |
| Concrete-and-bricks | 2000 | 25000 |
| Wood | 1000 | 10000 |
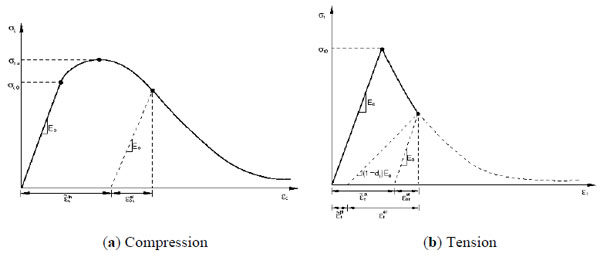
A material model named “concrete damaged plasticity” (CDP) was employed for characterizing the mechanical behavior of masonry. As the name suggests, this model was originally developed for describing the behavior of concrete taking into account plasticity and damage, with the possibility to define distinct constitutive laws and damage parameters in tension and compression. However, the formulation of this model is general, so it can be employed for describing other materials, including masonry. The inelastic curves in tension and compression are shown in Fig. (5), while the values of the constitutive laws in tension and compression along with the damage parameter in tension are summarized in Table 2. Other parameters are needed for the complete definition of this material model, and they are listed in Table 3. Further considerations on the adopted mechanical model are given in [12], where the reader is again referred to.
| Compression | Tension | Damage in Tension | ||||
|---|---|---|---|---|---|---|
| εplastic [-] | σ [MPa] | εplastic [-] | σ [MPa] | εplastic [-] | dt [-] | |
| Restored masonry | 0 | 2.4 | 0 | 0.08 | 0 | 0 |
| 0.005 | 2.1 | 0.005 | 0.0005 | 0.005 | 0.95 | |
| 0.01 | 2.1 | 0.1 | 0.0005 | |||
| 0.1 | 1.8 | |||||
| Non-restored masonry | Compression | Tension | Damage in Tension | |||
| εplastic [-] | σ [MPa] | εplastic [-] | σ [MPa] | εplastic [-] | dt [-] | |
| 0 | 1.22 | 0 | 0.04 | 0 | 0 | |
| 0.005 | 0.95 | 0.003 | 0.0005 | 0.003 | 0.95 | |
| 0.01 | 0.95 | 0.1 | 0.0005 | |||
| 0.1 | 0.8 | |||||
| Symbol | Name | Description | Default Value |
|---|---|---|---|
| є | Eccentricity | Distance between the points of intersection with the p-axis of the cone and the hyperbola (in the p-q plane) | 0.1 |
| fb0/fc0 | Strength ratio | Ratio between the biaxial and uniaxial compression strength | 1.16 |
| ψ | Dilation angle | Angle due to a variation in volume of the material following the application of a shear force | 10° |
| Kc | - | Ratio between distance from the hydrostatic axis of the maximum compression and traction respectively | 0.666 |
| - | Viscosity parameter | Numerical parameter which allows to reach convergence in softening without affecting the accuracy of the results | * |
3.3. Nonlinear Static Analyses
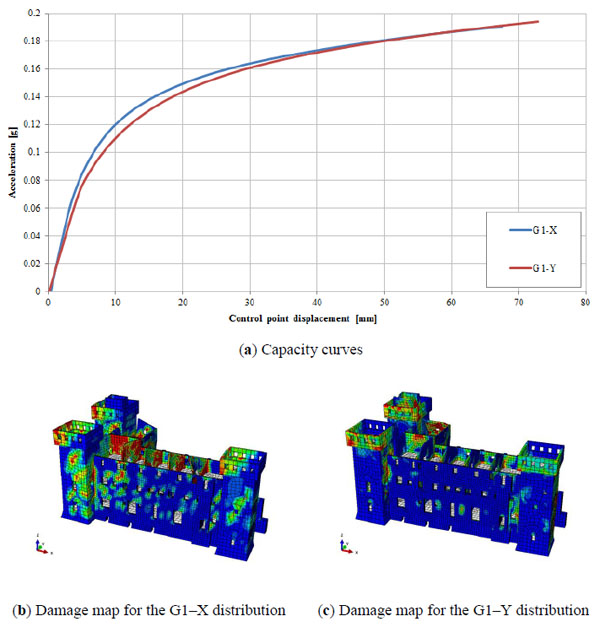
The nonlinear static analyses – also known as pushover analyses – were carried out according to requirements described in [14]. The control point for the computation of the capacity curves was chosen on the second story floor, which seemed a reasonable choice considering the geometry of the building. The adopted distribution of horizontal forces was proportional to the masses and varied linearly and increasingly along the height, consistently with the Group 1 distribution as defined in [14]. A series of preliminary analyses reported in [15] showed that the most affecting distributions were the ones acting along the negative direction of axis X and axis Y (labelled G1–X and G1–Y, respectively).
The capacity curves and the damage maps for the aforementioned distributions are presented in Fig. (6). In the former, the vertical axis displays the resultant of the static seismic load applied to the model divided by the total mass of the structure. This is a non-dimensional horizontal acceleration expressed as a fraction of the gravitational acceleration g. Such a representation allows the determination of the collapse acceleration for the structure in a very straightforward manner, taking into account all the numerical and theoretical assumptions done. Moreover, the value of collapse acceleration can be directly compared with the spectral acceleration provided by [14].
As the figure shows, the capacity curves are quite similar in the two directions and, since the restoration intervention occurred only on the wall of the façade – aligned along axis X, thus works well under shear for the G1–X distribution – the results seem surprising, highlighting once again that the behavior of a castle is probably global and the improved mechanical properties of a single wall, albeit with important dimensions, does not affect in an appreciable manner the global behavior of a large structure. The G1–X distribution originated widespread damages also in the restored façade, more severe than those coming from the other distribution, which may look counterintuitive but could be explained due to the interaction between the towers and the façade.
3.4. Limit Analyses
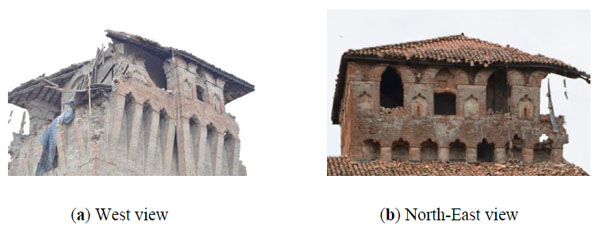
As mentioned in a previous section of this paper, the earthquake caused widespread damages on the crown of the three towers of the castle, especially the one facing the West direction – see pictures in Fig. (7).
A safety assessment of the castle was first performed by following the N2 method, which is described in [16, 17], to check if these damages could have been forecast. The results were unsatisfying, as also shown in [12], since this method can only give a global safety assessment, failing at predicting local effects – which are typical of castles when collapse does not occur.
For this reason, limit analyses is carried out on the crown of the towers, considering three possible failure mechanisms: simple, composite and corner out-of-plane overturning. Table 4 presents the comparison between the rocking failure collapse acceleration (related to a specific mechanism) and the peak and mean accelerations of the May 20th main shock. The results clearly show that all three mechanisms were activated on the West tower, as occurred in reality in different portions of the crown, whereas no mechanism activated for the other two towers, which were indeed less damaged.
| Failure Mechanism | Collapse Acceleration [g] | Spectrum Peak Acceleration [g] | Check | Earthquake Mean Acceleration [g] | Check |
|---|---|---|---|---|---|
| Simple out-of-plane overturning (East and South Towers) |
0.244 | 0.231 | YES | 0.200 | YES |
| Simple out-of-plane overturning (West Tower) |
0.073 | NO | NO | ||
| Composite out-of-plane overturning (East and South Towers) |
0.250 | YES | YES | ||
| Composite out-of-plane overturning (West Tower) |
0.094 | NO | NO | ||
| Corner out-of-plane overturning (East and South Towers) |
0.334 | YES | YES | ||
| Corner out-of-plane overturning (West Tower) |
0.172 | NO | NO |
3.5. Nonlinear Dynamic Analyses
The real ground accelerations of the May 20th main shock – recorded by the nearby station of Mirandola – were employed for the present case study. The North-South and West-East components were duly rotated to match the local reference system used for the Castle. Four meaningful time instants were taken into consideration for extracting the damage maps: one corresponding to the absolute peak acceleration along direction X, one to the absolute peak along Y, one to half-time of the recorded ground motion, and the last corresponding to the practical end of the accelerogram. Two reference points were investigated in terms of horizontal displacement history, the first located on the top edge of the façade and the second on the crown of the West tower.
The time-displacement diagrams of two control points and the evolution of the damage map over time are provided in Fig. (8). The displacement history for the control point on the façade (axis on the left in Fig. (8a) displays small oscillations and a low value of residual displacement (equal to 5 mm), meaning that the restoration had beneficial effects. Conversely, for the point on the West tower (axis on the right), the displacement grows exponentially, with a value of residual displacement greater than 1 m, which is certainly consistent with the actual activation of collapse mechanisms on the crown.
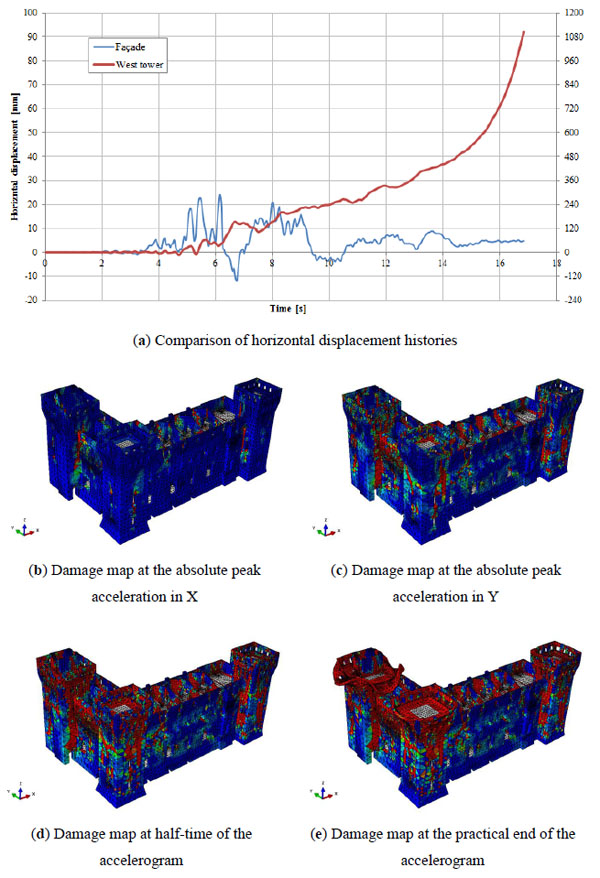
The evolution of the damage map over time suggests the development of widespread damages (red zones in the map) on the upper part of the Castle and especially of its three towers. In particular, the damage map depicted in Fig. (8e) clearly indicates the activation of collapse mechanisms on the crown of the West tower, mirroring again the real outcome.
4. NUMERICAL INVESTIGATION OF THE TOWERS
4.1. FE Meshes and Material Properties
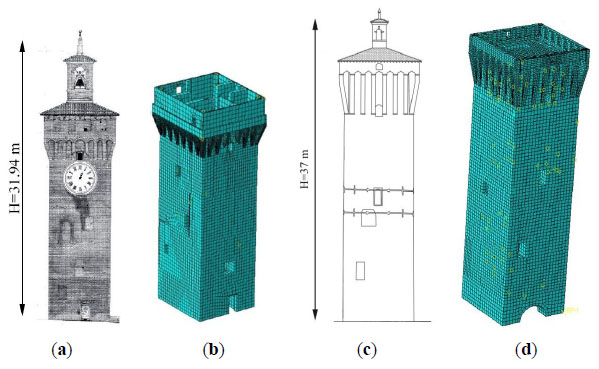
For the two towers, investigated also in [13] and here critically re-analyzed, all the computational analyses were carried out in Abaqus. The finite element meshes were created after importing the geometrical models of each tower from Rhinoceros, and both consisted of only brick elements. They are shown in Fig. (9).
Two distinct material models were employed for characterizing masonry. The first was the aforementioned concrete damaged plasticity, the second was an isotropic elastic-perfectly plastic model combined with a Mohr-Coulomb failure criterion (MC), which required only the definition of two inelastic parameters – cohesion and friction angle – and proved itself to be effective for incremental pushover analyses (indeed, softening is rarely visible in such kind of structures).
The two towers were coeval and built within 400 meters one each other – as shown in Fig. (1) – hence they were supposed to share the same material, with low values of the mechanical properties typical for historical masonry in that region (Table 5). The value of cohesion here adopted is consistent with the value suggested by [18] if thin mortar joints and good transversal connection along the wall thickness are assumed for the masonry.
| Density [kg/m3] | Young’s Modulus [MPa] | Compressive Strength [MPa] | Tensile Strength [MPa] | Cohesion [MPa] | Friction Angle [°] |
|---|---|---|---|---|---|
| 1580 | 1500 | 2.4 | 0.2 | 0.15 | 30 |
4.2. Equivalent Static Analyses under Horizontal Actions
For towers in general, a simple assessment of seismic vulnerability is allowed by [2] using a cantilever beam approach and an equivalent static analysis (ESA). This is a rather simple method that can be used by any practitioner for the safety assessment of masonry towers. In particular, the resisting and external bending moments should be evaluated at specific sections along the height with some simplified formulas provided in [2], which are then compared. If the acting bending moment is greater than the resisting one in correspondence of at least one section, the tower is vulnerable to the design horizontal action. The distribution of acting loads depends on several spectral parameters, including the fundamental period of the structure, the return period of the earthquake and the typology of soil.
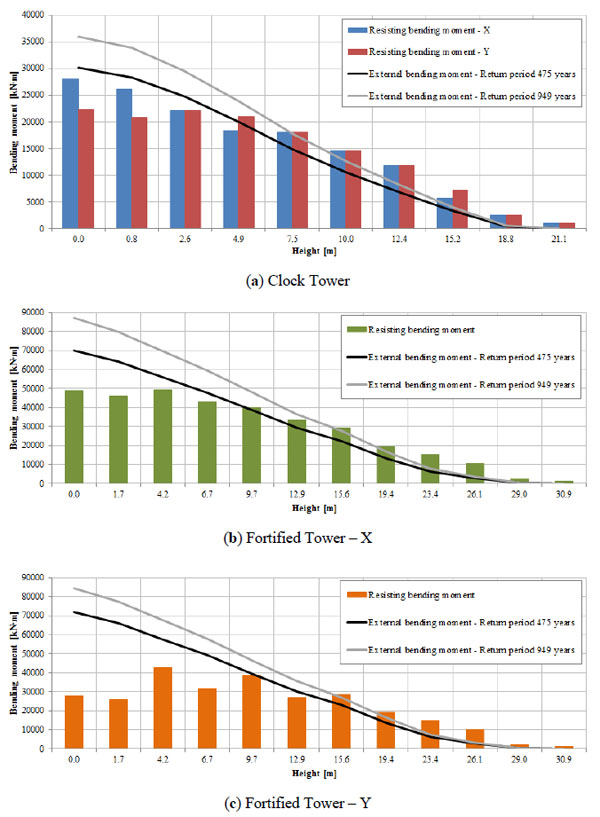
The aforementioned simplified approach was used for both the Clock and Fortified Towers, and the results are synoptically reported in Fig. (10). The equivalent static analyses were extensively commented in [13], where the reader is referred to also for further details regarding the evaluation of the so-called seismic safety index and acceleration factor, which [2] deems useful for seismic assessments. Here it is worth noting that, using a cantilever beam approach and exception made for towers with huge irregularities, collapse systematically occurs due to the formation of a plastic hinge induced by bending near the base, where the resisting bending moment is usually lower than the external one (see Fig. (10)). This outcome appears rather unrealistic compared to the actual behavior observed during an earthquake. Indeed, for such occurrence almost all the towers experience either the formation of vertical cracks or full collapse caused by the formation of a mixed shear-bending hinge. Therefore, more sophisticated analyses (e.g. nonlinear dynamic analyses) should be conducted to have a more realistic insight into the behavior under horizontal loads of such structures.
4.3. Nonlinear Static Analyses
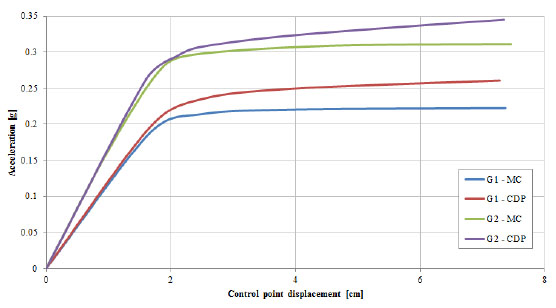
The pushover analyses were carried out in agreement with [14]. Two different load distributions were applied to the numerical models: one was the G1 previously described, whereas the other was only dependent on the masses and uniformly distributed along the height – consistent with the Group 2 (G2) as defined in [14]. The capacity curves for both towers are shown in Fig. (11), and they were evaluated for each material model and load distribution here considered. The results showed that the CDP and MC materials gave similar responses, demonstrating a good correspondence between the two models and hence implicitly validating the use of an elastic-perfectly plastic model for the analysis of such structures in the nonlinear range. As expected, the G1 distribution produced more conservative results than the G2 one, thus it should be preferred when choosing the distribution to apply in nonlinear static analyses.
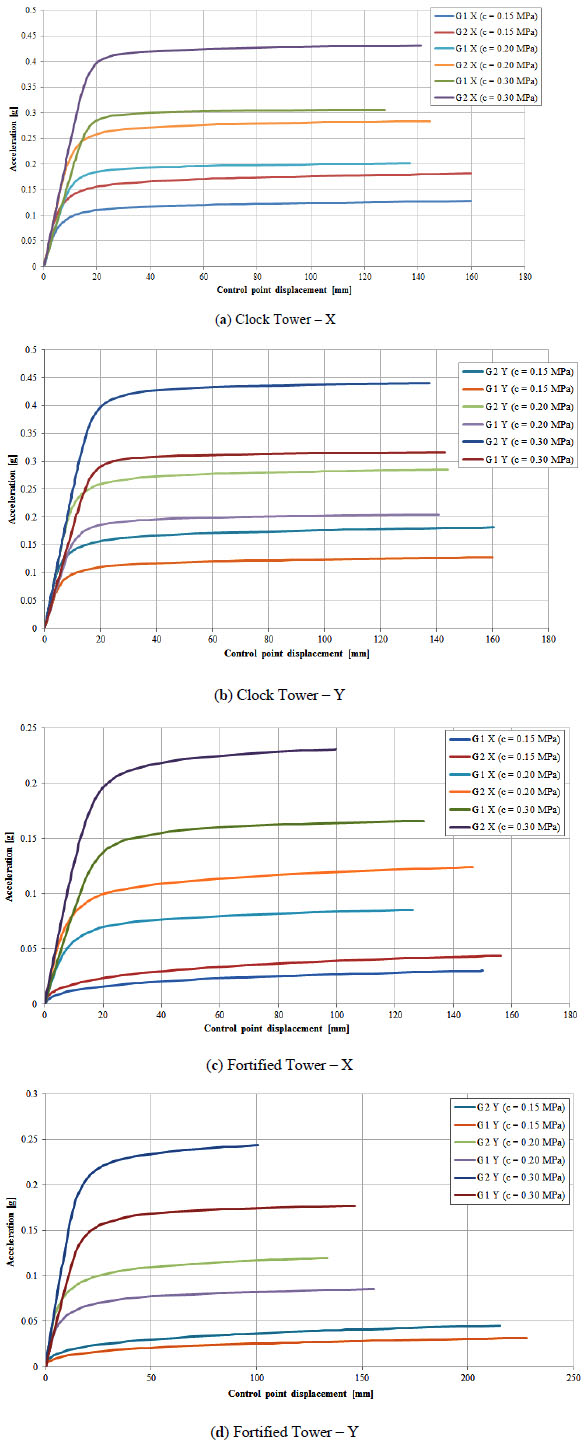
Pushover analyses are then repeated varying the cohesion value over a wide range (0.15, 0.20 and 0.30 MPa respectively) for both towers and the two load distributions. The capacity curves for all the cases are depicted in Fig. (12). It can be noted that cohesion plays a crucial role on the peak load value, because failure occurs for the formation of a mixed shear and bending hinge near the base.
4.4. Nonlinear Dynamic Analyses
As for the Castle, the real ground accelerations recorded by the station of Mirandola were used for the nonlinear dynamic analyses of the two towers. However, in this case also the vertical component of the acceleration was applied to the numerical models. The same CDP material calibrated for the pushover analyses was employed in these analyses, since a mechanical model taking into account damage is needed when seeking realistic results for nonlinear dynamic analyses, whesre several load-unload cycles are applied to Gauss points in the meh.
Fig. (13) presents the results obtained in terms of time-displacement diagrams and damage maps at the end of the simulation. The horizontal displacement of each tower was extracted in reference points located at the very top of the computational models. The maps showed widespread damages at the base of the towers, suggesting that failure occurred due to the formation of an inclined plane of weakness – a shear plane; moreover, vertical cracks appeared close to the openings, in a good representation of the real outcome. The horizontal displacement histories showed residual displacements compatible with the collapse of the towers (about 3.5 and 7.5 cm for the Clock and Fortified Towers, respectively).

5. NUMERICAL INVESTIGATION OF THE ROSARIO CHURCH
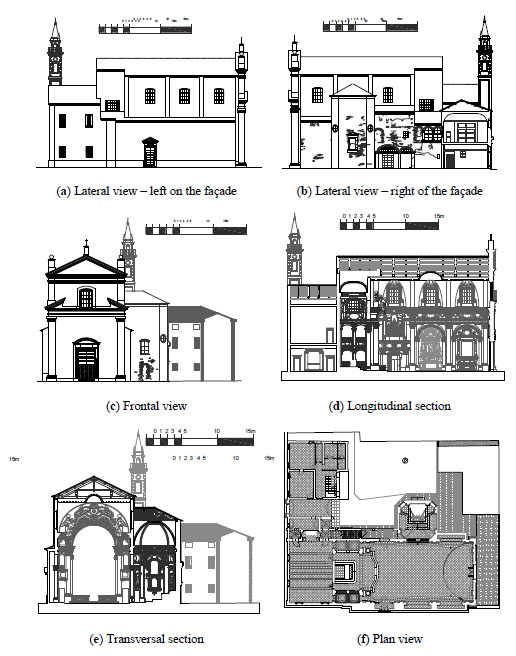
The so-called Chiesa di Santa Maria del Rosario (from now on labelled “Rosario church”) is a historical, unreinforced brick masonry structure located at the Northern boundary of Finale Emilia (Fig. (1)). Geometrically, the structure presents a rectangular plan with dimensions approximately equal to 32x13 m. It is constituted by a large single nave (roughly 20 m long and 13 m wide) and a rectangular presbytery with dimensions equal to 7x13 m. The average thickness of the walls is 50 cm. The height of the façade is about 17 m, and a two-story building (whose height is 13 m) is directly connected to the back of the apse. The interior walls are supported by semicircular arches and columns. The bell tower is about 20 m high and is partially linked to the main building at one of its corner. Fig. (14) shows geometric details of the Rosario church.
After the 2012 seismic sequence, several surveys were conducted to have an insight into the state of damage induced by the quakes. Widespread damages were observed on the façade, suggesting the activation of a rocking movement along a horizontal hinge near the base, with detachment from perpendicular walls. Moreover, the walls of the lateral nave displayed cracks due to shear (especially in correspondence of openings) whereas the transect partially collapsed for shear and out-of-plane bending. Finally, a severe detachment at the connection between the church and the bell tower was noticed, with the latter undergoing a rotation along its vertical axis.
5.1. FE Mesh, Material Properties
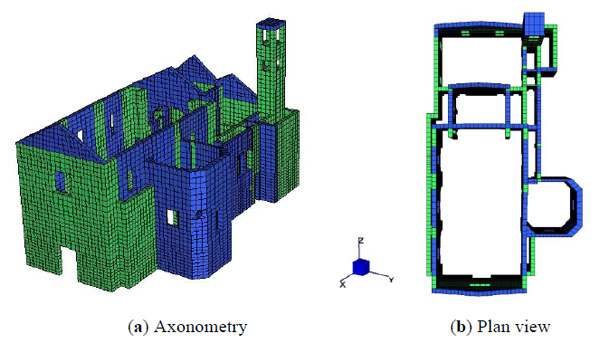
The numerical analyses were performed using the commercial code Strand7. The computational model of the Rosario church presented a finite element mesh consisting mainly of brick elements with the addition of some wedge elements, for a total of 19275 nodes and 9076 elements as shown in Fig. (15). Non-structural wooden elements like floors, ceilings, roofs, and stairs were not considered in the analyses; hence, their limited stiffness was totally neglected and conservative results were expected. The vertical dead and live loads and the equivalent horizontal action were directly applied to the masonry walls. All the degrees of freedom of the nodes located at the base of the structure were fully restrained.
As for the previous case, an isotropic elastic-perfectly plastic model and a Mohr-Coulomb failure criterion were assumed for the masonry. The mechanical properties employed in this case are summarized in Table 6.
| Density [kg/m3] | Young’s Modulus [MPa] | Poisson’s Ratio [-] | Cohesion [MPa] | Friction Angle [°] |
|---|---|---|---|---|
| 2000 | 2000 | 0.2 | 0.15 | 30 |
5.2. Nonlinear Static Analyses
The nonlinear static analyses were again performed according to [5]. The horizontal loads applied to the numerical model were consistent with the G1 and G2 distributions previously described, and they are respectively labeled Load Case 1 and Load Case 2 in the analytical computations reported hereafter. Both distributions were applied along the positive and negative directions of the local axes chosen for the Rosario church (namely, X is the longitudinal axis and Y is the transversal one). As an example, Fig. (16) shows the two distributions along the local axis X.
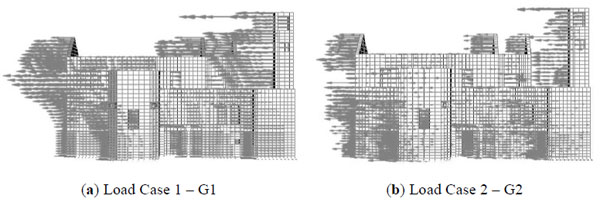
Fig. (17) shows the deformed shape at the last iteration of the pushover analysis performed with the load distribution presented in Fig. (16a).
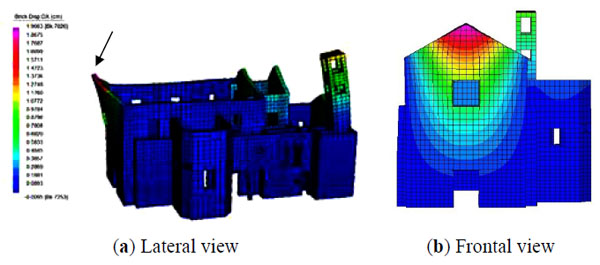
The results clearly show the formation of a failure mechanism that involves the overturning of the façade in its upper part, the failure of the bell tower, and damage in the lateral walls of the central nave. The general state of inelastic deformation and the active failure mechanisms appear in satisfactory agreement with the state of damage occurred in reality.
The capacity curves obtained for both load cases are displayed in Fig. (18).
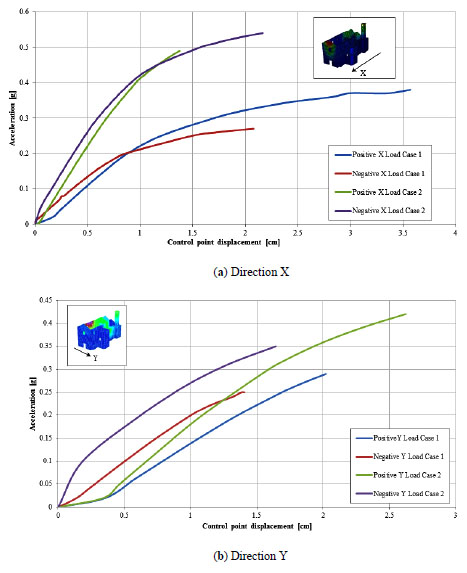
High values of the collapse accelerations are obtained from the capacity curves, even for the Load Case 1. Such results do not completely justify the state of damage induced by the earthquake, and the discrepancy is mainly linked to the cohesion value assumed for masonry.
In order to investigate the role of cohesion, a sensitivity analysis was carried out by considering two lower values for the parameter, namely 0.1 MPa and 0.05 MPa. It was expected that the capacity curves would be more realistic for decreasing values of cohesion, which well approximates the situation of a no-tension material. Fig. (19) shows the capacity curves for cohesion equal to 0.1 MPa and 0.05 MPa, respectively, along the X direction.
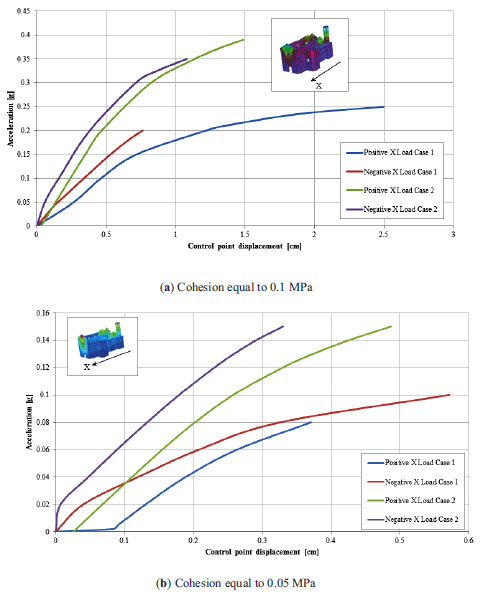
The results show that the failure mechanisms activating on the church do not considerably change when compared to those obtained for a higher cohesion value. Conversely, the values of collapse acceleration are sensibly reduced. In particular, a gradual reduction in the displacement capacity of the structure is observed for decreasing values of cohesion. Moreover, for the case where the cohesion was set equal to 0.05 MPa, the results show that an acceleration lower than 0.1g is responsible for the collapse of the structure, which appears reasonable in light of the experience collected with damages induced by the seismic sequence and the knowledge about the characteristics of the accelerograms. Visible inelastic shear deformations may be also noticed on the façade, a result which appears consistent with the actual outcome.
CONCLUSION
A thorough investigation on the condition of a historic city center in the aftermath of a strong earthquake was carried out in this paper. Namely, the case of Finale Emilia (a village at the very heart of the area stricken by the 2012 Emilia-Romagna seismic sequence) was evaluated. Four heritage masterpieces were taken into consideration, belonging to different types of masonry buildings (a castle, two towers, and a church).
For the first time, a full structural analysis of a masonry castle was performed. The pushover analysis proved itself to be unable to grasp local effects due to the earthquake, only giving a general insight on the global behavior of the structure. Conversely, both the limit analysis and the nonlinear dynamic analysis presented satisfying results, correctly reproducing the actual outcome: an overall fair behavior of the Castle, but local structural weaknesses represented by the crown of the towers.
The results originating from the structural analyses of the Clock Tower and the Fortified Tower – both collapsed due to the earthquake – showed that, despite being allowed by the Italian guidelines, the equivalent static analyses were not able to correctly mirror the failure modes of the towers under the seismic action. The pushover analyses gave instead meaningful results in terms of the role played by cohesion in determining the peak load value. Moreover, the nonlinear dynamic analyses provided results compatible with the real situation, leading to the collapse of the towers.
Pushover analyses performed on the Rosario church showed a good correspondence in terms of failure mechanisms and inelastic deformations, but a reasonable collapse acceleration was found for a value of cohesion smaller than the lower bound value proposed by [18].
CONSENT FOR PUBLICATION
Not applicable.
CONFLICT OF INTEREST
The authors declare no conflict of interest, financial or otherwise.
ACKNOWLEDGEMENTS
Declared none.

