All published articles of this journal are available on ScienceDirect.
The Influence of Dowel-Pin Connections on the Seismic Fragility Assessment of RC Precast Industrial Buildings
Abstract
Background:
Recent major earthquakes in the centre of the Italy, between August and October 2016, have reaffirmed the seismic vulnerability of precast industrial buildings with a lot of collapse recorded. This is typical due to the past Italian building practices, where structural deficiencies are mainly related to the capacity to transfer horizontal forces between primary structural elements.
Objectives and Methods:
In these types of structures, a key role is played by the dowel pin connections which allow to transfer lateral horizontal forces from the beam to the column, without losing load carrying capacity. For this reason, in this work, the assessment of the seismic fragility of single-story reinforced concrete precast building located not far from the epicentres of the two aforementioned earthquakes was done.
Results and Conclusion:
The seismic risk was evaluated in terms of annual frequency of exceedance for three performance levels provided by the European and Italian seismic codes, considering the mean hazard curves for the site. The comparison between the fragility of different structural models shows the importance in the choice of the column-beam connection modelling to obtain reliable results on the structural safety assessment.
1. INTRODUCTION
During the last earthquakes in Italy, i.e. Emilia Romagna 2012 and Marche-Umbria-Lazio-Abruzzo 2016, many Reinforced Concrete (RC) Industrial Precast Buildings (IPBs) collapsed or suffered heavy structural damage [1-3]. The main deficiencies are due to lack of joint connections between the main structural elements, so the horizontal forces are transferred only by friction forces or through inefficient steel dowels.
Thus in the last years, many studies were performed [4-6] in order to better understand the seismic behavior of this type of structures and to evaluate their seismic risk in order to establish direct losses, such as human casualties and structural and non-structural failures, and indirect economic losses as a consequence of the business interruption.
Or this purpose, fragility curves, representing the conditional probability of reaching or exceeding a certain performance level (or damage state) given a specific level of the intensity hazard, have been developed by several authors [7] for PIBs. The curves are mainly based on analytical methods, while empirical studies are conditioned to the information available for this type of structures. The method that should be adopted to derive fragility curves essentially depends on the scale of the assessment (i.e. large scale or single building assessment) and on the quality and quantity of the available data. When the assessment is performed for a class of buildings on a large scale, a statistical treatment of the damage data surveyed after earthquakes can be used [8] providing an empirical relationship. Otherwise a numerical analysis can be performed, providing analytical relationship [9]. Furthermore, hybrid methods [10] are used when surveyed damage data are poor (i.e. statistical data are available only for some level of ground motion intensity) and they must be completed through numerical investigations and homogenised with each other.
Although, when the vulnerability assessment of a single building is carried out, only the analytical procedure should be performed and the nonlinear response can be obtained through nonlinear static or dynamic analyses [11-14]. An exhaustive description of the several methods available to derive vulnerability and fragility curves is reported in a study [15].
In this paper, fragility curves are developed for an Italian RC IPB through Incremental Nonlinear Dynamic Analyses (IDAs) [16], extending a previous work of the authors [17]. In the numerical models, three limits are considered defined as [18], i.e. Limited Damage (LD), Significant Damage (SD) and Near Collapse (NC). Their threshold values in terms of inter-storey drift (IDR) have been determined through pushover analysis. Some suggestions about LS thresholds are also provided in some studies [19, 20].
IDAs are considered the best tool to obtain analytical fragility curves because they allow to consider the cyclic response of the structural members, even for increasing levels of the ground motions. Differently the monotonic analysis, namely nonlinear static or pushover, does not capture the cyclic decay of the mechanical parameters and usually leads to non-conservative results.
In probabilistic risk assessment [4], in which fragility evaluation is a step, all significant epistemic and aleatory uncertainties should be considered. In particular, variability in the ground motion, structural modeling, in estimating structural capacity, and in the threshold values for structural damage states should be considered [21].
In this paper, the Probabilistic Seismic Hazard Assessment (PSHA) has been considered, accounting for the aleatory uncertainty in the Ground Motion (GM) by selecting 7 couples of natural time histories compatible with the hazard level considered on the basis of the reference building type (importance degree) and the reference site (stratigraphic and topographic conditions of the soil). The aleatory uncertainty was considered taking into account the mean hazard curve for the site, determined from the median one corrected through a coefficient function of the hazard curves related to the 84th and the 16th percentile [21].
The epistemic uncertainties are considered in the structural models only by varying the restraining conditions between primary and secondary elements. For this reason, the seismic response of three different structural models is evaluated.
Differently, the continuous variables of the material mechanical properties [22], constitutive laws of the plastic hinges, and of the LS thresholds have been considered as deterministic. In fact, numerous investigators [23] have found the seismic demand as the dominating parameter of the overall response variability.
1.1. Seismic Behavior of RC Precast Industrial Buildings
PIBs designed without seismic resistance criteria show several weaknesses, such as low stiffness, strength, and ductility [3]. In particular, the high flexibility due to the weak joint connections and inter-story height, leads to large roof displacements and so the collapse occurs for the connection failure mechanism if adequate constraints are not adopted.
This situation is very relevant in Italy because between the 1950s and 1990s, a large number of constructions were built in many industrial districts with low levels of seismic hazard, and without details of the capacity design.
The first Italian regulations regarding PIB date back to 1987 [24]. In 1996, the enforced Code [25] provided additional regulations, but only after the 2003 [26] appropriate seismic design criteria. For these reasons, many existing buildings were designed only considering static loads, leading to simply frictional joint connections in the PIB. A description of the typologies of RC precast buildings present in Italy is reported in some studies [1, 3, 5] and also in Sect. 2 of [11].
Differently, in some areas considered as seismic, the dowel system is one of the most used beam-column connections, such as in the case analyzed herein. The dowel pin is a mechanical device allowing the transmission of horizontal actions [27, 28], and it generally consists of one or more steel dowels embedded in the column and inserted in a beam hole, filled with mortar.
Numerical Models (NMs) of PIB usually implement this kind of connection as hinge, fixed between structural elements, considering it strong enough to avoid failure during earthquakes. However, the dowel pin connection behavior is quite complex, because it is influenced by the behavior of different materials (concrete and steel), by the contact among elements (i.e. column-concrete/dowel and mortar/dowel), as well as by joint structural elements (i.e. rotational capacity of beam and column).
Different failure mechanisms could happen (Fig. 1) in this type of connection [28]: (i) Spalling of concrete cover occurred before the yielding of the dowel (due to small size of the cover and the lack of dense stirrups close to the supporting zones); (ii) flexural failure of the steel dowel (combined steel/concrete failure); (iii) shear failure of the steel dowel.
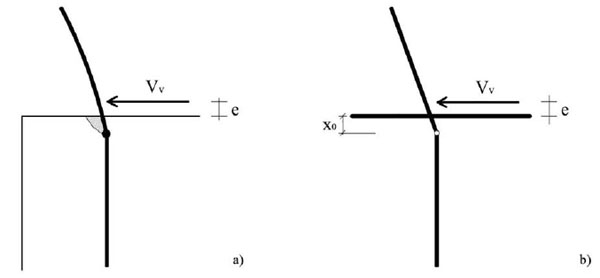
The enforced Italian Code [29, 30] underlines the importance of the assessment of connection performance, but it does not give clear suggestions of how to do this, considering the deformability and limited resistance of the dowel pin. In Europe, the codes are used to tackle the problem with Eurocode 8 [31]; major information on this issue is contained in the references [28, 32] with some appropriate capacity equations to this problem.
In the literature, there are not many studies on the influence of dowel capacity on the overall spatial responses of the structures, its seismic vulnerability and, more generally, on the seismic fragility and risk assessment. There is one of the most important works [6] where the concept of robustness of precast buildings was studied, in which the authors observed that the collapse of few (even one) connections can cause the collapse of the whole structure and, consequently, the loss of both lives and inventory.
Other recent studies [27, 33-35] also aimed at developing a specific procedure for the estimation of dowels capacity.
A literature review of the dowel-pin connections is reported [17], in order to have a better exposure of the available methods to calculate the shear capacity of one-sided and double-sided dowels pin.
In this work, the capacity of the dowel pin connection is provided by the CNR 10025/84 [36] which gives a formula to evaluate the monotonic shear strength of the dowel connection:
 |
(1) |
where db is the dowel diameter, fcd is the concrete design compressive strength, fyd is the dowel design yielding strength and c is equal to 1.2 (without confinement) or equal to 1.6 (with confinement). The confinement effect refers to the presence of compressive stresses, perpendicular to the shear direction (see Figs. 3, 2, 4, 1) of [36]). In this case, the effect of confinement is not considered since the presence of an effective contact area between the beam and column is plausible only in the principal frame direction. In the other direction, only the beam’s web is in contact on the column top end with a limited zone. This formula is valid if the eccentricity (e) of the shear force (see Fig. 1) is less than half of the dowel diameter (db). The CNR formulation does not consider the influence of the concrete cover on the connection shear strength because it supposes that the connection failure always occurs for steel flexural failure. This formulation is directly derived from a study [37] where the phenomenon was analysed by means of the plasticity theory. Since concrete and steel acquire a plastic behaviour, the problem can be analysed by considering the dowel actions as a pile resisting as Winkler’s material (the concrete). It is important to stress the fact that in the analyzed case, the shear force eccentricity was observed to be less than half of the dowel diameter [17].
2. MATERIAL AND METHODS
2.1. The Case Study
The reference building has a simple and geometrically regular structural scheme as shown in Fig. (1), which is typical for RC single-story PIB. This building, located in the Centre of Italy, was erected between the end of the 1960s (dark gray in Fig. (2), with in-situ cast columns, and the end of 1970s (light gray in Fig. (2), with precast columns. Differently, the roof beams are always factory-made products with good materials and reinforcement.
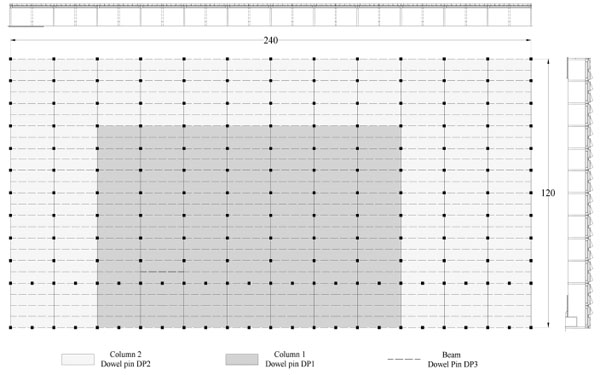
The structure has a rectangular plant that covers an area of about 28.800 m2, with the longest side equal to 240 m and the shortest one equal to 120 m (Fig. 2). It is characterized by rectangular nets of the columns of 20 m x 10 m and the columns’ height, measured from the industrial floor, was equal to 8 m, with a square cross-section of 0.6 m x 0.6 m. The beam-column connections are made of steel dowels, with a diameter equal to 22 mm and steel type FeB38k [38]. Differently, the secondary beams wer connected to the principal ones by dowels of 16 mm of the diameter of the same steel type (Fig. 3).
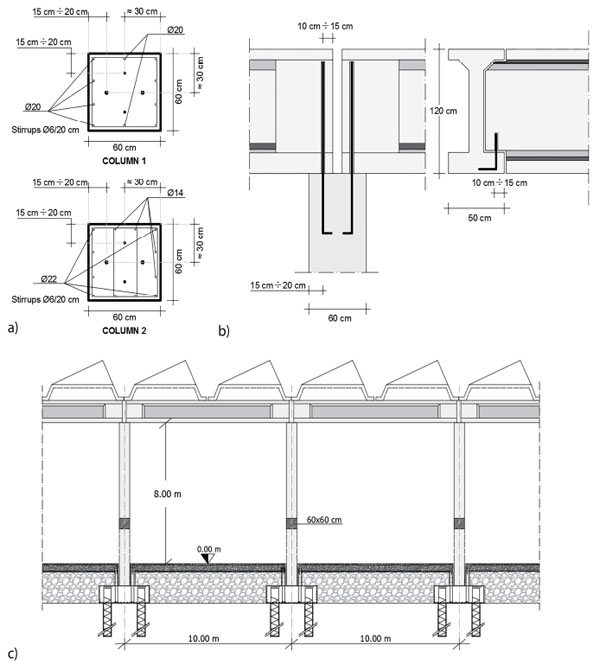
Two different connections between the column and the beam elements were considered, namely dowel pin DP1 and DP2 depending on the different fc value of the in-cast and precast columns. Another connection, named dowel pin DP3, between the main beams and joists, was also considered Fig. (3b and Table 1). The distance, evaluated in the direction of the beam elements, with respect to the side Fig. (3a) was observed to be about 150-200 mm for the columns and about 100-150 mm for the beams.
The mechanical parameters considered in the structural models are reported in Table 1. It is worth noting that average values, with respect to typical values of PIB in that construction period, were considered. For the rebar inside the columns and beams, the original design drawings and tables were obtained.
|
fc [MPa] |
Em [MPa] |
fym (bars/stirrups) [MPa] |
Dowel Pin |
|
|---|---|---|---|---|
| Column 1 | 30.0 | 22941.4 | 380/320 | DP1 |
| Column 2 | 35.3 | 24083.7 | 380/320 | DP2 |
| Beam | 35.3 | 16055.8 | 380/320 | DP3 |
The available data permitted to achieve a restricted Knowledge Level (KL1) such as classified in the Italian Seismic Code [29, 30] corresponding to a Confidence Factor (CF) equal to 1.35, that is the same approach adopted in Eurocode 8 [18]. The CF is used to reduce the material resistances when safety checks are performed, but in a risk assessment framework, the mean values of the mechanical parameters are used to obtain a more realistic estimation of the structural capacity.
It has been difficult to clearly establish the type of the dowels pin, so a sensitive analysis of the seismic vulnerability has been performed [17] through linear and nonlinear analyses, adopting values of the shear capacity from several formulation taken from other studies. The values adopted are reported in Table (2), calculated with the resistance values shown in Table 1.
|
DOWEL PIN DP1 VRd [kN] |
DOWEL PIN DP2 VRd [kN] |
DOWEL PIN DP3 VRd [kN] |
|
|---|---|---|---|
| CNR 10025/84 | 62.01 | 67.27 | 35.58 |
The foundations are made of plinths (with piles) connected by perimeter curb, and at the ground level, there is a reinforced industrial floor (Fig. 3c). These characteristics permit to consider the columns fixed at the zero level of the industrial floor and to neglect any effect due to seismic input asynchrony at the base of the different columns.
The covering structure is of shed type and it is made up of pre-stressed RC tiles, which are simply supported by the beams. The loads on the roof are very heavy due to complete suspension of a production plant attached to the cover.
2.2. Numerical Modeling
In this section, a summary of the major results of the seismic vulnerability assessment of the aforementioned industrial building is reported. In order to consider the epistemic uncertainty in the joint connections, three models were considered: two of them were constituted only by beam and column elements for which the beam-column connections perfectly restrain the relative horizontal sliding. In Model 1, the connections are cylindrical hinges, only the bending moment around the horizontal axis is released, while the rotation around the vertical axis is restrained. This typically represents a correct capacity design or the presence of two or more dowel pins. In Model 2, the connections are spherical hinges, both bending moments are released. This typically represents a configuration with a single dowel pin with higher resistance than the column. Model 3 has the same bending joints of Model 2, but in addition, it has horizontally deformable connections.
Models 1 and 2 are those commonly used in practice; they are considered as reference to highlight the improvements obtained by an accurate modelling of the connections, as done by Model 3.
The effects of cladding panels were not considered in this paper because the infill walls are made of metal corrugated sheets with very low weight/mass. Thus, it is possible to neglect any interaction with the structure under dynamic excitations, without significant changes in the collapse mechanism of the structure. However, the presence of heavy infill (i.e. masonry or concrete cladding panels) significantly changes the dynamic behaviour and the collapse mechanism of the frame structure, as reported in a study [39]. Even if the cladding panels are considered as non-structural elements, they play a meaningful role in the vulnerability of the structure, as shown during recent severe seismic events (i.e. Emilia earthquake in 2012), in which non-structural elements also suffered severe damage, causing a lot of economic losses.
The structural model is reported in Fig. (4). Beams and columns are 1D elements, and the columns are fixed at their base. Rigid links to simulate the eccentricity in the local connections and general links to simulate the dowel joints are used. The masses are distributed along the elements as well as the loads.
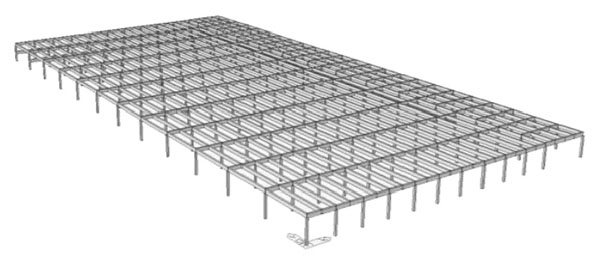
For each model, the hypothesis of the deformable floor in its plane is employed, since this is the closer to the real case. The main dynamic characteristics are reported in reference [17].
2.3. Intensity Measure and Damage Model
In the fragility assessment, a critical choice consists of the Intensity Measure (IM) parameter, representative of the seismic action, and the Damage Measure (DM), representative of the structural and non-structural damaging, which must be adequately correlated.
With regard to IM, the Peak Ground Acceleration (PGA) is commonly used since it is the simplest parameter extracted by the GM records, even if sometimes it leads to large scattering when structures with a long fundamental period are considered [6].
The choice of adopting IM also depends on the type of analysis performed: if fragility curves are derived from pushover analyses, the spectral acceleration Sa(T) (or displacement Sd(T)) at the fundamental period is used. Typically, the elastic period is adopted, but it is not very representative of the dynamic behaviour with slight damage. Instead, if IDAs are performed, the choice may fall on the PGA, Sa(T), PGV or on integral parameters as the Arias Intensity (IA) and the Housner Intensity (IH) [40].
Furthermore, the choice of the IM must be well correlated with the damage parameters adopted. For example, for the inter-story drift, the IH, IA and the Peak Ground Velocity (PGV) seemed to provide better correlations than the PGA. However, in this work, the PGA was adopted as intensity measure. This choice came from the large use of this seismic parameter in the fragility assessment and then the obtained curves could be simply compared with those available in the literature.
With regard to the damage model, it should be able to take into account the different damage states, which define the thresholds between different damage conditions regarding structural and non-structural elements. Furthermore, at each damage state, a clear description of the damage should be given.
In PIB, the structural damage should be evaluated considering a global damage parameter such as the maximum Inter-storey Drift Ratio (IDR) or several local damage parameters [40, 41] among which the strain level in materials, the chord rotation in structural elements and the connection failure mechanism should be considered.
The IDR is a good structural and non-structural damage estimator, but in some cases, more reliable results could be reached considering the damage as a function of both IDR and the mean ductility ratio (i.e., in terms of chord rotation) in the structural elements for each floor. Generally, different parameters could be associated at different LS.
For the aforementioned reasons, in this study, the IDR was the adopted damage parameter, through which, the threshold values for each LS were determined through pushover analyses. These thresholds correspond to the local limit conditions, in terms of bending or shear that first occurs in few elements. Generally, threshold values of the damage parameter can be associated with the five damage levels provided by the EMS98 scale [42], in order to classify the building into a vulnerability class of the macroseismic method and to develop vulnerability curves [43]. An exhaustive exposure of the damage scales commonly used in the practice can be found in reference [44].
2.4. Pushover Analysis
The nonlinear statical analysis has been performed with the aim to determine the LS thresholds for the three analysed models. This choice arises from the need to by-pass the higher costs linked to the evaluation of the LSs with the IDA, being the GM scaled in a discrete way and not in a continuous manner as happens for the horizontal load patterns in pushover analysis. Furthermore, pushover allows identifying general characteristics of system behaviour, i.e. elastic limit, redistribution of forces within the system subsequent to initial yielding, and locations of plastic hinges.
A lumped plasticity model [45] was considered in a study and the nonlinear properties were assigned only to the columns and general links simulating the dowel pins. The columns were characterized by elastoplastic behaviour for bending moments with nonlinear constitutive law suggested by the Eurocode 8 provisions [18] and limited ductility behaviour. The shear failures have been taken into account by the introduction of shear hinges with elastic-brittle with limited ductility behaviour [45, 46]. For general links, the steel flexural failure was considered with Eq. (1), thus they were characterized by nonlinear laws with limited ductility as explained in a study [17].
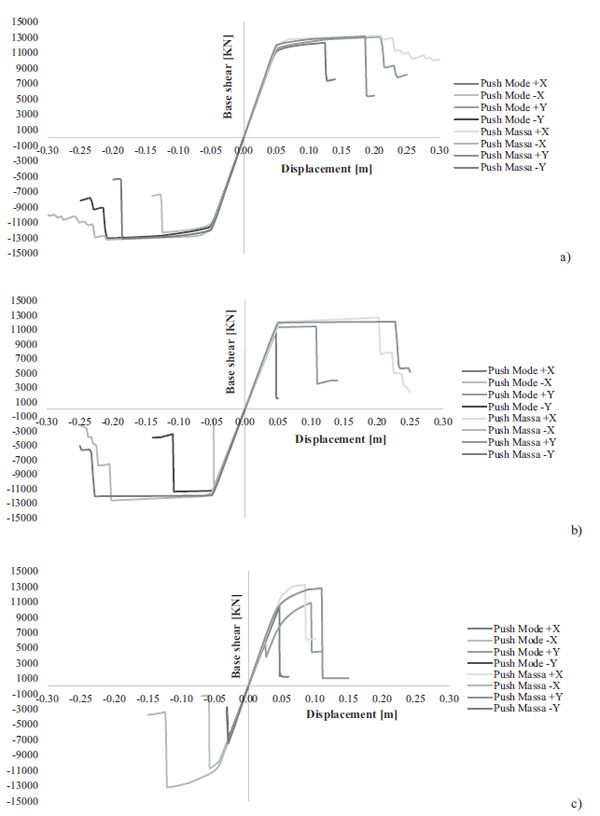
The analyses were performed following the N2 method, originally proposed by some authors [47] and adopted in some studies [29, 30], by applying,, two different horizontal load patterns for both X and Y directions. The first one is proportional to the fundamental modes in the considered direction (namely PushMode), while the second one is proportional to the masses (namely PushMass); a total number of eight analyses were carried out for each model. The control node was chosen at the level of the roof, near the center of the plant. Fig. (5) shows the capacity curves provided by the three considered models, namely Model 1, Model 2 and Model 3.
Model 1 provides capacity curves (Fig. 5a) that are very similar in X and Y directions at varying applied load patterns. Generally, the curves show a high ductility for the structure and peak value for the base shear with respect to the other models. Similar results are reported in Fig. (5b) for Model 2, in particular for the PushMass load distribution; otherwise, a brittle behaviour was observed for the PushMode distribution in both the directions. However, for both models, the collapse occurred in the activation of flexural hinges at the base of the columns.
For Model 3, a more brittle capacity curve was observed, due to the presence of the dowel pins. These curves showed a sudden increase when few connections were broken. A lower ductility should be better appreciated by comparing the curves shown in Fig. (5) with those related to the models with cylindrical and spherical hinges respectively in Figs. (5a and 5b). The nonlinear static analysis highlights the primary role played by the connections.
Then IDR thresholds for the three LSs considered (LD, SD, NC) have been calculated. For each analysis and direction, the step on the capacity curve was considered for which, a little number of close plastic hinges reached the thresholds damage state in terms of chord rotation (only columns) or shear strength (columns and dowel-pins). In particular, the LD damage state was achieved when the yielding threshold was exceeded; SD was observed when the ultimate condition was almost achieved, and the NC limit state was achieved when the columns and/or the dowel pins reached their ultimate capacity.
For better comparison with subsequent IDA curves and a unique threshold damage parameter for the considered LS, a mean value of IDR for the eight capacity curves is also reported in Table 3.
|
Damage state |
Model 1 [%] |
Model 2 [%] |
Model 3 [%] |
|---|---|---|---|
| LD | 0.53 | 0.52 | 0.30 |
| SD | 1.58 | 1.17 | 1.01 |
| NC | 2.30 | 1.85 | 1.29 |
A large scattering in IDR threshold values between Model 3, Model 1 and Model 2 is shown in Table 3, especially for the LD and NC damage states, where Model 3 provides almost half values than the others. Furthermore, the IDR values related to SD and NC damage states were observed to be very close for Model 3, if compared to Model 1 and Model 2.
2.5. Risk Assessment Framework
The risk assessment allowed us to evaluate the LS of the structure with respect to a given scenario (hazard level), considering the uncertainties in the seismic hazard, in the structural response and in the LS thresholds.
Results are generally expressed in terms of annual frequency of exceedance of the performance level, obtained considering both structural fragility and seismic hazard through the Total Probability Theorem:
 |
(2) |
where:
- S is an intensity level of the Intensity measure parameter (i.e. a value of PGA).
- PSL is the probability of exceedance the LS for the intensity level equal to S, computed from the fragility curve.
- λ(s) is the annual frequency for the intensity value S, obtained from the mean hazard curve.
Fragility assessment allows estimating the conditional probability of exceeding a certain LS for a given hazard level. The equation commonly used in literature to develop the fragility curves is:
 |
(3) |
where:
- p (LS | IM = x) is the probability that a ground motion with IM = x (or a Damage Parameter (DM) = x) will reach the LS.
- Φ is the standard normal Cumulative Distribution Function (CDF).
- μ is the median of the fragility function, the IM level (or DM value) with 50% probability of reaching the LS.
- β is the standard deviation of the ln(IM) (or the ln(DM)).
This formulation implies that the IM values of ground motions which make it possible to reach the LS are lognormally distributed.
Analytical fragility curves can be obtained from both static and dynamic nonlinear analyses [21]. In this paper, the fragility curves were obtained by the Incremental Nonlinear Dynamic Analyses (IDA) with the use of GM records (natural, artificial, synthetic), each scaled to multiple levels of intensity, compatible with the elastic response spectrum chosen as a reference for the considered hazard level (i.e. for a return period of 475 years). The aleatory uncertainty in the seismic demand was considered while selecting several compatible GMs, while the uncertainty in the structural capacity should be considered in the same way by generating several models with response surface method.
The curves obtained by the IDAs were observed to be equal to the number of selected GMs, in the plane DM - IM. In this work, the points on the curves represent the maximum value of the IM for a given scale factor and the maximum value of the considered DM parameter (i.e. IDR).
Thus, from IDA curves, it became possible to obtain the statistical parameters μ and β of the normal cumulative distribution ϕ. In order to extract these parameters, two methods related to IDAs are presented in literature [48, 49]. The first one requires the knowledge of both IM and DM values for which the LSs occur in each IDA curve. In the second case, the knowledge of the LS thresholds is used to count each IM level considered, the number of IDA curves that cross the vertical line corresponding to the considered threshold values. First of all, the cumulative frequencies were computed as the ratio, for increasing IM value, of the number of IDA curves that exceed the specific LS and the total number of IDA curves. Then, based on the cumulative frequencies, is became possible to estimate μ and β with Eq. (3) by applying an estimation technique such as the Maximum Likelihood Method.
In this paper, the last method was used because the GM records increased for discrete values (i.e, with a scale factor), and so it was not possible to detect the exact IM and DM values corresponding to the occurrence of the damage states considered herein.
Finally, it is important to stress the fact that the required LS thresholds are those obtained from the pushover analyses, and are reported in Table 3.
2.6. Incremental Dynamic Analysis (IDA)
Eleven natural ground motions have been applied to the three different models considered (i.e., Model 1, Model 2 and Model 3), by scaling the GMs in order to cover the range of IDR values from 0 to the near collapse threshold.
A modified Takeda-type model [50] is used for columns, due to its ability to provide simple, numerically stable and sufficiently realistic hysteresis cycles.
The hazard assessment here performed composed of two-steps: the first one was the selection of GM records; the second one was the determination of the hazard curve for the risk assessment of a site. The considered PIB belongs to the “Class II” in the Italian seismic code [20]. This implies that the Limit State of Significant Damage (SLSD, or SLV in Italian) is associated to a demand recurrence period (TR,D) of 475 years, which corresponds to an expected PGA equal to 0.256g (ag,D). The other parameters that characterize the elastic response spectrum are (soil type T1 and category of subsoil C are considered): S = 1.5; TB = 0.152 s; TC = 0.456 s; TD = 1.904 s.
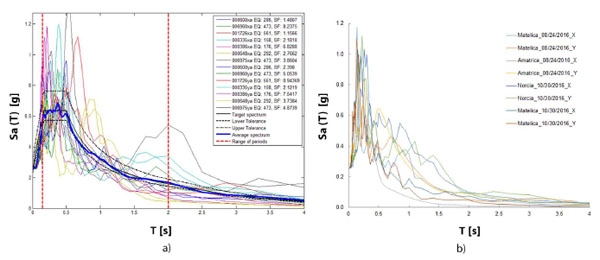
In the Probabilistic Seismic Hazard Assessment (PSHA), the aleatory uncertainty in seismic demand has been considered with seven (2-components) natural GMs, compatible with the reference SLSD spectrum and generated with the software REXEL [51]. Other four natural time histories, recorded during the two last strong Italian earthquakes in Amatrice and Norcia in August and October 2016, respectively, have been considered. All the selected time histories are listed in Table 4 and their spectrums, together with the reference median elastic spectrum, are reported in Fig. (6).
| Waveform ID | Earthquake ID | Station ID | Earthquake Name | Date | Mw | Fault Mechanism | Epicentral Distance [km] |
|---|---|---|---|---|---|---|---|
| 600 | 286 | ST223 | Umbria Marche | 09/26/1997 | 6 | normal | 22 |
| 6960 | 473 | ST3266 | Izmit (aftershock) | 09/13/1999 | 5.8 | oblique | 27 |
| 1726 | 561 | ST549 | Adana | 06/27/1998 | 6.3 | strike slip | 30 |
| 335 | 158 | ST121 | Alkion | 02/25/1981 | 6.3 | normal | 25 |
| 386 | 176 | ST152 | Lazio Abruzzo (aftershock) | 05/11/1984 | 5.5 | normal | 24 |
| 648 | 292 | ST221 | Umbria Marche (aftershock) | 10/14/1997 | 5.6 | normal | 13 |
| 6975 | 473 | ST3272 | Izmit (aftershock) | 09/13/1999 | 5.8 | oblique | 26 |
| 7073 | 641 | AMT | Amatrice | 08/24/2016 | 6.0 | - | 8.9 |
| 7073 | 641 | MTL | Amatrice | 08/24/2016 | 6.0 | - | 62.4 |
| 8863 | 681 | NRC | Norcia | 10/30/2016 | 6.5 | - | 5.4 |
| 8863 | 681 | MTL | Norcia | 10/30/2016 | 6.5 | - | 46.2 |
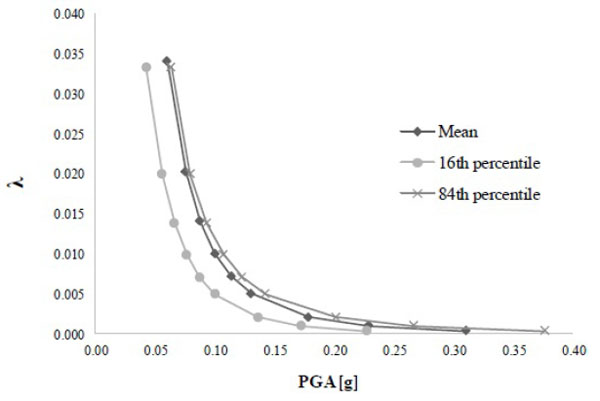
The hazard curve for the site has been determined in terms of PGA and annual frequency of exceedance (λ), considering the epistemic uncertainty through the mean hazard curve. By amplifying the median curves for a coefficient, the difference in the PGA values between the 84th and 16th percentile hazard curves for a given value of λ was considered. The hazard curves for the case study are reported in Fig. (7).
3. RESULTS AND DISCUSSION
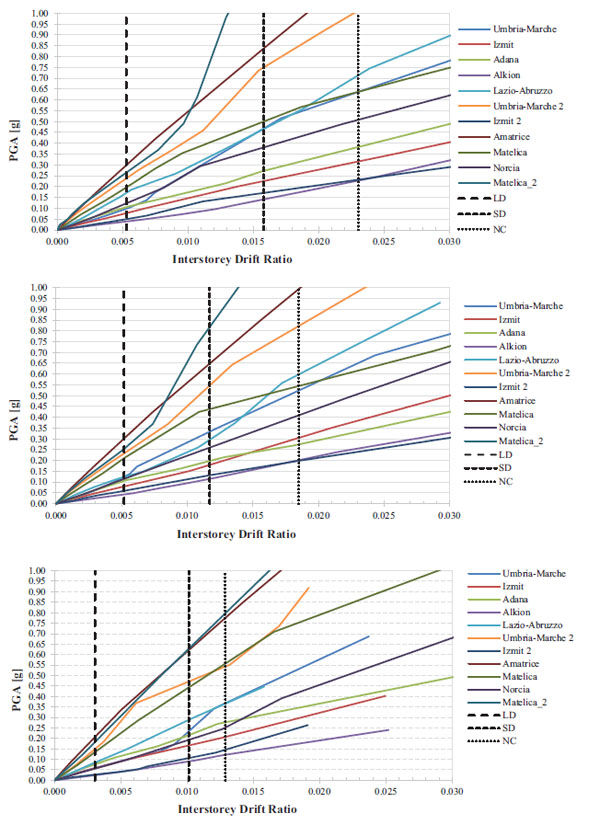
IDA curves in terms of maximum IDR and associated PGA, obtained for the three different structural models, are shown in Fig. (8). The vertical lines indicating the damage state thresholds were previously determined by means of the pushover analyses (see Table 3).
| Model 1 | Model 2 | Model 3 | ||||
|---|---|---|---|---|---|---|
| μ | β | μ | β | μ | β | |
| LD | 0.1364 | 0.5449 | 0.1324 | 0.5531 | 0.0772 | 0.5951 |
| SD | 0.4686 | 0.6757 | 0.2963 | 0.6164 | 0.2220 | 0.5951 |
| NC | 0.5731 | 0.6768 | 0.4771 | 0.6413 | 0.2875 | 0.5750 |
Further results are reported in a study [17], where IDA curves were plotted in terms of maximum displacements vs the corresponding base shear and were compared with the relative pushover curves which were observed to be same.
For each model, the number of IDA curves crossing the vertical lines representative of the three damage states has been computed for PGA values ranging from 0.05g to 1g, with an increasing step of 0.05g [52]. The cumulative frequencies of exceedance for the LD, SD, and NC damage states were obtained for each PGA step. Thus, the statistical parameters μ (median value) and β (standard deviation value) of the cumulative density functions ϕ were estimated by applying the Maximum Likelihood Method, reported in Table 5.
The fragility curves for the three models are plotted in Fig. (9) in terms of PGA, by distinguishing between the three considered damage states.
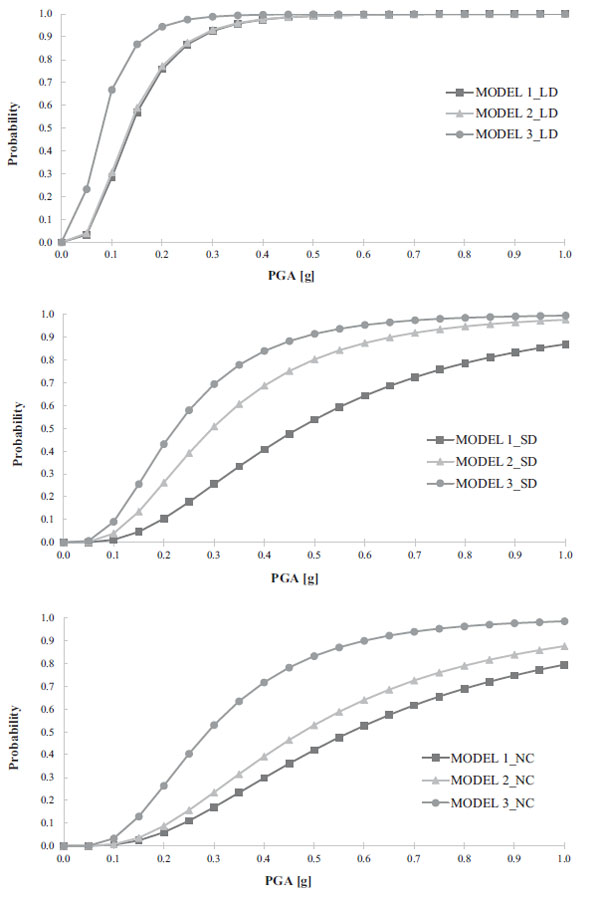
It is worth noting that, for all models, the fragility curves shifted on the left part of the graph and they were steeper for the LD damage state, while the ones shifted on the right part were more flat with high damage level. Furthermore, it was evident that the fragility associated with Model 3 was larger than those of Model 1 and Model 2 for all the damage states, and this difference increased with the damage level.
Model 1 and Model 2 provided very similar fragility curves for LD, while they were different for the other LS, especially for SD where Model 1 gave the lowest fragility. Moreover, Model 1 showed the same curves for SD and NC, meaning that the two damage states reached almost in the same time, although the exceeding probability was very low.
However, only a fragility curve for each LS should be determined as representative of the building, thus the curves for the same LS related to Model 2 and Model 3 were combined with the Weighted Average Method; because they represent the more realistic modelling of the joint connections for the analyzed building.
This choice was due to the lack of information concerning the different dowel-pin connections. In fact, not all connections were perfectly evaluable with Eq. (1) due to the presence of mortar that fills the holes, neoprene films, etc. For this reason, it is reasonable to assume a unique model that well represent the actual average structural behavior of the analyzed PIB by merging the Models 3 and Model 2.
Conversely, as previously mentioned, Model 1 is considered as a representative of a good design or a retrofitted condition of the building. Thus its fragility curves should be compared with those obtained by combining the curves of Model 2 and Model 3, in order to have a better perception of the reachable safety level with some retrofitting interventions in the column-beam connections.
The weighted scores assigned to each model depend on the degree of representativeness of the real structures. In this case, the model with general link simulating the presence of dowel pins (Model 3) was considered as the most realistic, so a weighted score equal to 0.7 was assigned, while a weighted score of 0.3 was assigned to Model 2 (spherical hinge in the connections). Thus, the final fragility curves for LD, SD, NC damage states are shown in Fig. (10).
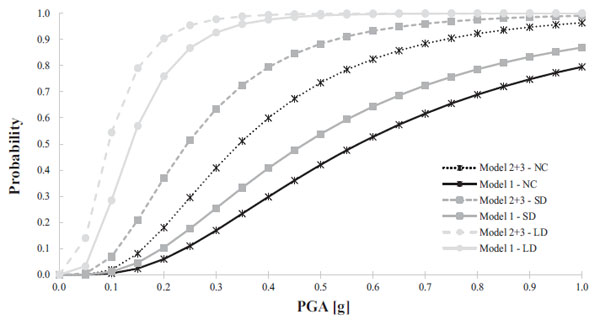
The curves show that Model 1 has a lower fragility than Model 2+3 especially for the SD and NC, being the related curves much more flattened on the X axis. Further, it is to be noted that Model 1 has a high fragility with respect to LD, such as Model 2+3. This means that different types of interventions, and not only those in the main connections, should be done in order to decrease the fragility of the PIB such as, for example, the addition of steel bracings inside the frame.
The probability of reaching each damage state considered in this work could be thought as the same of the LSs provided from the Italian seismic code SLD, SLV, SLC. Thus, from final fragility curves, the probability has been computed for PGA values on the bedrock corresponding to the hazard levels for the three LSs and it is shown in Table 5.
|
Limit State |
PGA [g] |
Probability of reaching LS | |
|---|---|---|---|
| Model 1 | Model 2+3 | ||
| SLD | 0.076 | 0.14 | 0.36 |
| SLV | 0.178 | 0.08 | 0.30 |
| SLC | 0.229 | 0.09 | 0.25 |
Finally, the seismic risk was evaluated for Model 2+3 and Model 1. To this aim, the admissible values of the annual frequency of exceedance (λSL target) for each LS were computed as the inverse of the related mean return period TR.
Differently, the annual frequency of exceedance for each LS was computed through Eq. (2), considering for each PGA value, the corresponding probability on the fragility curve and the frequency on the mean hazard curve, and multiplying by 2.25 [21], in order to consider the aleatory uncertainties in the structural capacity. The results and the safety checks are shown in Tables 6 and 7, respectively for Model 2+3 and Model 1.
| Limit state |
TRD,SL [years] |
λSL Target =1/TR,LS |
λSL Computed [Eq. (2)] |
Check |
TRC,SL =1/ λSL [years] |
|---|---|---|---|---|---|
| SLD | 50 | 0.0200 | 0.0857 | FAILS | 11 |
| SLV | 475 | 0.0021 | 0.0114 | FAILS | 87 |
| SLC | 975 | 0.0010 | 0.0039 | FAILS | 258 |
| Limit state |
TRD,SL [years] |
λSL Target =1/TR,LS |
λSL Computed [Eq. (2)] |
Check |
TRC,SL =1/ λSL [years] |
|---|---|---|---|---|---|
| SLD | 50 | 0.0200 | 0.0420 | FAILS | 23 |
| SLV | 475 | 0.0021 | 0.0023 | FAILS | 434 |
| SLC | 975 | 0.0010 | 0.0012 | FAILS | 847 |
The safety check results show a very different condition for Model 2+3 and Model 1. The former provided very low values of capacity in terms of the return period (TRC,SL) for all considered LS, while the latter provided values similar to those required by the enforce Italian Sesimic Code (TRD,SL) for the new buildings [29, 30], and thus a safer condition.
CONCLUSION
The aim of this work was to calibrate a procedure in order to obtain fragility curves when a single building is analyzed and then to evaluate its seismic risk for different LS. In particular, the study aimed at investigating how the structure is capable to withstand unexpected events of extreme intensities, or multiple events unexpectedly occurring together. The methodology fits the definition of robustness by measuring the capacity reserves that the structure is able to exhibit, beyond the local (conventionally set by structural codes) damage mechanisms, up to their propagation into a global failure mechanism.
With this aim, different natural ground motions and numerical models of a reinforced concrete precast industrial building were considered, in order to fit the epistemic and aleatory uncertainties that affect the evaluation of the structural response. Differently, the mechanical parameters considered were deterministic.
Both pushover and incremental nonlinear dynamic analyses were performed. The former was performed in order to establish the LS thresholds for the three considered damage states: the limited damage (LD), several damages (SD) and near collapse (NC). The latter was performed to better understand the structural response under increasing level of seismic intensity, taking into account the cyclic behaviour of the elements (columns, beams, and joint connections).
The main results highlight the primary role played by connections between the elements, which is the critical aspect for the seismic upgrade of the existing precast RC structures. Retrofitting intervention on dowel pin connection is useful only to avoid global mechanism due to loss of support between the beam and column, and not for fulfilling the request for the LD limit state. Furthermore, the mechanical slenderness of the columns can influence the overall response of the buildings only when the connections are upgraded.
The main idea is that fragility assessment can be adopted as a quantifiable indicator able to appreciate the urgency of retrofit operations on the existing structures, more reliably than vulnerability. In fact, this approach can be effectively adopted for portfolios of existing structures, to prioritize and to tailor retrofitting interventions, aimed at maximizing the overall risk mitigation with limited economic resources.
LIST OF ABBREVIATIONS
| RC | Reinforced Concrete |
| IPB | Industrial Precast Building |
| IDAs | Incremental Nonlinear Dynamic Analyses |
| LS | Limit State |
| LD | Limited Damage |
| SD | Significant Damage |
| NC | Near Collapse |
| IDR | Inter-Storey Drift Ratio |
| PSHA | Probabilistic Seismic Hazard Assessment |
| GM | Ground Motion |
| NM | Numerical Model |
| DP | Dowel Pin |
| KL | Knowledge Level |
| CF | Confidence Factor |
| IM | Intensity Measure |
| DM | Damage Measure |
| PGA | Peak Ground Acceleration |
| IA | Arias Intensity |
| IH | Housner Intensity |
| PGV | Peak Ground Velocity |
| CDF | Cumulative Distribution Function. |
CONSENT FOR PUBLICATION
Not applicable.
CONFLICT OF INTEREST
The authors declare no conflict of interest, financial or otherwise.
ACKNOWLEDGEMENTS
Declared none.


