All published articles of this journal are available on ScienceDirect.
Experimental Study on Calculation Methods for Short-term Cracks in High-strength Reinforced Concrete Beams
Abstract
High-strength steel has increasingly become widely used among various engineering practices, but the relevant provisions of the codes lag behind its development. Six sets of experiments on simple supported beams reinforced with HTB600 and HTB700 rebars subject to bending loading were conducted in this study to 1) investigate the conditions of crack development, 2) contrast the calculating modes of short-term crack width between Chinese and European concrete codes, and 3) analyze European applicability and precision pertaining to high-strength reinforcement of beams. According to the experiments and research, when the calculation formulae obtained from Chinese codes were used to calculate the average crack spacing of high-strength reinforced concrete beams, the error relative to that obtained in the experiment reached approximately 20%. Based on this, a revised formula for the calculation of average crack spacing is proposed in this article, and the results of these calculations align with the results obtained from the experiment. In addition, this study also demonstrates that the maximum cracking spacing calculated by adhering to Eurocode standards yielded no significant deviation as compared to the experimental results. However, owing to a difference in the crack width exceeding 20% being observed between the results obtained under Eurocode standards and the experimental results, the calculation methods need to be further improved for better applicability of high-strength reinforced rebars.
1. INTRODUCTION
High-strength rebars with high strength, good ductility, and low carbon content could reduce steel consumption in concrete structures and help solve congestion problems at the joints, thereby making the design more flexible. High-strength rebars, which mainly consist of 500 MPa grade rebars, are currently widely used in many developed countries. China has also increased the relevant provisions of HRB500 rebars in the “Code for design of concrete structures” (GB50010-2010) [1], but the calculation methods for higher strength rebars requires further study.
Beginning approximately one hundred years ago, the earliest product of reinforced concrete was manufactured and used in structural engineering; currently, reinforced concrete structures are the most widely used structures in structural engineering all over the world. Scholars from many countries carried out systematic studies on mechanisms and influencing factors of concrete structural cracking, and they proposed various formulae such as the bond-and-slip method and the non-slip method. The calculating modes of crack width under Chinese and European concrete codes are both based on the bond-and-slip method, so there are many similarities between the two. Performing experiments on simple support beams reinforced with HTB600 and HTB700 rebars subject to bending loading, and reviewing relevant references, allowed for thorough analysis and a comparison between crack width calculating methods provided in Chinese and European codes with regard to high-strength reinforced rebars. To conclude, verification of the methods used, their accuracy, and amendments are provided in this paper.
2. EXPERIMENTAL INTRODUCTION
2.1. Specimen Design
Eighteen beams were designed, with the size of the beam as follows: 1800 mm × 300 mm × 150 mm; the beam spanned 1500 mm. The maximum load of the test machine was set to 4000 kN to meet the test requirements. The tests included varying grades of steel, and varying reinforcement ratios for the concrete beams. There were two reinforcement ratios, 0.6% and 1.0%; three types of rebars, HRB400, HTB600, and HTB700; and two types of concrete, C40 and C60. The specimen number for each group is shown in Table 1.
| Number | Kind of Steel | Concrete type | fcuo | Tensile Reinforcement | Ratio | Quantity |
|---|---|---|---|---|---|---|
| 4C406 | HRB400 | C40 | 48.2 MPa | 2 12 mm | 0.56% | 3 |
| 6C406 | HTB600 | C40 | 48.2 MPa | 2 12 mm | 0.56% | 3 |
| 7C406 | HTB700 | C40 | 44.1 MPa | 2 12 mm | 0.56% | 3 |
| 7C410 | HTB700 | C40 | 44.1 MPa | 2 16 mm | 1.00% | 3 |
| 7C606 | HTB700 | C60 | 67.0 MPa | 2 12 mm | 0.56% | 3 |
| 7C610 | HTB700 | C60 | 67.0 MPa | 2 16 mm | 1.00% | 3 |
Specimen Number Description; take “4C406” as an example: the first “4” represents the rebar type, which is the HRB400 rebar; “C4” represents the concrete label, which is C40; and “06” represents the reinforcement ratio, which is 0.6%.
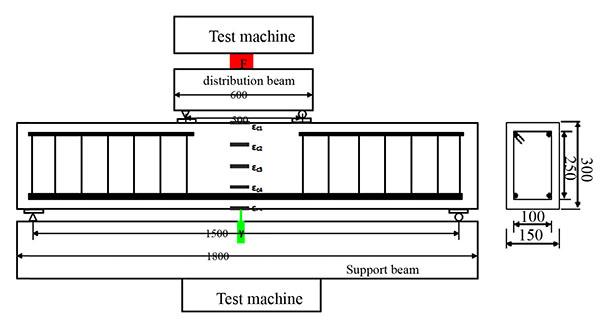
Reinforced concrete specimens are shown in Fig. (1). As a result of using two tensile reinforcements and two structural reinforcements, the pure bending segment of the middle compression area was not reinforced. The stirrups using 6 mm diameter HRB400 reinforcement had a concrete cover thickness of 25 mm. The actual ratios of the reinforcement beams are shown in Table 1, and the reinforced parameters are shown in Table 2. The tests were proceeded subsequently to cure the specimens for 28 days; the surface of the specimens was then whitened and 50 mm grids were drawn to observe the crack.
| Reinforced type | Diameter /mm | fy /MPa | fst /MPa | Elastic Modulus /GPa | Elongation /% |
|---|---|---|---|---|---|
| HRB400 | 12 | 433 | 594 | 199.3 | 13.7 |
| HTB600 | 12 | 614 | 760 | 199.9 | 10.6 |
| HTB700 | 12 | 786 | 951 | 201.3 | 6.9 |
| HTB700 | 16 | 759 | 903 | 199.4 | 7.1 |
| HRB400 | 6 | 485(σ0.2) | 541 | 198.6 | 2.5 |
2.2. Loading and Measuring Methods
The test loads at three equal diversion points in the loading method are shown in Fig. (1). A classification method of continuous loading until specimen destruction was applied to evaluate the loading process as according to the “Standard for test method of concrete structures” (GB/T50152-2012) [2]. There were five strain gauges on the concrete surface, arranged from the upper surface to the lower surface in the mid-span position, to measure the strain along the height of the concrete surface. There were two strain gauges on each tensile reinforcement to measure the strain of the rebar in the mid-span position. Additionally, the force sensor (F) was fixed onto the allocation distribution beam to measure the total load. The loading method and measuring point layout diagram are shown in Fig. (1). The crack widths on the surface of the specimens were measured via a crack width-measuring instrument with an accuracy of 0.02 mm and a maximum measuring range of 2 mm.
2.3. Experimental Process and Results
At the stage of initial loading, the bending moment is minimized, the strain distributes linearly onto the section, the stress on the concrete is proportional to its strain, and the load-deflection curve is linear. As the elastic modulus of reinforcements is larger than that of unreinforced concrete, the axis of neutrality is comparatively lower. When loaded from 0.2 Fy to 0.3 Fy, the bending moment reached the cracking moment, resulting in initiation of a visible crack at the weakest section. As the bending moment increased gradually, the existing crack expanded and extended upward and new cracks appeared. The slope of the load-deflection curve was significantly smaller than that before cracking, and the axis of neutrality rose to a higher point. When the tensile reinforcement reached the yield strength, the crack width increased rapidly and the load-deflection curve tended to plateau.
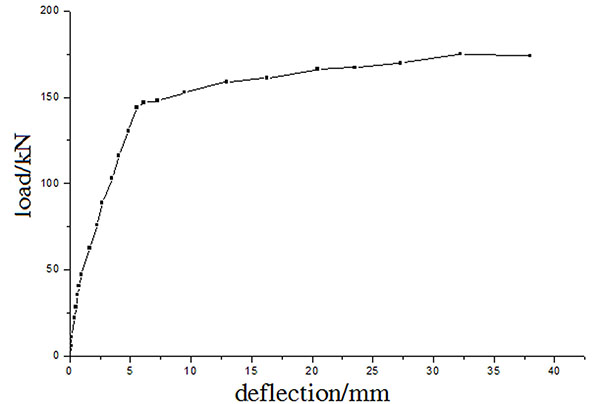
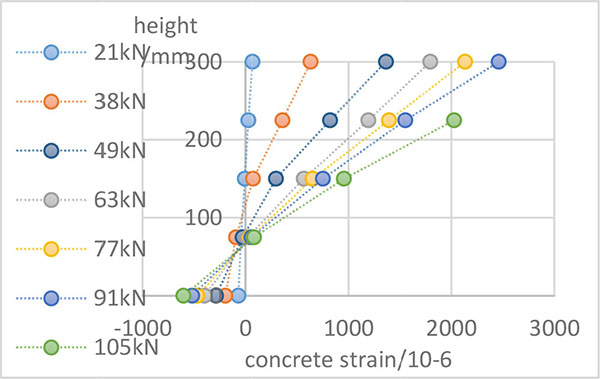
The experimental results demonstrate that the load-deflection relationship and the crack development of reinforced concrete beams with HTB600 and HTB700 rebars are similar to those of ordinary reinforced concrete beams, as shown in Figs. (2 and 4). The beam section followed the hypothesis of the plane section, and the axis of neutrality rose as the load increased. A typical concrete strain distribution curve is shown in Fig. (3).

The average crack width of the three specimens under the same loading level was calculated, and the load-average crack width curves are shown in Figs. (5 and 6). It can be observed from the curves in the figures that the relationship between the crack width and the load (bending moment) was approximately linear, and that the crack width increased proportionally with load increase.
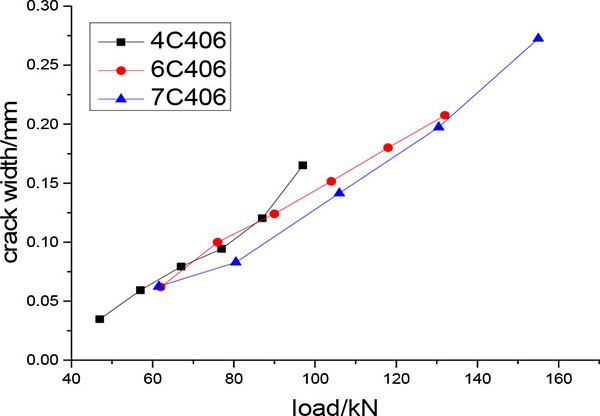
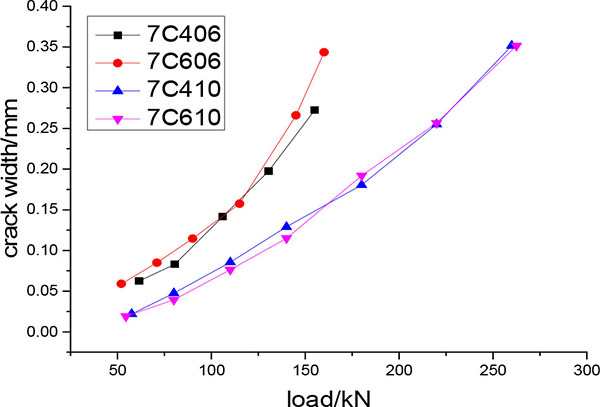
The curves in Fig. (5) suggest that when the concrete strength and reinforcement ratio are equivalent, the strength of the steel has a small impact on crack width. The results are as follows: at the same load level, the crack width decreases with the increase of steel strength. In addition, the curves in Fig. (6) illustrate that when the steel strength grade is the same, under the same load level, crack width and the reinforcement ratio possess an inversely proportional relationship; however, the concrete strength grade has no effect on the width of the crack. Crack spacing following completion of crack propagation and maximum crack width when F≈0.5 Fs are provided in Table 3.
| Number |
lot (mm) |
Str,max (mm) |
F (kN) |
ωtmax (mm) |
Number |
lot (mm) |
Str,max (mm) |
F (kN) |
ωtmax (mm) |
|---|---|---|---|---|---|---|---|---|---|
| 4C406J1 | 107.5 | 166.0 | 54 | 0.08 | 7C606J2 | 80.25 | 175.0 | 70 | 0.17 |
| 4C406J2 | 121.3 | 183.0 | 58 | 0.13 | 7C606J3 | 94.5 | 135.0 | 72 | 0.12 |
| 4C406J3 | 106.3 | 183.0 | 59 | 0.14 | 7C410J1 | 96.9 | 180.0 | 140 | 0.24 |
| 6C406J2 | 109.4 | 193.0 | 77 | 0.20 | 7C410J2 | 117.5 | 240.0 | 140 | 0.26 |
| 6C406J3 | 104.5 | 155.0 | 75 | 0.18 | 7C410J3 | 88.9 | 140.0 | 140 | 0.20 |
| 7C406J1 | 96.6 | 160.0 | 64 | 0.10 | 7C610J1 | 119.1 | 190.0 | 140 | 0.30 |
| 7C406J2 | 84.0 | 122.0 | 79 | 0.24 | 7C610J2 | 99.6 | 175.0 | 140 | 0.14 |
| 7C406J3 | 100.0 | 188.0 | 95 | 0.36 | 7C610J3 | 109.58 | 140.0 | 140 | 0.38 |
| 7C606J1 | 100.4 | 160.0 | 90 | 0.20 |
3. THEORETICAL CALCULATION
3.1. Chinese Code (GB 50010-2010)
This code [2] is based on the bond-and-slip method and statistics of experimental data, for which the statistic value with 95% probability is taken as the maximum crack width. It first mandates calculation of the average crack spacing and average crack width, with the short-term maximum crack width being calculated using the following formulae:
 |
(1) |
 |
(2) |
 |
(3) |
 |
(4) |
 |
(5) |
where ωm is short-term crack width; τs is the short-term crack width expansion coefficient; αc is the coefficient regarding the influence of tensile strain on the concrete between adjacent cracks; ψ is the non-uniformity coefficient of tensile strain on the reinforcement between adjacent cracks; lcr is the average space of cracks; Es is the elastic modulus of the reinforcement; cs is the distance from the bottom of the tension zone in the section to the outer edge of reinforcement of the outer layer; dea is the representative diameter of tensile reinforcements; ρte is the reinforcement calculated from the effective area of the tension zone, with ρte = 0.01 when ρte < 0.01; M is the bending moment; As is the tensile reinforcement area; and ho is the effective height of the section.
3.2. European Code (EN 1992-1-1:2004)
This code [3] is also based on the bond-and-slip method. It first mandates calculation of the maximum crack spacing Sr.max and the difference between the reinforcement strain and the tensile strain of the concrete between adjacent cracks, and then the two are multiplied to obtain the characteristic crack width:
 |
(6) |
 |
where εsm is the average strain on the reinforcement under the applied load combination; εcm is the average strain of the concrete between adjacent cracks; σs is the stress on the tensile reinforcement of a cracked section; κt is the coefficient that varies according to the duration of the load, where κt = 0.6 under short-term load; fct.eff is the average tensile strength of the concrete immediately prior to crack formation; ρp.eff is the effective reinforcement ratio; αe is the ratio of the elastic modulus of the reinforcement to the elastic modulus of concrete; d is the diameter of the reinforcement; k1 is the coefficient of bond characteristics, where 0.8 and 1.6 are deformed reinforcement and plain reinforcement, respectively; k2 is the coefficient representing strain distribution, where k1 = 0.5 for bending components; k3 and k4 are constants, where the recommended values are 3.4 and 0.425, respectively; and h is section height.
The main similarities and differences between Chinese and European codes can be understood from the above formulas. The similarities include: 1) both codes apply the bond-and-slip method, 2) the crack width is calculated as a factor of the crack spacing, and 3) the factors under consideration are nearly equivalent. The main difference between the two is that the Chinese code mandates calculation of the average crack width as a factor of average crack spacing thereby obtaining the maximum crack width, while not taking into consideration the spacing of the tensile reinforcement, whereas the European code mandates calculation of characteristic crack width as a factor of maximum crack spacing, which takes into account the spacing of the tensile reinforcement [3].
4. ACCURACY COMPARISON
4.1. Calculation of Crack Spacing
The ratio of average crack spacing of the beams calculated in accordance with the Chinese code and the experimental results are shown in Table 4. The results demonstrate that the experimental value lot is generally smaller than the calculated value lo1, the average of the ratio of the two is 0.766, and the coefficient of variation is 0.152. In addition, experimental results observed in previous studies [4-6] containing 7,400 MPa beams, 12,500 MPa beams, 10,600 MPa beams, and 12,700 MPa beams, are summarized and the results are shown in Table 4.
| Category | lot / lo1 | lot / lo2 | Str.max / S1r.max | ||||||
|---|---|---|---|---|---|---|---|---|---|
| μ | δ | Quantity | μ | δ | Quantity | μ | δ | Quantity | |
| Experiment | 0.766 | 0.161 | 17 | 0.958 | 0.152 | 17 | 0.952 | 0.204 | 17 |
| Reference 4 | 0.895 | 0.156 | 8 | 1.096 | 0.166 | 8 | - | - | - |
| Reference 5 | 0.852 | 0.086 | 8 | 1.068 | 0.088 | 8 | 1.17 | 0.147 | 8 |
| Reference 6 | 0.752 | 0.032 | 8 | 0.904 | 0.018 | 8 | - | - | - |
| Sum | 0.805 | 0.146 | 41 | 0.996 | 0.146 | 41 | 1.02 | 0.214 | 25 |
The data in Table 4 indicate that when using the calculation formula of the Chinese code to calculate average crack spacing of high-strength reinforced concrete beams, the error reaches 20%. Y. Zhao [7] suggested that the calculation mode of average crack spacing obtained via adherence to the Chinese code is still effective in high-strength reinforcement. The average crack spacing yielded a positive relationship with the thickness of the concrete cover c and the coefficient of reinforcement dea/ρte, thereby suggesting that the coefficients in the formula merely need to be modified. SPSS software was used to carry out binary linear regression on the above experimental data, and the regression formula is provided as follows for the average crack spacing of high-strength reinforced beams:
 |
(7) |
The ratios of experimental values lot to calculated values lo2 of the modified formula (7) are shown in Table 4. The average of the ratio was found to be 0.996 and the coefficient of variation was 0.146, thus suggesting that modifying the formula yielded a significant improvement in comparative results.
The European code also considers the effects on crack spacing, but it applies the maximum crack Str.max spacing instead of the average crack spacing. The ratios of experimental values Str.max to calculated values S1r.max are provided in Table 4. The table shows that the two values are nearly equivalent; this indicates that the formula for maximum crack spacing that is mandated in European code is still applicable and sufficient to apply to high-strength reinforced concrete beams.
4.2. Calculation of Maximum Crack Width
Formulas mandated for use by the Chinese code, the modified version of those formulas, and the formulas mandated for use by the European code were used to calculate the maximum crack width of experimental beams in this article. Comparisons between the two codes, and additionally to results from previous studies [4, 5], were also performed. A total of 151 sets of calculated values for ω1max, ω2max, and ω1k were obtained, and the ratios of the experimental values ωtmax to the calculated values are provided in Table 5.
| Category | ωtmax / ω1max | ωtmax / ω2max | ωtmax / ω1k | ||||||
|---|---|---|---|---|---|---|---|---|---|
| μ | δ | Quantity | μ | δ | Quantity | μ | δ | Quantity | |
| Experiment | 0.955 | 0.256 | 92 | 0.981 | 0.253 | 92 | 1.217 | 0.318 | 92 |
| Reference 4 | 0.893 | 0.143 | 22 | 0.898 | 0.144 | 22 | 1.151 | 0.215 | 22 |
| Reference 5 | 0.939 | 0.175 | 37 | 0.963 | 0.164 | 37 | 1.467 | 0.212 | 37 |
| Sum | 0.942 | 0.226 | 151 | 0.965 | 0.224 | 151 | 1.269 | 0.348 | 151 |
It can be observed from the data in Table 5, that for the high-strength reinforced concrete beams the formulae for maximum crack width obtained from the Chinese code demonstrate no significant deviation from the experimental results, and that the modified formulae developed during this study yield further improvement, but, as compared to experimental values, the calculated values obtained from application of the formulae mandated by the European code yielded a maximal difference of approximately 20%, with the experimental values being larger.
CONCLUSION
This study, through the bending experiment of high-strength reinforced concrete beams with HTB600 and HTB700 rebars, investigated the conditions of crack development and compared the subsequent results, as well as the accuracy of the calculation methods used to determine maximum crack width, of formulae mandated by Chinese code and European code. The main conclusions are as follows:
- Crack development rules regarding reinforced concrete beams with HTB600 and HTB700 rebars are similar to those of ordinary reinforced concrete beams in that the crack width possesses an approximately linear and directly proportional relationship with load bearing (bending moment). At the same load level, the crack width and the reinforcement ratio possess an inversely proportional relationship; however, the concrete strength grade has no effect on the width of the crack.
- The calculated values of average crack spacing obtained from formulae provided by Chinese code were found to be significantly larger than the experimental values, but the calculated values of the modified formulae developed during this study were found to be congruent with the experimental values. Furthermore, the modified formula applied to determine maximum crack width was found to be more accurate than the original formula and thus more suitable for the calculation of high-strength reinforced concrete beams.
- The calculated values of maximum crack spacing obtained from formulae provided by European code were consistent with the observed results. However, significant error existed between the calculated values and the experimental values of the characteristic crack width; therefore, these formulae were found to be unsuitable for the calculation of crack width in high-strength reinforced concrete beams.
CONFLICT OF INTEREST
The authors confirm that this article content has no conflict of interest.
ACKNOWLEDGEMENTS
Declared none.


