All published articles of this journal are available on ScienceDirect.

The Analysis of the Water Resource Carrying Capacity in the Shale and Gas Exploration Area, Southwest China Karst Region ‒ A Case Study from Cenggong County
Authors Info & Affiliations
Abstract
Introduction:
As an unconventional natural gas resource, shale gas is the current hot topic in the oil and gas industry. China is rich in shale gas resource, most of which lies in the Southwest Karst Area with its fragile ecological environment.
Discussion:
The following questions must be studied before exploration thereof: on one hand, shale gas mining requires a lot of water, on the other hand, if the karst region water resources can support shale gas mining over a large area, and if the consequent water/environmental pollution problems will bring more severe challenges to the sustainable development of society and the economy in the southwest karst area, there is a potential conflict requiring a research-based resolution. The water resource carrying capacity is an important measure of the potential sustainable development of a karst region, with its unique geological structure and fragile natural landscape. Therefore, the study of karst water resource carrying capacity is of great significance.
Conclusion:
This essay is based on Cenggong County, one of the five key shale gas exploration areas in Guizhou at the end of 2012. By calculating the water resource carrying capacity in the studied area with the help of the ecological footprint method, it is concluded that the existing water resources in the studied area can support shale gas exploration. However, shale gas mining will cause a change in the industrial structure within the region. In addition, it has significant effects on the bearing capacity of water resources in the ecological environment.
1. PREFACE
As an important unconventional natural resources, shale gas is an important clean energy source, and is also the current focus of the oil and gas industry; however with the exploitation and utilisation of shale gas, serious environmental problems, such as the consumption of large amounts of water resource, pollution of groundwater, surface water pollution, treatment and disposal of liquid returns, etc., have caused widespread debate [1-3]. In China, shale gas reserves are abundant, according to the evaluated shale gas resource potential and favourable areas preferred in key areas of China. In 2012, within the land area of China, recoverable resources may reach approximately 25.08 trillion cubic metres (not including the Qinghai Tibet region), more than conventional natural gas resources, which are mostly located in Sichuan, Chongqing, Guizhou, and other places. However, Sichuan, Chongqing, Guizhou are environmentally fragile areas, and the southwest karst area, because of its special hydrogeological conditions of underground holes and inter-linked caverns, has a hydrology subject to dynamic changes, surface water leakage, thin soil, difficulties with regard to vegetation growth, and significant soil erosion, resulting in a hot, humid, climate characteristic of karst drought-prone regions [4]. Shale gas mining needs to consume a large amount of water [5], whether water resources in karst areas can support a large area of shale gas exploitation, whether the ensuing problems of water/environmental pollution will bring more severe challenges to sustainable development in the southwest karst area, are problems that must be studied before mining begins. Therefore, this paper intends to study the water resources carrying capacity of shale gas mining in this karst area, and the research results will help to protect and best utilise the water resources in the shale gas production area.
Shale gas resources are abundant in Guizhou Province: proven reserves are 13.54 trillion cubic metres, which rank third in China. In this paper, the author will take the Cengong block, one of the five key areas of shale gas mining by the end of 2012 in Guizhou Province, as the object of study, and refer to the research achievements and management experience of the water/environment impact in the process of shale gas development in the United States, Canada, and other countries, and take shale gas development and construction of regional water resources demand and its impact as its focus. Combined with the characteristics of the karst groundwater system in Guizhou, evaluative research of the water resource carrying capacity of shale gas regions in the Karst area is established to analyse water resources carrying capacity in the development of shale gas in Karst Area, so as to offer a reference and suggestion for the study of the water resources carrying capacity of shale gas works in the region.
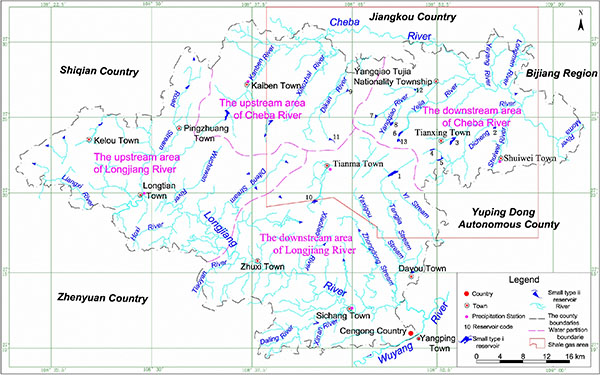
2. OVERVIEW OF THE STUDY AREA
Cengong County is located in the eastern part of Guizhou Province, lying between 108° 20′ to 109° 03′ E and 27° 09′ to 27° 32′ N. Its borders include Yuping in the east, Zhenyuan in the south, Shiqian in the west, and Tongren and Jiangkou in the north; it is 68.5 km from east to west and 41 km from south to north. It occupies a land area of 1486.5 km2. The population of the county is 229,300, among which the rural population is 209,560, and the non-rural population is 19,774. The arable land area is 175,620 mu, with a forest coverage reaching 50.35%; the net income per rural inhabitant is ¥2,435 p.a., and the disposable income of each farm is, on average, ¥2,261 p.a. which forms the main economic source, in the area, of typical agricultural output value.
The river systems in this area belong to the Wuyang River system in Yuanjiang in the Yangtze River basin, among which the northern river system belongs to the primary branch of the river dam of the left bank of the Wuyang River, and the southern river system belongs to the primary tributaries of Longjiang River on the left bank of the Wuyang River. The average annual rainfall is 1.78 billion cubic metres, the county’s average annual rainfall in the years studied was 1,198.1 mm, and the precipitation variation coefficient is 0.17; there is a high change in the yearly precipitation, an uneven spatial and temporal distribution of rainfall, making the winter and spring drought in the study area affect the levels of guaranteed water standards.
The average depth of the runoff in this area is 500-600 mm in these years, and it increased from south to north, the central area runoff reaching about 550 mm. The variation coefficient of the runoff is 0.28-0.38, and the central area runoff is 0.3-0.32. The runoff coefficient in this region is 0.46-0.48; in these years, the average dry day modulus of 50% regional groundwater is 3~4 l/km, according to the analysis of the daily variation coefficient 0.4 (Cs/Cv = 2.5), 90% and 95% dry day moduli are2.06 L/km2 and 1.77 L/km2.
There are many water storage projects in the area (Table 1 summarises the situation and water supply volumes of the main reservoir near the Core area of shale gas block).
| No. | Reservoir | Storage factor | Water utilisation coefficient α |
Annual water supply capacity(104 m3) | ||||
|---|---|---|---|---|---|---|---|---|
| Β | P = 50% | P = 75% | P = 95% | P = 50% | P = 75% | P = 95% | ||
| 1 | Jia-long Tang reservoir | 0.92 | 1.23 | 0.96 | 0.57 | 185 | 145 | 86 |
| 2 | TianLuTang reservoir | 1.27 | 1.34 | 1.08 | 0.59 | 8 | 7 | 4 |
| 3 | DaHePing reservoir | 0.37 | 0.85 | 0.67 | 0.46 | 190 | 149 | 103 |
| 4 | GanXiGou | 0.43 | 0.92 | 0.7 | 0.48 | 91 | 69 | 47 |
| 5 | LengXi reservoir | 0.39 | 0.87 | 0.68 | 0.47 | 94 | 74 | 51 |
| 6 | BoYangGou reservoir | 0.52 | 0.95 | 0.73 | 0.5 | 148 | 114 | 78 |
| 7 | ZhaoPing reservoir | 0.25 | 0.71 | 0.52 | 0.39 | 183 | 134 | 100 |
| 8 | YaoZhai reservoir | 0.68 | 1.02 | 0.78 | 0.53 | 60 | 46 | 31 |
| 9 | MiaoChong reservoir | 0.05 | 0.32 | 0.19 | 0.14 | 699 | 415 | 306 |
| 10 | GuanYan reservoir | 1.05 | 1.25 | 0.98 | 0.58 | 63 | 49 | 29 |
| 11 | KaMenBian reservoir | 0.31 | 0.76 | 0.6 | 0.4 | 12 | 10 | 6 |
| 12 | YouZhaWan reservoir | 0.12 | 0.47 | 0.36 | 0.25 | 43 | 33 | 23 |
| 13 | YinJiaTian reservoir | 0.48 | 0.95 | 0.72 | 0.49 | 51 | 38 | 26 |
3. ANALYSIS OF WATER RESOURCE CARRYING CAPACITY
3.1. Concepts and Features of Karst Water Resource Carrying Capacity
WRCC is the natural combination of the bearing capacity concept and water resources engineering; because of the complexity, randomness, and fuzziness of water resources system (Fig. 1) and the multi-faceted, heirarchical nature of factors that affect the carrying capacity of water resources, there is still no uniformly accepted definition of water resources carrying capacity, and many scholars have put forward their own ideas from different research angles [6]. Many researchers such as Deng Huan [8], and He Zhonghua [7] have undertaken research into the water resource carrying capacity in karst areas. In view of the temporal and spatial differences, dynamic, fuzzy and controllable factors [8-10] affecting the water resources carrying capacity in karst areas, and current thinking about the two characteristics of Karst Area – socio-economic (relative lag) and ecological environment (relative vulnerability) – the author defined the water resources carrying capacity in a karst area as follows: under the premise of the sustainable development of the environment in karst areas, based on the predictable technological level of socio-economic development, in the karst area, the rate of ecological restoration (both artificial control and self-restoration) does not restrict its current social development and as a condition, it offers the maximum support capacity for the socio-economic development in the karst area by optimising the allocation of water resources most reasonably.
3.2. Research Method
The research object is to find the water resources carrying capacity of a karst region: the traditional method of analysing the carrying capacity of water resources entails: background analysis method, general trend method [11-15], multi-index comprehensive evaluation method, fuzzy evaluation [16-18], extension matter element model [19], principal component analysis [20-22], data envelope analysis models, grey evaluation models, etc. In addition, the application of a new method in the research field of water resource carrying capacity has been promoted and developed, such as artificial neural networks (ANN) [17, 23, 24], projection pursuit evaluation models [25, 26], the maximum information entropy principle [27], and the ecological footprint method [28-33], etc. Through comparative analysis, the ecological footprint method can estimate human occupation of natural assets and the comprehensive carrying capacity of the study area. It can also be used to estimate the degree of human development and utilisation of water resources as well as the capacity of water resources to carry the “natural and socio-economic environment” system, and measure whether, or not, the development and utilisation of water resources are within the range of the ecosystem’s carrying capacity, by using the specific biological and physical indicators. The method is comprehensive (including: the image of the concept, the richness of connotation, strong operability and perspective of the novel, global comparability, etc.), which accords with the idea of sustainable development in karst areas [8, 14, 28]. Therefore, this paper uses the ecological footprint method to analyse the water resources carrying capacity in the study area.
3.3. Calculation of Karst Water Resources Carrying Capacity and Eco-footprint
According to ecological footprint theory, the biological production capacity of water resources is used to measure the water resources carrying capacity, that is, the corresponding biological survival area that the water resources can carry [34]. The ecological footprint of water resources can be defined as: the water footprint of any given population (a person, a city, a region, or globally) is the amount of water required to produce all the resources (including the direct consumption of water resources and environmental resources for human life to provide ecosystem services and functions) consumed by these people [35, 36].
The calculation model of water resources carrying capacity [12] is:
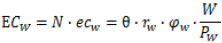 |
(1) |
The calculation model of ecological footprint of water resources [12] is:
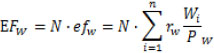 |
(2) |
Where: ECw is the total ecological carrying capacity of water resources, N is the population, ecw is the per capita water resources, θ is the degree of water resource utilisation, is the global balance factor of water resources, is the land production factor of water resources in the area, W is the total amount of water resource (m3), where the total amount of water resources is the sum of the amount of water resource and groundwater resources in the area of the region. The total amount of water resources is the sum of the amount of water resources and groundwater resources in the area of the region, from which we should deduct the amount of repeated calculations; Pw is the average production capacity of the global water resources (m3∙hm-2), EFw is the total ecological footprint of the karst water resources, efw is the ecological footprint (per capita) of water resources in a karst area, and Wi is the consumption of various types of water resource (m3).
According to Wackernagle’s ecological footprint model, we established five secondary accounts of the water resource ecological footprint: agricultural water, industrial water, urban public water, domestic water, and environmental water. Agricultural water, including irrigation water and Lin Muyu livestock water; industrial water, mainly referring to the water used in industrial production processes; urban public water, mainly referring to the construction industry and service industry water; domestic water, including urban domestic water and rural domestic water (drinking water is included except for resident demand for essential water); and ecological water use, including urban green space water and water consumption of dilute pollutants beyond water pollutant capacity in the region (including urban environmental water and rural ecological water use), are calculated as follows:
 |
(3) |
 |
(4) |
 |
(5) |
 |
(6) |
 |
(7) |
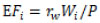
Where: EFa is the ecological footprint of agricultural water, Wa is the agricultural water consumption, EFi is industrial water ecological footprint, Wi is industrial water consumption, EFc is the ecological footprint of urban public water, Wc is urban public water consumption, EFl is the ecological footprint of domestic water, Wl is domestic consumption, EFe is the ecological footprint ecological environment water, and We is water used for environmental production.
3.4. Water Resource Load Index Calculation
The physical meaning of the water resource load index is the relationship between regional water resources and water resources demand determined by population and GDP, which reflects the relationship between the utilisation level of regional water resources, population and economic development, and to a certain extent, it reflects the difficulties facing water resources development in the future, and includes a description of the development and utilisation prospects of regional water resources. It divided the water resources load index into five levels (Table 2); the computation formula is as follows [29]:
| Water load index | Level | The degree of water resource utilization | Water resources development further evaluation in the future |
|---|---|---|---|
| >10 | I | Very high, small potential | Draw water diversion when conditional |
| 5~10 | II | High,small potential | Development difficult |
| 2~5 | III | Medium, potential | Medium |
| 1~2 | IV | The lower, high potential | More easily |
| <1 | V | Low,great potential | Development easy |
 |
(8) |
Where: c denotes the water resources load index; P is the population (million); G is the gross domestic product (¥100 million); W is the total amount of water resources (100 million m3); K is a coefficient related to rainfall with its value given, thus:
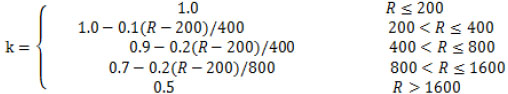 |
(9) |
Where: R is the annual precipitation (mm).
3.5. Data Sources and Parameter Values
The water resources, agricultural water, industrial water, living water, urban public water consumption, and ecological and environmental water data are taken from the 2004-2014 “Qiandongnan (Cengong County) Water Resources Bulletin”; the socio-economic data originated from the 2004-2014 “Yearbook of Qiandongnan Prefecture (Cengong County)”, and the data relating to cultivated land is derived from the Department of Land and Resources (Table 3).
| Project | 2004 | 2005 | 2006 | 2007 | 2008 | 2009 | 2010 | 2011 | 2012 | 2013 | 2014 |
|---|---|---|---|---|---|---|---|---|---|---|---|
| Population/104 person | 22.10 | 22.18 | 22.29 | 22.37 | 22.46 | 22.48 | 22.54 | 22.61 | 22.69 | 22.85 | 22.93 |
| GDP/108 RMB | 0.87 | 0.90 | 0.95 | 10.14 | 10.38 | 10.49 | 10.55 | 10.78 | 10.85 | 11.00 | 11.52 |
| Annual precipitation /mm | 1175.3 | 840.1 | 1206.9 | 1052.4 | 1145.1 | 1136.8 | 1239.4 | 1213.9 | 1097.3 | 1177.8 | 1466.7 |
| Arable land /104 hm2 | 2.15 | 2.20 | 2.24 | 2.24 | 2.29 | 2.36 | 2.43 | 2.50 | 2.55 | 2.55 | 2.53 |
| Total water resources/108 m3 | 7.584 | 7.582 | 7.582 | 7.585 | 7.582 | 7.582 | 7.582 | 7.582 | 7.582 | 7.582 | 7.582 |
| Agricultural water use /108 m3 | 0.4755 | 0.477 | 0.48 | 0.48 | 0.46 | 0.6 | 0.5 | 0.48 | 0.55 | 0.53 | 0.51 |
| Industrial water use /108 m3 | 0.0454 | 0.046 | 0.0465 | 0.0465 | 0.0467 | 0.0469 | 0.051 | 0.0515 | 0.0523 | 0.0537 | 0.0543 |
| Life water use/108m3 | 0.1436 | 0.144 | 0.1448 | 0.15 | 0.156 | 0.1567 | 0.162 | 0.173 | 0.168 | 0.17 | 0.185 |
| Urban public water use /108 m3 |
0.0997 | 0.114 | 0.146 | 0.1458 | 0.1358 | 0.1573 | 0.182 | 0.185 | 0.187 | 0.193 | 0.2145 |
| Environmental water use/108 m3 |
0.0045 | 0.071 | 0.072 | 0.075 | 0.072 | 0.078 | 0.0875 | 0.086 | 0.087 | 0.088 | 0.095 |
Water resources yield factor: to determine the different regional water resources yield factors, it is assumed that the world water resources yield factor is 1, the regional water resources yield factor is the ratio of the average production capacity of water resources in the region to the average production capacity of world water resources. It is calculated that the water resources yield factor of the study area is 1.6195.
Production capacity of water resources: the modulus of water in hydrology is used to describe the production capacity of water resources, and according to the literature, the average production capacity of water resources in the world is 31.4 × 10⁴ m3/km2 [12].
Global balance factor of water resources: the global balance factor of water resources is equal to the average ecological productivity of biological production area of water resources divided by the average ecological productivity of various biomass production areas in the world. For comparison, this study selects WWF2002 to determine the water balance factor as 5.19.
Degree of water resource utilisation: according to the results of the study, if the development and utilisation rate of water resources is more than 30 to 40% in a country or region, it may cause deterioration of the environment, therefore the water resources carrying capacity of a country or region must be reduced to 40% of that level to allow for the maintenance of the environment [12].
4. ANALYSIS
4.1. Water Bearing Capacity in the Area and Its Water Ecological Footprint
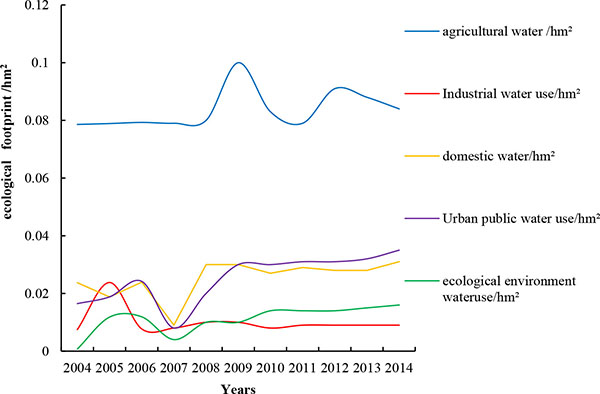
We calculated the ecological footprint of the water resources account in Cenggong County from 2004-2014 (Fig. 2) and included agricultural water, industrial water, urban public, domestic water, and environmental water to show that Cengong County’s agricultural water ecological footprint is much higher than that of the other four water accounts. It agrees with the fact that the research area is an agriculturally lead area. The water resources eco-footprint in Cengong County, from 2004 to 2014, increased. After 2009, the water footprint increased significantly. In addition to the increase in agricultural water use, sudden increase in industrial water use also occurred. Cengong County has developed agriculture as its main economic pillar with only slow industrial development. Since 2009, the industrial water footprint has been enlarged due to economic growth, the development of tourism, and shale gas exploration and drilling. At the same time, Guizhou Province suffered heavy snowfalls in 2008, which limited economic development. Compared with the other years, the total ecological footprint is 0.1439 hm2, which is far lower than the average ecological footprint of 0.1848 hm2. The essential (life) water ecological footprint increased slightly because of the increase in population. Ecological and environmental water eco-footprints have been stable, but increased slightly after 2012 because of pollution-driven increases in consumption as a result of the industrial water ecological footprint increasing.
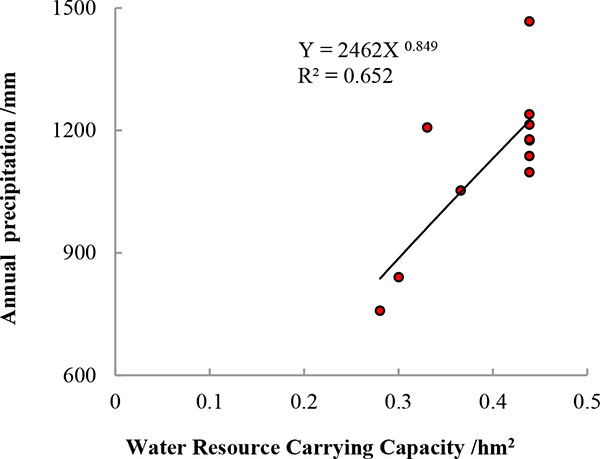
From 2004 to 2014, the overall water resources carrying capacity in Cengong County has been stable, except in 2008 with its lower value. The reason is that the area rainfall is stable in Cengong County, but it suffered from a severe drought and snow storms in Guizhou in 2008. At that time, the rainfall was only 758.1 mm, which was far less than in other years. Cengong’s regional water resources carrying capacity is closely related to precipitation (Fig. 3). The correlation coefficient between rainfall and the water resources carrying capacity in Cengong is 0.849. In general, Cengong County has seen rapid economic development from 2004 to 2014. Due to the increase in population, essential (life) water and industrial water consumption also increase. In recent coming years, because of the shale gas projects, the total ecological footprint will still increase in Cengong County. The government should increase availability of water resources through the construction of a water conservancy project and ensure water security while protecting the environment.
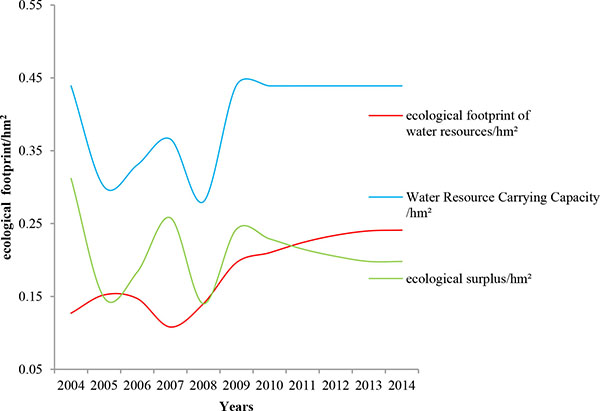
4.2. Ecological Surplus and Deficit of Water Resources in the Study Area
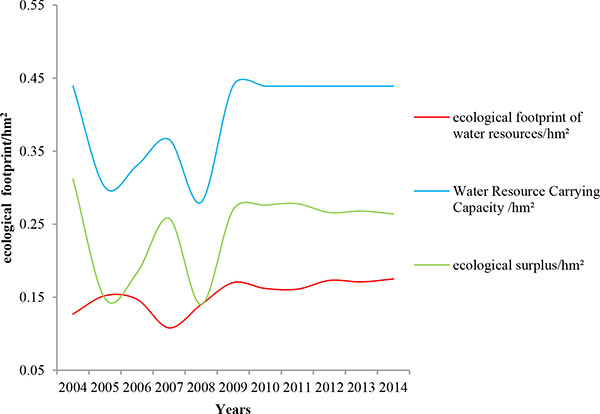
When the ecological carrying capacity in a region is less than the demand for ecological footprint, it goes into ecological deficit, and vice versa. Ecological deficit indicates that human pressure exceeds the ecological carrying capacity in the region, and that its regional development is relatively unsustainable. On the contrary, an ecological surplus indicates that the regional ecological carrying capacity meets the demand of current economic activity, and its regional ecological development is relatively sustainable. Compared with the ecological footprint of water resources and water resources carrying capacity in the studied area during 2004-2014, the total water resources carrying capacity is greater than the total ecological footprint of water resources, which shows that the studied area is in an ecological surplus (Fig. 4). In 2009, with the development of the local economy, water ecological surplus was in a relatively stable state. The reason was that the water and irrigation was solved in the studied area thanks to conservancy project construction and the increase in the number of wells driven. Ecological surplus changes are consistent with the changes in eco-footprint.
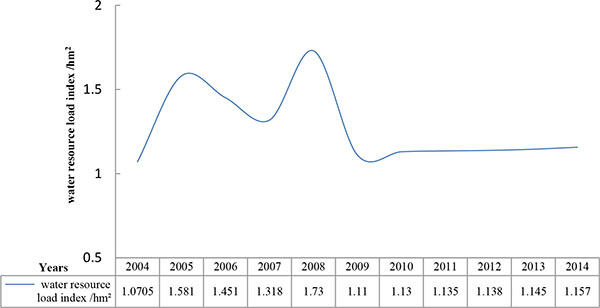
4.3. The Load Index
The load index of the regional water resource (Fig. 5) has been calculated as it is a comprehensive index of precipitation, population, economic scale, and total water resources. It comprehensively reflects the extent of the regional water resource. During 2004-2014, the water resource carrying index in the studied area was lower, with its higher load level (both level V) as well as having a lower level of development and utilisation of water resources. The water load index in 2008 was slightly higher than that post-2010 because of economic limitations, the small cultivated land area, and thus less agricultural water consumption. In 2009, the water load index rose because a water conservancy project had been started which increased the amount of available water. The total water resources in the studied area are rich with a low development and utilisation situation, but the development potential is large, thus, the efficiency of water resource development and utilisation should be strengthened and the available water resources should be improved.
4.4. Sensitivity Analysis: the Ecological Bearing Capacity of Water
During 2015-2016, about 30 horizontal wells and 10 vertical wells will be constructed in Cengong shale gas blocks. By 2020, it is expected to bring around 500 million cubic metres of gas. According to the experience in the United States, water demand for each horizontal well is about 20,000 m3 [3], of which 90% is used in the fracturing stages. Industrial water will be increased significantly in the studied area during 2015-2020. Now, we use the single index increase method-control variables. This means that by changing only one parameter value, a sensitivity analysis would be carried out on the water resources carrying capacity in the study area (Table 4).
| Project | 2009 | 2010 | 2011 | 2012 | 2013 | 2014 |
| Industrial water consumption(before)/108 m3 | 0.0469 | 0.051 | 0.0515 | 0.0523 | 0.0537 | 0.0543 |
| Industrial water consumption(after)/108 m3 | 0.0669 | 0.071 | 0.0715 | 0.0923 | 0.0937 | 0.095 |
Furthermore, the influence of the shale gas mining on ecological carrying capacity is studied according to the analysis of the mining situation over the years 2009 to 2014.
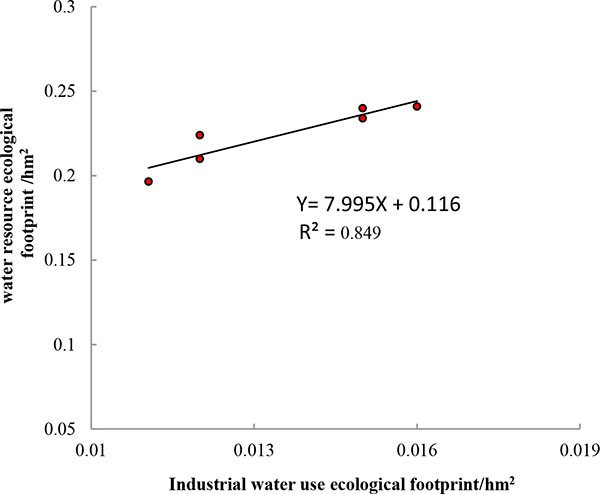
By increasing the use of industrial water, the ecological footprint of water resources in the study area increases. Ecological surplus has dropped significantly (Fig. 6). Fig. (7) shows that the water resources bearing capacity has a high susceptibility to industrial water demand, with a correlation coefficient reaching 0.92. Thus shale gas mining will cause an adjustment of the industrial structure in the study area, and it has a great influence on the environment as well. The studied area is a traditional agricultural production area, so agricultural irrigation water and drinking water for local residents must be secured before large-scale shale gas mining starts.
CONCLUSION
Shale gas mining poses challenges for regional water resources. Based on the theory of ecological footprint, this paper analyzed Cengong County’s water resources carrying capacity taking the typical shale gas development blocks therein as the study area. The results showed that:
- 1. Cengong County is abundant in water resources, but it has low utilisation efficiency thereof with development potential. In recent years, Cengong County has seen rapid economic development and an increasing population. As a result, a significant rise in the water resources eco-footprint in the study area was seen and the ecological surplus dropped significantly. At the same time, Cengong County’s water resources bearing capacity has a high susceptibility to industrial water demand, so it can be foreseeable that, with the mass production of shale gas, Cengong County’s water supply will be stressed. Considering this, Cengong County will further increase investment in water conservancy projects, and ensure the supply of water resources in the future. Because the study area is a karst mountain area, due to its particularity, the root cause of the “project” type water for water conveyance difficulty decides that development of decentralized water supply project is the only acceptable engineering measure, therefore this paper proposed to build water conservancy project; Secondly, strengthening the reflux water treatment put forward in this paper, collecting water recycle can further reduce water consumption greatly; Finally, enhancing residents' awareness of water saving and water recycling after shale gas exploitation may ensure to be a good strategy for water resource utilization.
- 2. Cengong County is a traditional agricultural production area: shale gas mining will cause industrial structural change in Cengong County, exerting a significant influence on the environment, and may even lead to serious ecological problems. Therefore, in the process of shale gas flow water treatment, new technologies must be introduced and the management of shale gas must be strengthened to ensure the sustainable utilisation of water resources.
In recent years, with the wider discoveries of shale gas resources in China, as a relatively clean energy, it will be developed with vigour. This paper analysed the relationship between the water resources carrying capacity and shale gas mining in the study area. The conclusions and methods can provide a reference for similar areas of research.
CONFLICT OF INTEREST
The authors confirm that this article content has no conflict of interest.
ACKNOWLEDGEMENTS
This research was supported by the Guizhou Province Geological Exploration Fund project: “Shale gas development and construction of the regional water demand models and its impact assessment”. The authors acknowledge the valuable correspondence with Dr B. Li. We acknowledge all the reviewers and editors of the journal for their valuable comments, suggestions and revisions, of this paper, which have greatly improved the original manuscript.

