All published articles of this journal are available on ScienceDirect.

Experimental Study of Triaxial Behavior of Concrete under Lateral Confining Stress
Abstract
Background:
Loads on most of reinforced and prestressed concrete structures, are triaxial. For the principled analysis and design of these structures, being aware of the concrete behavior under triaxial stress states is essential. Also studying the stress-strain curves under triaxial loads for nonlinear analysis and design of reinforced and prestressed concrete structures, is important.
Method:
In this study, for better comprehension of the behavior of confined concrete, the uniaxial and triaxial tests are performed on the cylindrical specimens and the relationship between axial stress, lateral confining stress, and uniaxial compressive strength, is calculated and compared to the proposed relationships of other researchers.
Results and Conclusion:
In addition, a comparison is made between the test results, the results of others in the literature and Attard [1] model.
1. INTRODUCTION
Most applied loads on the reinforced and prestressed concrete structures are triaxial. In order to accurately analyze and design these structures, it is needed to know the behavior of concrete in triaxial stress conditions [2]. Especially with the increased developments in computer finite element analysis capabilities, modeling of the mechanical behavior of concrete under triaxial stresses, to be used in the analysis of concrete structures, is of great importance. In addition, studying the complete stress-strain curves for concrete under multi-axial and triaxial loads for nonlinear analysis and design of reinforced and prestressed concrete structures is important [3].
Since the pioneering work of Richart [4] and after him, Balmer [5], many researchers have studied the confined behavior of concrete and proposed confinement models which took account of various parameters such as tie spacing, reinforcement, column shape and concrete strength [6]. Some of the researchers have been mentioned here: Hognestad [7], Popovics [8], Sargin [9], Sargin & Ghosh [10], Shin [11], Carreira [12], Cusson [13], Hoshikuma [14], Hsu [15], Razvi [16], Wee [17], Chung [18], Mander [19], Kotsovos [20], Newman [21], Chern [22], lmran [23], Lan [24], Li [25].
However, studies on the noted subject, especially in the recent decades, have been done on the principles of elasticity and plasticity. But no specified mathematical model which is valid in all loading conditions, has been developed. Similarly, current methods that are used in the design of concrete structures are based mainly on the characteristics obtained from the uniaxial testing of concrete strength. While, on the basis of today's concrete response under triaxial stress, with respect to what is observed in the uniaxial conditions, a significant difference is observed. It is expected that in future, the proposed models, especially in developing standard tests for concrete in various states of the stress, the triaxial stress conditions could be implemented in a way to form the basis of regulations. Studying the behavior of concrete under the triaxial stress conditions to achieve such criteria, is essential and this may be due to the concrete behavior, under various stress and laboratory conditions, which exhibits different behavior and shows sensitivity to the various parameters [2].
Over the past ninety years, many researchers have stated that when concrete is placed under the triaxial pressure, stress and strain it could withstand very large amounts. Table 1 illustrates the summary of triaxial experimental data of some researchers. Obviously, if such behavior is proven with good mathematical representation, the design stresses could be increased. In addition, designers can take advantage from the high plasticity of concrete at this condition, where the concrete members are under triaxial stresses. For example, piles, containment vessels, bridge piles and columns of high rise buildings and impact of projectiles [26].
| Researchers | Dimensions (cm) | Additive | f'c(MPa) | σ3(MPa) |
σ1max (MPa) |
|---|---|---|---|---|---|
| Richart [4] | 10 x 20 10 x 60 |
- | 7-25 | 1.24-28.2 | 140 |
| Gardner [29] | 7.6 x15.2 | - | 29 | 8.6-25.9 | - |
| Jamet [30] | 11 x 22 | - | 26 | 3-100 | 155 |
| Hurlbut [31] | 5.4 x 10.8 | - | 22 | 0.69-13.8 | - |
| Smith [32] | 5.4 x 10.8 | - | 34.5 | 0.69-34.4 | - |
| Xie [33] | 5.5 x 11 | Silica fume | 60, 92, 119 | 2.3–60 | 350 |
| lmran [23] | 5.4 x 10.8 | - | 29, 47, 73 | 1-50 | 240 |
| Attard [1] | 10 x 20 | Silica fume | 45–110 | 1–20 | - |
| Ansari & Li [34], [25] | 10.1x20.3 | Silica fume Fly ash | 42, 69, 103 | 8.3–83 | 320 |
| Newman [21] | - | - | 23–91 | 0–138 | - |
| Sfer [26] | 15 x 30 | - | 32.8, 38.8 | 0-60 | 205 |
| Candappa [3], [35] | 10 x 20 | - | 40, 60, 75, 100 | 4, 8, 12 | 167 |
| Lu [36] | 10x20 | Sika | 67 | 0–56 | 276 |
| Bellotti [37] | - | - | 53 | 0-39.2 | 207 |
In this investigation, an experimental program was undertaken to study the behavior of concrete under various confining pressure. The test results obtained a better understanding of the ultimate compressive strength of concrete under lateral pressures and the effect of stress path. Laboratory program and the results of this study are presented in the following sections.
2. EXPERIMENTAL PROGRAM
2.1. Mix Design
The mix proportion of concrete is shown in Table (2).
| Water | Cement | Sand | Gravel | W/C |
|---|---|---|---|---|
| 180 | 450 | 707 | 1054 | 0.4 |
Note: The target slump of this concrete is 60 mm.
2.2. Specimen Preparation
After making the concrete with mix design as shown in Table 2, the concrete was poured in cylindrical molds that is chosen with height to diameter ratio of 2 and the dimension of molds was 70 x 140 mm. The specimens were brought out from molds after 24 hours casting and compressing. Then the specimens were cured in pond of water at 23 ± 2°C for 28 days. After the curing, capping is needed for both heads of the specimens. In this study sulfur mortar was used for capping the specimens based on ASTM C-617.
2.3. Test Equipment
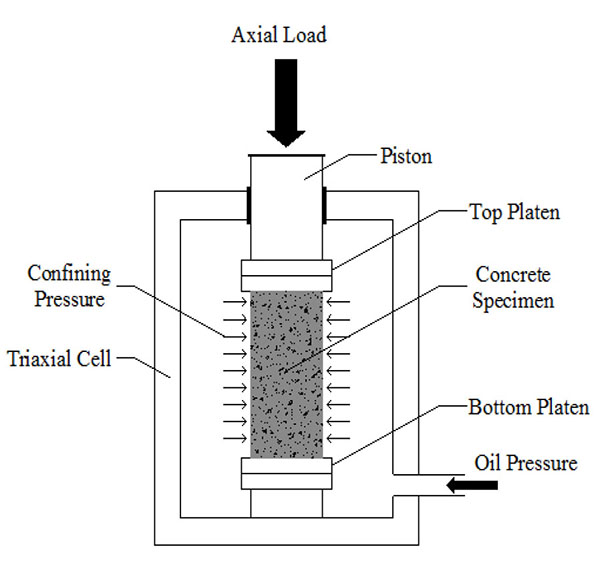
Triaxial test devices include mainly of the following ingredients: 1. Triaxial Rock cell; 2. Axial Load System; 3. Lateral Pressure System; 4. Axial Deformation Device. For applying, controlling & measuring the axial load, there is need for a proper procedure. This system should have sufficient power and be able to apply the axial loads with the intended rates. The device should be calibrated at appropriate intervals and comply with BS 1610 and ASTM E4 standards [27]. In this study, in order to load the cell piston and thus the concrete specimens, a jack of plate loading has been used with the capacity of 50 tones. This system is made up of 4 devices, that is, Hydraulic Loading Jack, Handy Pump, Computer and Deformation Sensor. Oil hydraulic jacks were used for applying stress on the concrete specimens. The device consists of two parts. First one is, the hydraulic pressure pump capable of producing lateral pressure with two percent accuracy. Another one is the measuring and displaying pressure (gage) with sufficient accuracy.
2.4. Test Procedure
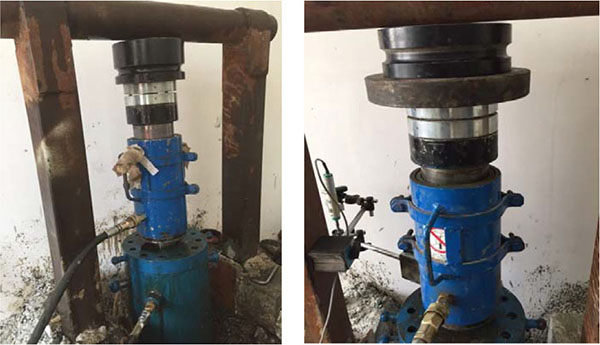
1. All measuring devices, are controlled and prepared. 2. Concrete cylindrical specimens are carefully placed between the steel plates so that the plates are flat and parallel to each other. Then the specimen is placed inside the triaxial cell. 3. The cell is filled with pressurizing fluid. It should be re-bled periodically to remove air; highly compressed air is a considerable experimental hazard. Bleeding should not be required more frequently than once every twenty tests, and if excessive leakage or entry of air is experienced the sleeve should be removed, cleaned and checked for damage [28]. 4. Axial loading device is located on the rock cell and clamped with steel frame (Fig. 1). 5. The deformation sensor is connected to the steel frame by a sensor magnet. Then, the sensor is located on system, so that it is completely vertical and parallel to the vertical axial load. The sensor should be fixed at the time of the test, to produce the exact results. 6. with a small axial force preventing loss of specimen alignment. The cell is raised to its operating position, ensuring that seats protrude equally top and bottom. A small cell pressure is applied to clamp the cell in position [28]. Then the oil is pumped into cell with using hydraulic jack and lateral pressure is applied on specimen, slowly. The axial load and lateral pressure increase at the same time, so that they remain equal when they reach the desired lateral pressure. After reaching the preset lateral pressure, this value should be kept constant with two percent accuracy. An important issue that must be noted is that, the primary uploading should be done in a way that the distribution of hydrostatic stress is maintained within the specimen. For this purpose it is necessary that the axial load and the lateral pressure are applied on specimen simultaneously and be equal. If during the hydrostatic loading, suddenly the lateral pressure surpasses the axial stress, the specimen contact with the loading piston becomes loose. So the steel plates may separate from the system and destroy centrality of the specimen. In this case, the device friction prevents return of the specimens to their original state and consequently, the test is carried out in poor condition and there is even possible damage to the rock cell. Therefore it is necessary, that during loading, the axial load is always slightly greater than the lateral load. This difference should not be more than 0.1 the uniaxial compressive strength. 7. The axial load is applied at a rate of constant stress, so that the specimens break within 5 to 15 minutes. Also stress rate can be between 0.5 to 1 MPa per second to consider (ISRM). Almost after every 10 to 20 KN load on the specimen, we should write down the displacement that sensor shows, till we obtain the specimen strain as per the applied load. The ASTM D2664 Standard stipulated that the load should be applied with constant strain rate and this rate should not be allowed to change, the set value is more than 10%. Strain rate is selected so that the failure of the similar specimen in the uniaxial compression test, occur between 2 to 15 minutes. The strain rate should remain constant for all the specimen tests. The results obtained by the researches showed that holding the strain rate in this range; the strength values would be independent of the load rate. Finally, the maximum axial load that is required for the failure of the specimen is taken for each lateral pressure. Fig. (2) shows a view from inside the rockcell during triaxial tests.
3. TEST RESULTS
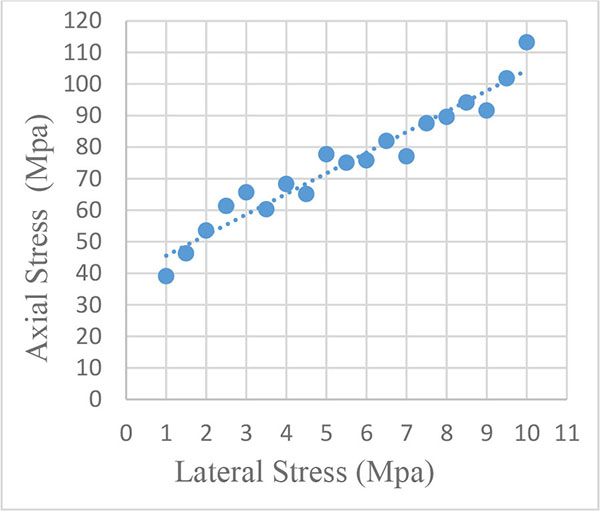
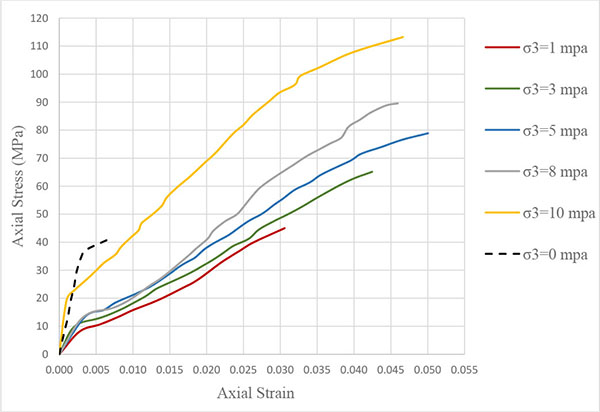
In this study, the uniaxial compressive strength tests were performed on the 6 cylindrical concrete specimens, for calculation of the compressive strength of concrete in case where the lateral stress is not applied. In continuation, 19 cylindrical specimens were used for triaxial tests. The test results are shown in Tables 3 and 4. Table 3 presents, the ultimate uniaxial stress for the specimens, which is on average equal to 40.04 MPa. Table 4 shows the results of triaxial tests per lateral stresses applied on the specimens, the vertical stress is unique for each concrete specimen. Fig. (3) shows the vertical stresses resulting from the triaxial tests which correspond to different lateral stresses applied on the specimens. Fig. (4) presents the axial stress – axial strain of some specimens that were tested under various lateral stresses. As can be seen, axial stress on the same concrete specimens in triaxial state is much more than those in the uniaxial state (Dash Curve). This issue shows that when concrete is placed under confining stress, compressive strength is significantly increased. Also the deformation and the axial strain of the specimens in triaxial tests are much more than the same specimens in uniaxial tests (σ3 = 0).
| No. | Ultimate Load | Diameter | Area | Height | Weight | Density | Ultimate Stress | Strain | E (GPa) |
|---|---|---|---|---|---|---|---|---|---|
| P (ton) | D (cm) | A (cm2) | H (cm) | w (kg) | ρ (kg/m3) | f'c (MPa) | ɛ | ||
| 1 | 16.60 | 7.16 | 40.27 | 14.31 | 1.29 | 2242 | 41.22 | 0.0087 | 30.20 |
| 2 | 16.35 | 7.22 | 40.94 | 14.39 | 1.27 | 2164 | 39.93 | 0.0054 | 29.70 |
| 3 | 13.76 | 7.11 | 39.74 | 14.37 | 1.27 | 2222 | 34.63 | 0.0079 | 27.70 |
| 4 | 15.26 | 7.00 | 38.54 | 14.25 | 1.29 | 2345 | 39.60 | 0.0051 | 29.60 |
| 5 | 15.40 | 6.89 | 37.28 | 14.44 | 1.30 | 2414 | 41.30 | 0.0069 | 30.20 |
| 6 | 16.97 | 7.05 | 38.98 | 14.57 | 1.30 | 2298 | 43.53 | 0.0078 | 31.00 |
| Avg. | 15.72 | 7.07 | 39.29 | 14.39 | 1.29 | 2281 | 40.04 | - | 29.70 |
| No. | Axial Load | Diameter | Area | Axial Stress | Lateral Stress | Axial Strain |
|---|---|---|---|---|---|---|
| P (KN) | D (cm) | A (cm2) | σ1(MPa) | σ3(MPa) | ε 1 | |
| 1 | 159.03 | 7.20 | 40.72 | 39.06 | 1.0 | 0.031 |
| 2 | 185.94 | 7.15 | 40.15 | 46.31 | 1.5 | 0.050 |
| 3 | 219.28 | 7.22 | 40.94 | 53.56 | 2.0 | 0.032 |
| 4 | 233.97 | 6.97 | 38.16 | 61.32 | 2.5 | 0.058 |
| 5 | 256.27 | 7.05 | 39.04 | 65.65 | 3.0 | 0.042 |
| 6 | 234.73 | 7.05 | 39.04 | 60.31 | 3.5 | 0.044 |
| 7 | 270.49 | 7.10 | 39.59 | 68.32 | 4.0 | 0.054 |
| 8 | 265.22 | 7.20 | 40.72 | 65.14 | 4.5 | 0.049 |
| 9 | 307.79 | 7.10 | 39.59 | 77.74 | 5.0 | 0.050 |
| 10 | 305.61 | 7.20 | 40.72 | 75.06 | 5.5 | 0.040 |
| 11 | 301.92 | 7.12 | 39.82 | 75.83 | 6.0 | 0.050 |
| 12 | 324.38 | 7.10 | 39.59 | 81.93 | 6.5 | 0.050 |
| 13 | 306.98 | 7.12 | 39.82 | 77.10 | 7.0 | 0.057 |
| 14 | 357.37 | 7.21 | 40.83 | 87.53 | 7.5 | 0.058 |
| 15 | 359.64 | 7.15 | 40.15 | 89.57 | 8.0 | 0.046 |
| 16 | 384.40 | 7.21 | 40.83 | 94.15 | 8.5 | 0.056 |
| 17 | 372.95 | 7.20 | 40.72 | 91.60 | 9.0 | 0.040 |
| 18 | 391.70 | 7.00 | 38.48 | 101.78 | 9.5 | 0.037 |
| 19 | 461.02 | 7.20 | 40.72 | 113.23 | 10.0 | 0.047 |
4. RESULTS AND DISCUSSION
4.1. Relationship Between Axial Stress & Lateral Stress
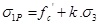
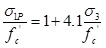
The authors suggested relationships with several factors have provided since 1928 the Richart founder of the study of triaxial behavior of concrete. Relationship between axial stress and confining stress is usually written in the form:
 |
(1) |
Where σ1P = peak axial stress;  = uniaxial strength (
 ); σ3= lateral confining pressure (σ3 > 0 ); and k = a constant.
Eq. (1) may be normalized as shown:
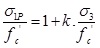 |
(2) |
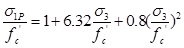
In order to more accurately Eq. (2), it can be provided in the form of quadratic equation.
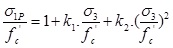 |
(3) |
According to triaxial test results obtained in this study, the relationship between axial and lateral stress, is presented:
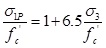 |
(4) |
 |
(5) |
4.2. Comparison with the Researchers Suggested Relationships
Table 5 presents, suggested relationship of this study and other researchers.

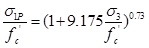
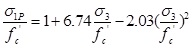
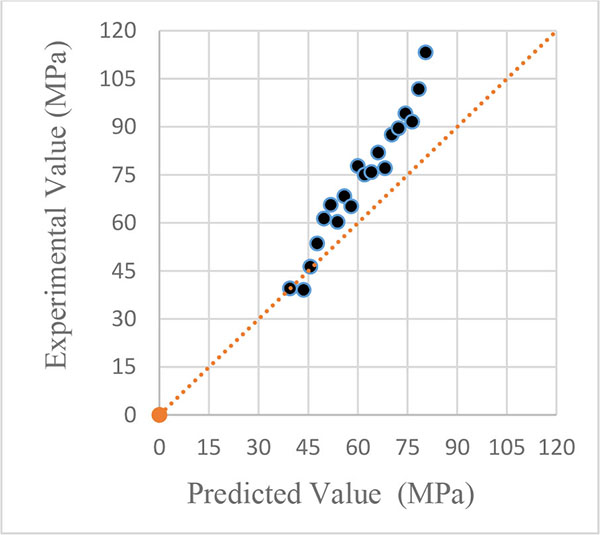
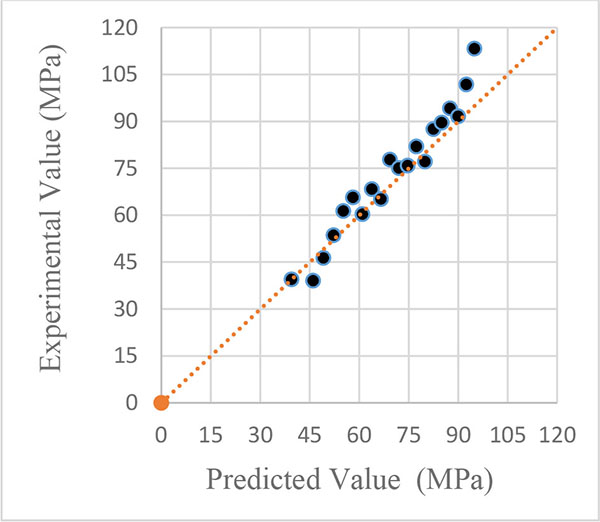
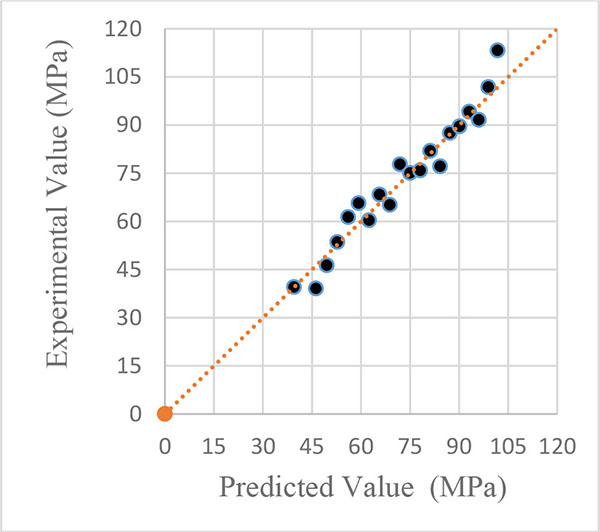
Next, for better comparison of the relationships, use has been made of Figures. The horizontal axis represents the axial stress from researchers relationship (σ1pre) and the vertical axis represents the axial stress of the triaxial tests results in this article (σ1 exp). These points are achieved through replacing the same lateral stresses in the suggested relationship by the researchers and that used in this study. Regarding all the 19 specimens, the experimental peak stress (σ1 exp) collected from the literature is plotted against the predicted values, as shown in Figs (5, 6 and 7) To show the overall trend of the correlation, the theoretical line with σ1 exp /σ1pre = 1 was drawn on the graphs along with the data points plotted. The nearer the points gather around the diagonal line, the better are the predicted values. By observing the Figures, it is seen that the test results are not proportional to the suggested relationship of Richart [4] and at the beginning of the line; the points are close to the line. While the lateral stress is increased and consequently the resulting axial stress, the points in Fig. (5) were scattered with respect to the diagonal line σ1 exp /σ1pre = 1. In Fig. (6) the test results are compared with Balmer’s suggested relationship in, which shows the points are closer to the line and scattering of points is less than the points in Fig. (5). But it is observed that with rising of the axial stress, scattering of points is increased. In Fig. (7), the test results are too close to the relationship of Lan [24] and the points are less scattered. As can be observed in Fig. (7) the results are closer to the diagonal line than other relationships.
4.3. Attard and Setunge Model
One of the prominent methods that is available in the literature for the prediction of the behavior of confined concrete, is Attard [1] model, which is used in this study for comparison of the results. Attard [1] proposed a strength criterion for the ultimate strength of confined concrete with varying low confinement.
The proposed formula is defined by:
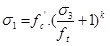 |
(6) |
with
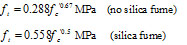 |
(7) |
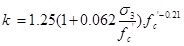 |
(8) |
Where f t= tensile strength of concrete and k = parameter that reflects the effectiveness of confinement.
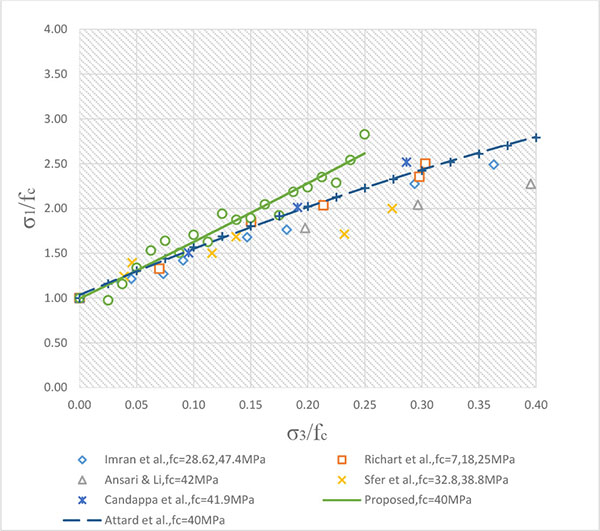
Fig. (8) illustrates experimentally obtained normalized peak strength versus confinement levels of this study and other studies. Also all of the results are compared with the prediction of Attard [1] for normal strength ( MPa) in this figure.
CONCLUSION
- In this investigation, uniaxial and triaxial tests were performed and evaluate the results are done, it can be noted that the concrete under the lateral confining stress, shows greater uniaxial compressive strength than of the uniaxial test of the concrete. The strength and ductility of concrete under lateral pressure are influenced by the lateral confining stress. The higher the lateral stress, the higher peak stresses and strains are attained for the concrete.
- Observing triaxial behavior of the concrete, it can be concluded that, the axial strain at the peak stress exhibits strong linear relationship with the level of confinement.
- Comparison of the calculated relationship in this study with other suggested relationships by the researchers, it can be seen, that the calculated equation in this research is closer to the equations of Balmer [5] and Lan [24]. Totally it is closer to the suggested relationship by Lan [24]. Almost the constant (k) of the calculated equation is identical with the constant of Lan's [24] equation.
- After performing triaxial tests and observing the broken specimens Fig. (9), it was seen the pressure, in terms of the amount of lateral stress, is higher or lower than around 6 MPa, the failure mode could be like crushing or cleavage. This might be mainly due to the change in the relative strength of the link and paste, with rising of the confining stresses.
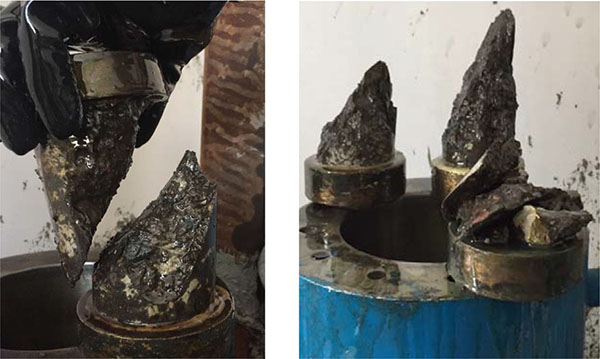 Fig. (9). Two various types of broken cylindrical specimens.
ETHICS APPROVAL AND CONSENT TO PARTICIPATE
Not applicable.
HUMAN AND ANIMAL RIGHTS
No Animals/Humans were used for studies that are base of this research.
CONSENT FOR PUBLICATION
Not applicable.
CONFLICT OF INTEREST
The author confirms that this article content has no conflict of interest.
ACKNOWLEDGEMENTS
Declared none.

