All published articles of this journal are available on ScienceDirect.

Finite Element Analysis of Square RC Columns Confined by Different Configurations of Transverse Reinforcement
Abstract
Introduction:
Square reinforced concrete (RC) columns with the confinement effect of transverse reinforcement perform well in ductility and have been used widely in RC structures. Its behavior is the classic topic of anti-seismic and anti-collapse analysis of RC structures. With the advancement of the finite element (FE) analysis technology, the general-purpose simulation tools such as ABAQUS and ANSYS have been universally used to analyze the behavior of structures and members, where the material constitutive model is a key problem in the analysis.
Methods:
In this study, a new uniaxial compressive stress-strain curve of the confined concrete considering confinement effect of transverse reinforcement in square RC columns was proposed for the concrete damaged plasticity model in ABAQUS to solve the problem that there is no proper uniaxial compressive stress-strain curve for the concrete damaged plasticity model to describe the behavior of concrete confined by transverse reinforcement. Based on the proposed stress-strain relationship, a FE model was developed to analyze the behaviour of laterally confined RC columns under concentric loading.
Results:
The finite element model is able to predict the response of the confined RC columns from different experiments with reasonable accuracy. Finally, a parametric study was conducted in order to evaluate the effect of confinement reinforcement configuration on the behavior of core concrete in square section.
1. INTRODUCTION
Confined concrete gains higher ductility and strength as compared to unconfined concrete. The higher the level of confining stress, the more is the gain in ductility and strength of confined concrete. For RC columns, the most important design consideration for ductility in plastic hinge region is the provision of transverse reinforcement that confines the core of the compressed concrete. Thus, many experiments [1-7] on confined RC columns under concentric loading have been carried out and different empirical or semi-empirical stress (σ)-strain (ε) law of the confined concrete [8-13] have been proposed to describe the uniaxial compression behavior based on statistical treatment of experimental observations. Most of the constitutive laws are very practical in design of RC columns.
However, confinement of concrete in RC column is a three-dimensional phenomenon that cannot be easily reduced to two dimensions. Thus, the high fidelity three-dimensional nonlinear numerical simulation becomes the important means to investigate the influential parameters of confining effect and confining mechanism of transverse reinforcement. Compared with experimental means and simplified approach, the numerical simulation is able to provide more details of the mechanical behavior of RC members with the confinement effect of transverse reinforcement. With the development of computer technology and increasing requirement for refined analysis of structures, a growing number of studies of passively confined concrete in RC column with the FE method have been conducted in recent years [14-20]. Now, there are many pieces of general FE analysis software such as ABAQUS, ANSYS, and so forth, which have been used widely in civil engineering fields. It is a fact that it is much simpler, more convenient and easier to use for advanced FE modelling to use the general FE analysis software than to compile the analysis program code with the same function because the general FE analysis software usually provides the convenient and visual modelling interface and usually the main works for user are choosing rational parameter setup and material models.
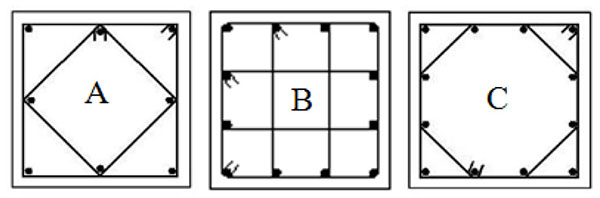
The general FE analysis software ABAQUS with the concrete damaged plasticity model has been widely used to analyze the behavior of concrete in structures. However, it is difficult for the concrete damaged plasticity model in ABAQUS to reasonably predict the post-peak behavior of passively confined concrete by using the uniaxial compressive σ-ε curve of unconfined concrete [20, 21]. Tao et al. [21] illustrated that problem and proposed a new uniaxial compressive σ-ε model with the confinement effect of steel tube, which gives reasonable prediction for concrete confined by steel tubes in concrete damaged plasticity model. But few cases referred to the FE analysis of concrete confined by transverse reinforcement based on ABAQUS [19, 20]. In this study, the author proposed a new σ-ε curve of confined concrete under uniaxial compression for the concrete damaged plasticity model in order to simulate the confinement effect of transverse reinforcement. The σ-ε curve referred to three types of configurations of transverse reinforcement in square section as shown in Fig. (1). The details of the material model of the confined concrete and the three-dimensional nonlinear FE model on square RC columns with high volumetric ratio of transverse reinforcement are described in the paper. And then, the FE model is verified by comparing analytical results with experimental data. Finally, the effect of diverse configurations of confinement reinforcement in square columns under monotonic axial loading is evaluated based on the developed FE model.
2. FE MODELING
2.1. Material Modeling of Concrete
The available concrete damaged plasticity model [22] in ABAQUS, which is comprised of plasticity model and linearly damaged model, is used to simulate the behavior of concrete. The linearly damaged model is usually used to model the stiffness degradation and stiffness recovery of concrete under cyclic loading by defining the damage variables. Since this paper only deals with columns under monotonically concentric loading, the linearly damaged model was not defined. Therefore, only the plasticity model was used to simulate the concrete nonlinearity.
In the model, the key plastic parameters including dilation angle, eccentricity, ratio of the biaxial compression strength to uniaxial compression strength of concrete, the ratio of the second stress invariant on the tensile meridian to that on the compressive meridian are constant values of 30o, 0.1, 1.16, 0.667, respectively [23]. The modulus of elasticity and Poisson’s ratio of concrete in compression are 4730fc0.5 [24] and 0.2 [25], respectively. Here, fc (N/mm2) is the cylinder strength of concrete. Moreover, the σ-ε relations of concrete in uniaxial compression and tension need to be defined, which are described in the following content.
2.1.1. Uniaxial Compressive σ-ε Curve of Concrete Confined by Transverse Reinforcement
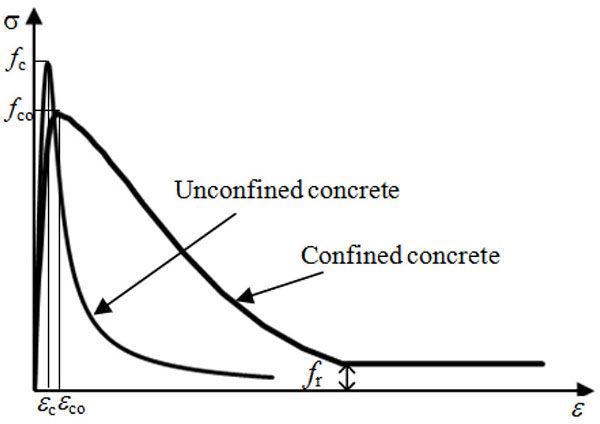
In this paper, a new σ-ε model was proposed to represent the strain hardening/softening rule of concrete confined by transverse reinforcement, which is shown in (Fig. 2). A model proposed by Zeng [20] is used to describe the ascending curve:
| y = αax + (3 - 2αa)x2 + (αa - 2)x3 (ε ≤ ε∞) | (1) |
 |
(2) |
| αa = 2.4-0.0125 f∞ | (3) |
where, fco is the peak strength of confined concrete and fco is equal to 0.85fc. The strength-reduction factor of 0.85 is used to consider the difference between the strength of in situ concrete and the cylinder strength [11]. εco means the peak strain of confined concrete, which is proposed by the author as follow [20]:
 |
(4) |
where εc shown in Fig. (2) means the peak strain of unconfined concrete; Ie is the effective confinement index at peak stress fco, which is a parameter that reflects the confining effect of transverse reinforcement. Due to the confining effect, the peak strain εco of confined concrete is larger than the peak strain εc of unconfined concrete. Therefore, Eq. (4) uses the parameter Ie to consider the extra strain increased by the confining effect beyond the εc when calculating εco. Eq. (5) determines the εc related to fco, which is attained from the relation table of the peak strain and strength of unconfined concrete in the Fib Model Code for Concrete Structures 2010 [25] based on linear regression analysis. Ie is determined by Eq. (6) [11].
| εC = 0.00001· fCO + 0.002 | (5) |
| Ie = ρsefh / fCO | (6) |
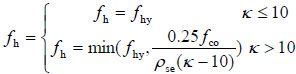
In which ρse means the effective sectional ratio of transverse reinforcement. fh is the stress in transverse reinforcement at the point of maximum confined concrete stress fco. ρse and fh are determined using Eqs. (7) and (8), respectively.
| ρse = keAsh / sc | (7) |
 |
(8) |
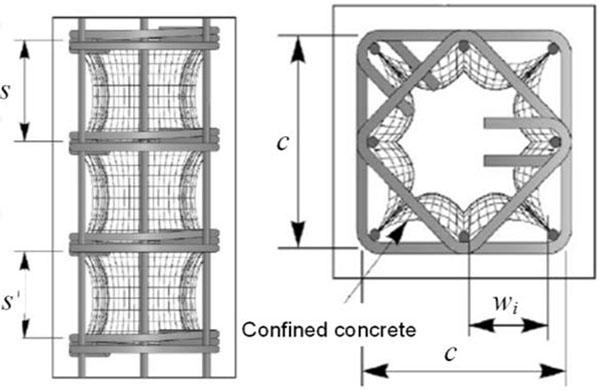
where Ash is the total area of transverse bars running in the direction along the edge of the cross section and is defined as 3.41, 4.67, 3.61 times the cross section area of a single tie leg for tie configuration A, B, C shown in Fig. (1), respectively [26]; As shown in Fig. (3), s is the vertical centerline spacing between transverse reinforcement and c is the center-to-center distance between centerlines of perimeter hoop; fhy means the yield strength of transverse bars; ke is the geometrical confinement effectiveness coefficient, which reflects the effectiveness of the transverse reinforcement in confining the concrete; the parameter κ is used to estimate whether or not the transverse bars yield at the peak stress. ke and κ can be determined by Eq. (9) [9] and Eq. (10) [11], respectively.
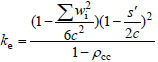 |
(9) |
| κ = fCO / (ρseEstεC) | (10) |
where s' is the clear vertical spacing between transverse reinforcement and wi is the ith clear spacing of adjacent longitudinal bars (shown in Fig. 3); ρcc is the ratio of area of longitudinal reinforcement to the area of core section; Est is the modulus of elasticity of transverse reinforcement.
The descending branch of confined concrete in Fig. (2) is described by an exponential function proposed by Binici [28]:
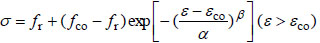 |
(11) |
in which fr is the residual stress as shown in Fig. (2); the parameters α and β determine the shape of the descending branch. Here, fr=0.01fco and the expression for α is proposed as:
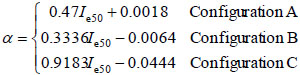 |
(12) |
The parameter β is determined as:
 |
(13) |
In Eq. (12), Ie50 represents the effective confinement index at 50% of the peak strength of confined concrete in the descending branch of σ-ε curve. Ie50 is determined by the following equation suggested by Le´geron and Paultre [11]:
| Ie50 = ρsefhy / fco | (14) |
The method of determining fr, α and β is the same with that described by Tao et al. [21]. In order to determine fr, α and β, different trial values were used until best-fit values were obtained to ensure predicted ultimate axial strengths vs. axial strain (N-ε) curves match with measured curves. It was found that α can be expressed as functions of Ie50. Eq. (12) was then developed on the basis of regression analysis.
2.1.2. Uniaxial Compressive σ-ε Curves of Plain Concrete and Concrete Confined by Steel Jacket
The model of unconfined concrete proposed by Wang et al. [29] was used to describe the σ-ε curve of cover concrete.
Some test columns [2] used to verify the developed three-dimension nonlinear FE model were further confined with the help of the welded steel jacket at the tapered ends of the columns. In order to describe the behavior of concrete confined by steel jacket, the uniaxial compressive σ-ε curve proposed by Han et al. [23] was used.
2.1.3. Uniaxial Tensile Model
Under uniaxial tension, the stress-strain response follows a linear elastic relationship until the value of the failure stress and the post-peak behaviour is characterised by a fracture energy cracking model [22]. Beyond the peak stress, the fracture energy cracking model assumes the linear loss of strength following the cracking displacement and define the failure stress as a tabular function of the associated fracture energy GF. The GF is determined by the following equation [25]:
 |
(15) |
where GF is in N/m and fc is in MPa.
2.2. Material Modeling of Steel
Isotropic elastic-plastic model was used for the reinforcement and the σ-ε relation was characterized as a bilinear strain-hardening curve with the hardening modulus 0.01 Es. The end steel plate (Fig. 4) is taken as the elastic material.
2.3. Interaction, Boundary Condition and Element Divisions
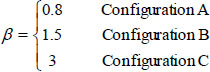
Test columns under concentric loading from different literatures [2-4, 7] were simulated. As seen in Fig. (4), one-half models with symmetry boundary were built based on the symmetrical characteristic of the columns.
For columns with shape A [2] shown in Fig. (4a), end plates were set up and spherical loading heads were placed on the end plates of the specimens in the experiment. A tie constraint can be specified for the interaction between the ends of a concrete column and the corresponding end steel pad. In order to simulate the spherical hinges, two reference points (RP-1 and RP-3 in Fig. (4a)) were set up at the centers of the end plates and kinematic coupling constraints were used to constrain the motion of the end plates to the motion of the corresponding reference points. Spherical hinge boundary conditions were applied on the top and bottom reference points, but the top reference point was allowed to move along the longitudinal direction and the axially concentric load was applied on the top reference point. General contact in explicit module was used for the interaction simulation of the steel jacket and the corresponding end of a concrete column. The tangent contact was simulated by the penalty friction formulation with a coefficient of friction 0.6 between the steel jacket and concrete [30] and the normal contact was simulated with “hard contact” which has no penetration of that in compression.
For columns with shape B [3, 4, 7] as shown in Fig. (4b), they were normally placed into a testing machine and the load was applied on the specimen directly in the tests. The bottom support end and the top load end are modeled with analytical rigid bodies because the steel pads on the test machine are stiff enough. Fixed boundary condition was applied to the bottom support end and the movably spherically supported condition was applied to the top end. General contact in explicit module was used for the interaction simulation of the rigid plates and the ends of columns. The tangent contact was simulated by the rough friction formulation, which means no slipping for the interface. “Hard contact” for the interface was specified in the normal direction.
The embedded region constraint in ABAQUS was used to simulate the interaction between the steel reinforcement cage and concrete. In the constraint, the translational degrees of freedom of the embedded node (node of reinforcement) are constrained to the interpolated values of the corresponding degrees of freedom of the host element (element of concrete), but the rotational degrees of freedom are not constrained by the embedding [20, 22].
The steel rebar and the parts including concrete and steel pad were modeled with the 2-node linear 3-D truss element (T3D2) with linear interpolating function in displacement field and 8-node brick elements (C3D8R), respectively. By comparing the simulation results with the test results, it is found that the sizing controls in approximate global mesh size are set as 25 mm for the steel cage and 50 mm for the concrete body and steel plate can predict the test results well. The FE model meshes are shown in (Fig. 4).
3. VERIFICATION OF THE CURRENT FE MODEL
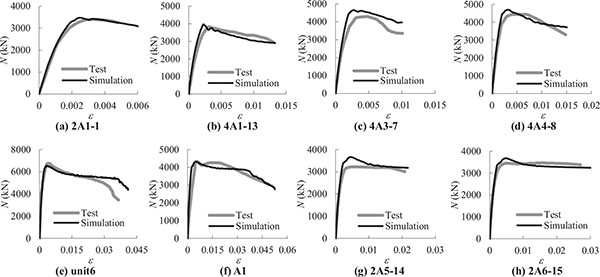
The test columns under concentric load from different literature [2-4, 7] were utilized to verify the FE model, which involved different configurations of transverse reinforcement (Configuration A, B and C shown in Fig. (1) with the volumetric ratio of transverse reinforcement in the range from 0.8% to 2.4%, different concrete compressive cylinder strength, different size of section. Details of cross section parameters in test regions of the test columns are described in Table 1. The specimens in Table 1 were tested by Sheikh and Uzumeri [2] except the specimens which were marked with the researchers.
| Specimen | Reinforcement configuration | Size of section (mm×mm) |
Concrete fc (Mpa) | Longitudinal reinforcement | Transverse reinforcement | |||||
|---|---|---|---|---|---|---|---|---|---|---|
| Diameter (mm) |
Total area (mm2) |
Yield strength fy (Mpa) |
Diameter (mm) |
Spacing (mm) |
Volumetric ratio ρsv | Yield strength fyh (Mpa) |
||||
| 2A1-1 | A | 300×300 | 37.5 | 15.9 | 1600 | 271.6 | 4.8 | 57 | 0.8% | 400 |
| 4A1-13 | A | 300×300 | 31.2 | 22.2 | 3097 | 438.5 | 4.8 | 57 | 0.8% | 400 |
| 4A3-7 | A | 300×300 | 40.9 | 22.2 | 3097 | 384.7 | 7.9 | 76 | 1.66% | 400 |
| 4A4-8 | A | 300×300 | 40.8 | 22.2 | 3097 | 384.7 | 4.8 | 28 | 1.59% | 400 |
| Unit6 (Scott et al. [3]) |
A | 450×450 | 25.3 | 24 | 3619 | 394 | 10 | 72 | 1.74% | 309 |
| A1 (Moehle and Cavanagh [4]) | A | 305×305 | 33.8 | 19.1 | 2280 | 490 | 6.4 | 38 | 2.07% | 440 |
| 2A5-14 | A | 300×300 | 31.5 | 15.9 | 1600 | 403 | 9.5 | 76 | 2.39% | 400 |
| 2A6-15 | A | 300×300 | 31.7 | 15.9 | 1600 | 403 | 6.4 | 35 | 2.32% | 400 |
| A1 (Qian et al. [7]) |
B | 350×350 | 26.1 | 12 | 1356 | 401 | 8 | 90 | 1.48% | 309 |
| 4B3-19 | B | 300×300 | 33.4 | 19.1 | 3406 | 391.6 | 7.9 | 102 | 1.8% | 400 |
| 4B4-20 | B | 300×300 | 34.7 | 19.1 | 3406 | 391.6 | 4.8 | 38 | 1.7% | 400 |
| 4B6-21 | B | 300×300 | 35.5 | 19.1 | 3406 | 391.6 | 6.4 | 48 | 2.4% | 400 |
| Unit2 (Scott et al. [3]) |
C | 450×450 | 25.3 | 20 | 3768 | 434 | 10 | 72 | 1.82% | 309 |
| 4D3-22 | C | 300×300 | 35.5 | 19.1 | 3406 | 391.6 | 7.9 | 82 | 1.6% | 400 |
| 4D4-23 | C | 300×300 | 35.9 | 19.1 | 3406 | 391.6 | 4.8 | 29 | 1.7% | 400 |
| 4D6-24 | C | 300×300 | 35.9 | 19.1 | 3406 | 391.6 | 6.4 | 38 | 2.3% | 400 |
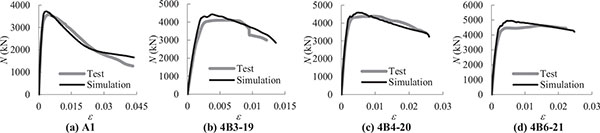
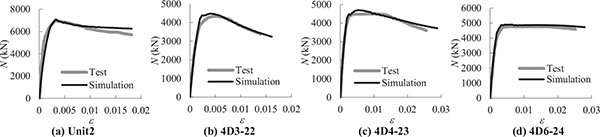
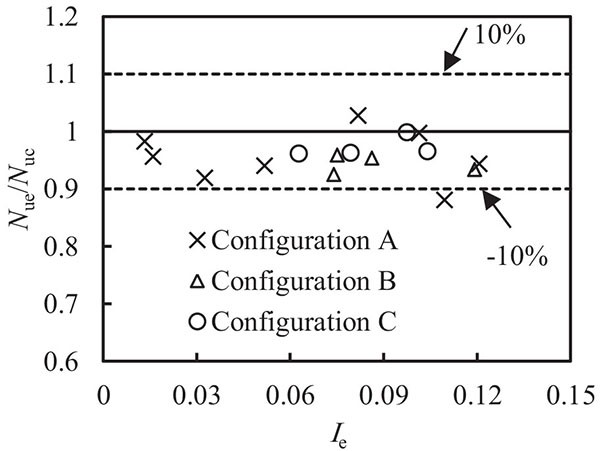
Figs. (5, 6 and 7) show the comparison between the predicted and measured N-ε curves of the specimens with different configuration of transverse reinforcement. Here, N and ε represent the axial load and the average axial strain of the test region, respectively. It can be seen that the developed FE model predicts the N-ε curves well. Fig. (8) shows the comparison between the predicted ultimate axial strength (Nuc) and the measured ultimate strength (Nue) of all collected test data. The mean value and standard deviation of Nue/Nuc are 0.956 and 0.035, respectively. It is seen that the current FE model slightly overestimates the axial strength of test columns, but with reasonable accuracy.
4. EFFECT OF CONFIGURATION OF TRANSVERSE REINFORCEMENT
Based on the verified FE model, a further parametric study was carried out to investigate the confining effect of different configuration of transverse reinforcement. In this analysis, all the columns are 1200 mm in length and have the same section size of 450 mm × 450 mm. The core size measured from the center of the perimeter hoop is kept constant at 390 mm × 390 mm. The concrete compressive cylinder strength fc is 40 MPa. As shown in Table 2, the specimens CA, CB and CC represent the columns with A, B and C in configuration of transverse reinforcement, respectively. The three specimens have the same total area (3600 mm2) and yield strength (500 Mpa) of longitudinal steel and the same volumetric ratio.
| Specimen | Longitudinal steel | Transverse reinforcement | |
|---|---|---|---|
| Diameter (mm) | Number of bars | Diameter (mm) | |
| CA | 24 | 8 | 9.4 |
| CB | 19.5 | 12 | 8.0 |
| CC | 19.5 | 12 | 9.1 |
(2.4%), spacing (50 mm) and yield strength (400 Mpa) of transverse reinforcement, but different number and diameter of longitudinal bars and different diameter of transverse reinforcement due to the different configuration of transverse reinforcement. The variation of reinforcement in the three columns is shown in Table 2.
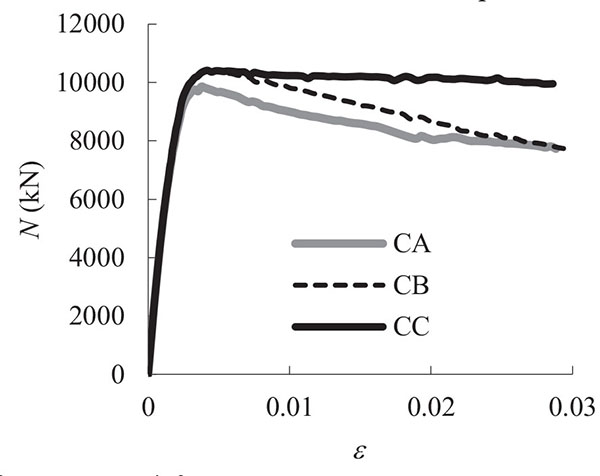
Fig. (9) shows the effect of the configuration of transverse reinforcement on the N-ε curves. It is seen that the variation of configuration of transverse reinforcement has a slight effect on the ultimate strength, but has a significant effect on the ductility. As shown in Fig. (9), the specimen CC behaves best in ductility.
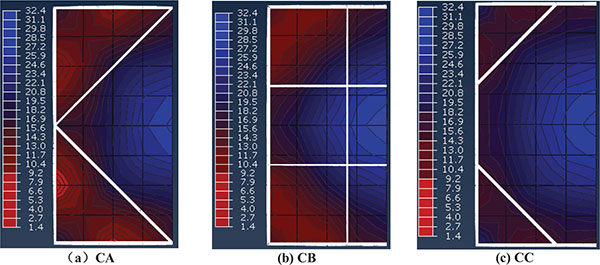
In order to illustrate the difference of ductility between the three columns, the mechanical characteristics corresponding to an axial strain of ε=0.02 were investigated. Through dealing with the analysis results, it is found that the maximum principal stress σ11 of the core concrete in each specimens is less than zero. That means that the core concrete is under triaxial compression. According to the damaged plasticity model [22], the uniaxial compressive strength increases with the hydrostatic stress p, p=-trace(σ)/3. Fig. (10) shows the hydrostatic stress contours within the core concrete in the middle sections of the three columns corresponding to an axial strain of ε=0.02, in which the white solidline represents the transverse reinforcement. It is obvious that the center of the specimen, which is restricted by the surroundded material, has much higher hydrostatic stress. By comparing the contours of the hydrostatic stress in CA, CB and CC, it is observed that the level of hydrostatic stress in CC is obviously higher than that in the other two specimens, which makes the higher strength of concrete at ε=0.02. Therefore, configuration C provides better confinement effect on the core concrete than the other two after the peak load.
CONCLUSION
A well uniaxial compressive σ-ε curve of confined concrete for the concrete damaged plastic model in ABAQUS was proposed to simulate the behavior of confined concrete in square RC columns with three different types of configuration of transverse reinforcement. Based on the proposed material model, a three-dimension nonlinear FE model was developed for concentrically loaded square RC columns confined by different configurations of transverse reinforcement, which was verified by the tested confined RC columns.
A parametric study based on the current FE model shows that the transverse reinforcement with configuration C has better confinement effect on core concrete than the other two configurations and improve the ductility of RC column more, but the variation of configuration of transverse reinforcement has a slight effect on the ultimate strength of confined concrete.
CONFLICT OF INTEREST
The author declares that there is no conflict of interest regarding the publication of this article.
ACKNOWLEDGEMENTS
The author gratefully acknowledges the projects supported by the National Natural Science Foundation of China (No. 51608156), the Natural Science Foundation of Hainan Province (No. 20165208) and the Scientific Research Starting Foundation of Hainan University (No. Kyqd1534).
NOMENCLATURE
| Ash | = total area of transverse bars running in the direction along the edge of the square section |
| c | = center-to-center distance between centerlines of perimeter hoop |
| Es | = modulus of elasticity of longitudinal reinforcement |
| Est | = modulus of elasticity of transverse reinforcement |
| fc | = cylinder strength of unconfined concrete in N/mm2 |
| fco | = strength of confined concrete in N/mm2 = 0.85 fc |
| fh | = stress in transverse reinforcement at the point of maximum confined concrete stress fco |
| fhy | = yield strength of transverse bars |
| fr | = residual stress in the descedning branch of stress-strain relation of confined concrete |
| GF | = fracture energy of concrete |
| Ie | = effective confinement index at peak stress fco |
| Ie50 | = effective confinement index at 50% of the peak strength of confined concrete in the descending branch of stress-strain curve |
| ke | = geometrical confinement effectiveness coefficient |
| s | = vertical centerline spacing between transverse reinforcement |
| s' | = clear vertical spacing between transverse reinforcement |
| wi | = the ith clear spacing of adjacent longitudinal bars |
| α | = a parameter that determines the shape of the descending branch of stress-strain curve |
| αa | = a parameter that determines the shape of the ascending branch stress-strain curve |
| β | = a parameter that determines the shape of the descending branch stress-strain curve |
| ε | = strain in concrete or steel |
| εc | = peak strain of unconfined concrete |
| εco | = peak strain of confined concrete |
| κ | = a parameter used to estimate whether or not the transverse bars yield at the peak stress fco |
| ρcc | = ratio of area of longitudinal reinforcement to the area of core section confined by transverse reinforcement |
| ρse | = effective sectional ratio of transverse reinforcement |
| σ | = stress in concrete or steel |

