All published articles of this journal are available on ScienceDirect.

Robustness Assessment of Steel Moment Resisting Frames
Abstract
Nowadays, many buildings with steel Moment Resisting Frames (MRF) are built in seismic zones when seismic codes are at its early stages of development, and as such, these structures are often designed solely to resist lateral wind loads without providing an overall ductile mechanism. On the other hand, current seismic design criteria based on hierarchy of resistance allow enhancing the structural ductility and controlling the structural plastic behaviour. Therefore, seismic design criteria might also be beneficial to improve the structural robustness. In order to investigate this issue for steel MRF, a parametric study based on pushdown analysis and on the Energy Balance Method is described and discussed in the present paper. With this regard, the following cases are examined: (i) MRF not designed for seismic actions and (ii) MRF designed for seismic actions. The investigated parameters are (i) the number of storeys, (ii) the interstorey height, (iii) the span length, (iv) the building plan layout and (v) the column loss scenario. Results show that the low-rise and long span structures are the most prone to progressive collapse and that the elements in the directly affected zone of the wind designed 8 storey structures respond in the elastic range. Structures designed according to the capacity design principles were found to be less robust than wind designed structures that are characterized by strong beams and weak columns. The number of elements above the removed column and size of beam cross section were found to be key parameters in arresting progressive collapse.
1. INTRODUCTION
Low/medium rise steel Moment Resisting Frame (MRF) structures designed only for lateral wind actions are typically characterized by weak column/strong beam assemblies, owing to the need to limit lateral drifts. On the contrary, seismic design criteria currently recommended by modern codes (e.g. the EN 1998-1 [1]) lead to frames with strong column / weak beam arrangements, which are obtained by applying capacity design principles, where a component resistance hierarchy is established in order to form an overall ductile mechanism. Indeed, in order to guarantee this performance, the dissipative zones (e.g. the beams in case of moment resisting frames) should develop plastic hinges that are characterized by strain hardening [2-10]. Therefore, the non-dissipative zones (e.g. the columns) should be designed to resist the maxima effects developed into the plastic hinges [7, 10].
Imposing a ductile damage pattern is also favourable for increasing the structural capacity against progressive collapse, as stated by El-Tawil et al. [11]. However, the necessary level of detailing to improve the robustness of buildings in case of column loss scenarios remains an open issue.
In recent years, a large number of studies have been carried out on the topics of structural robustness and progressive collapse of structures. Izzuddin et al. [12] developed a framework for evaluating robustness based on the computation of the system pseudo-static capacity. Pushdown analysis was also used in studies conducted by Lu et al. [13], concluding that failure modes were correctly determined using nonlinear static analysis and that robustness can be quantified using the residual reserve strength ratio. Results from simulations carried out by Khandelwal et al. [14] and Hayes et al. [15] showed that frames designed using seismic design provisions presented greater robustness. Khandelwal et al. [14] also concluded that layout and system strength significantly influence robustness. Jahromi [16] verified that the response under column loss is dominated by a single mode. The importance of the three-dimensional effects on dynamic response was addressed by Song and Sezen [17] and Alashker et al. [18], concluding that 2D modelling does not necessarily lead to conservative results and that 3D analysis is required to rigorously investigate robustness. The influence of the rise time of column loss action was investigated by Comeliau et al. [19] and a method for quantifying the maximum dynamic displacement for planar frames was proposed. A study by Fu [20] showed that for many beams designed according to current design practice, no plasticity is developed and catenary effect is not mobilised. The influence of different types of connections on robustness was investigated by Kim and Kim [21]. Studies by Ruth et al. [22] and Song and Sezen [17] showed that a dynamic factor of 2.0 is overly conservative. A new Dynamic Increase Factor (DIF) to amplify the gravity loads within the bays that are immediately affected by a suddenly removed element was proposed by Liu [23] that takes into account the specific level of gravity loads. Starossek and Haberland [24] addressed the subject of robustness measures.
The topic of the efficacy of seismic detailing according to recent codes [1] in arresting a progressive collapse and on improving structural robustness is still under discussion, and although it can be argued that seismic detailing generally contributes to improving robustness, quantification of this effect is still required [25]. Adopting Capacity Design principles alone as a prescriptive measure for improving robustness presents shortcomings similar to prescriptions given by other codes [26, 27] for addressing robustness such as the “Tie Force Method” or the “Key Element Design”, which aim at assuring structural continuity and robustness. However, these design methods do not guarantee adequate structural capacity to withstand extreme events involving column loss. On the other hand, the influence of seismic detailing to improve structural robustness is still an open issue.
These considerations motivated the study presented in this paper, which aims at quantifying structural robustness under column loss scenarios and at assessing the efficacy of seismic detailing on arresting a progressive collapse under different column loss scenarios. To this end, a numerical parametric study based on pushdown analysis was carried out on a set of reference frames, varying both mechanical and geometrical parameters. The obtained results enabled to identify trends and to quantify the effectiveness of seismic detailing in the limitation of progressive collapse.
2. FRAMEWORK OF THE STUDY
2.1. Investigated Parameters
A set of 48 structures was designed with the following variables: number of storeys, interstorey height, span, bay configuration and lateral load design scenario. The parametric variables were selected in order to cover a wide range of realistic structures [25]. The list of parameters and relevant values is presented in Table 1.
| Parametric Variable |
Variable Symbol | Values | Units |
|---|---|---|---|
| Number of storeys | N | {4; 8} | [-] |
| Interstorey height | H | {3; 4} | [m] |
| Bay span | S | {6; 10} | [m] |
| Bay layout configuration | T | {3x5; 4x4; 4x5} | [-] |
| Lateral load scenario | D | {Wind; Seismic + Wind} | [-] |
| Column loss scenario | L | {Large façade; Short façade; Corner} | [-] |
As shown in Fig. (1), each structure presents two MRFs per direction, while the remaining parts were designed to resist gravity loads only. Therefore, the beam-to-column joints of the MRFs were assumed as full strength rigid connections, whereas the joints in the secondary frame were modelled as perfectly pinned. An exception to these MRF layouts was considered for the seismically designed structures with 8 storeys and 10 m span. Indeed, for those cases, the frames in both directions were designed to be moment resisting with full strength rigid primary beam-to-column connections and cruciform cross sections for columns. The cruciform cross sections are symmetrical about the principal axes and built up by welding with a couple of steel wide flange profiles.
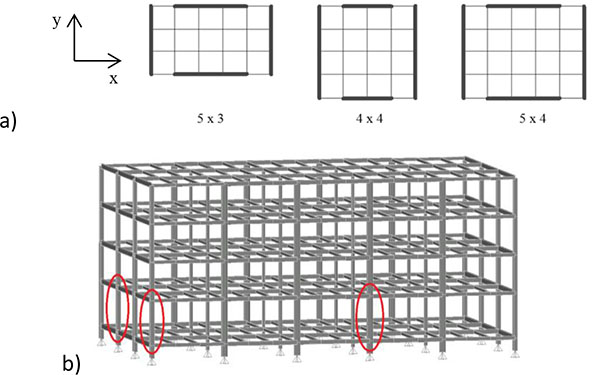
The column loss locations were defined in accordance with the UFC 2009 [27] as shown in Fig. (1b) and the following cases were considered:
- Interior column along the X direction façade (i.e. long façade);
- Interior column along the Y direction façade (i.e. short façade);
- Corner column.
2.2. Design Assumptions
The frames were designed according to the Eurocodes. In particular, the design actions and relevant loading combinations are compliant to EN1991-1-7 [26], while the verification checks and the requirements for seismic design are in accordance with EN1993-1-1 [28] and EN1998-1 [1], respectively.
The columns and the beams are in S355 steel. For the composite slab, the steel sheeting is made of S320 GD steel grade and the concrete is C30/37 class. S460 steel was adopted for column members in 2 cases only, namely for the 5×4 and 4×4 seismically designed structures with 8 storeys, 4m interstorey height and 6m span, in order to verify the N-M-V interaction Ultimate Limit State.
The gravity loads considered for the design of the building structures are summarized in Table 2. The lateral stability of the non-seismic frames may be taken into account through the introduction of lateral forces corresponding to a fraction of the gravity load [27], or as wind loads with the appropriate reduction factor [26].
| Storey | Permanent structural loads [kN/m2] | Permanent non-structural loads [kN/m2] | Live loads [kN/m2] |
|---|---|---|---|
| Ground Floor | 1.7 | 1.2 | 4.0 |
| Elevated Storeys | 1.7 | 1.4 | 3.0 |
| Roof | 1.7 | 1.2 | 0.4 |
In terms of wind action, a basic wind velocity of 30 m/s was considered on a Type III terrain category, which is characteristic of suburban areas. The seismic action was defined according to the EN 1998-1 [1]. The main parameters for the seismic action definition are presented in Table 3.
| Seismic action type | Soil type | Importance Class | Ductility class | Behaviour factor q | Peak ground acceleration [g] |
|---|---|---|---|---|---|
| Types 1 and 2 | C | II | DCH | 6.5 | 0.25 |
The shapes of members of the designed frames are summarized in Tables 4 and 5, where it can be noted that seismic resistant MRFs are typically characterized by the larger profiles for what concerns the size of columns, whereas generally larger beam cross sections were adopted for the wind designed structures.
| MODEL # | N | H | S | T | D | MRF Beam Sections - XZ PLANES | MRF Beam Sections - YZ PLANES | ||||
|---|---|---|---|---|---|---|---|---|---|---|---|
| (*) | Gr.-2nd St. | 3rd-5th St.(*) | 6th-8th St. | Gr.-2nd St. | 3rd-5th St.(*) | 6th-8th St. | |||||
| - | - | m | m | - | - | - | - | - | - | - | - |
| 1-3 | 4 | 3 | 6 | 5x3 | Wind | IPE 330 | IPE 300 | IPE 400 | IPE 360 | 0 | |
| 4-6 | 4 | 3 | 6 | 5x3 | Seismic+Wind | IPE 330 | IPE 330 | IPE 400 | IPE 360 | 0 | |
| 7-9 | 4 | 3 | 6 | 4x4 | Wind | IPE 400 | IPE 360 | IPE 360 | IPE 330 | 0 | |
| 10-12 | 4 | 3 | 6 | 4x4 | Seismic+Wind | IPE 400 | IPE 400 | IPE 360 | IPE 330 | 0 | |
| 13-15 | 4 | 3 | 6 | 5x4 | Wind | IPE 360 | IPE 330 | IPE 400 | IPE 360 | 0 | |
| 16-18 | 4 | 3 | 6 | 5x4 | Seismic+Wind | IPE 360 | IPE 330 | IPE 360 | IPE 360 | 0 | |
| 19-21 | 4 | 3 | 10 | 5x3 | Wind | IPE 400 | IPE 400 | IPE 500 | IPE 450 | 0 | |
| 22-24 | 4 | 3 | 10 | 5x3 | Seismic+Wind | IPE 450 | IPE 450 | IPE 500 | IPE 360 | 0 | |
| 25-27 | 4 | 3 | 10 | 4x4 | Wind | IPE 500 | IPE 450 | IPE 450 | IPE 400 | 0 | |
| 28-30 | 4 | 3 | 10 | 4x4 | Seismic+Wind | IPE 600 | IPE 500 | IPE 450 | IPE 400 | 0 | |
| 31-33 | 4 | 3 | 10 | 5x4 | Wind | IPE 450 | IPE 400 | IPE 500 | IPE 450 | 0 | |
| 34-36 | 4 | 3 | 10 | 5x4 | Seismic+Wind | IPE 550 | IPE 450 | IPE 450 | IPE 400 | 0 | |
| 37-39 | 4 | 4 | 6 | 5x3 | Wind | IPE 450 | IPE 400 | IPE 550 | IPE 500 | 0 | |
| 40-42 | 4 | 4 | 6 | 5x3 | Seismic+Wind | IPE 360 | IPE 330 | IPE 450 | IPE 400 | 0 | |
| 43-45 | 4 | 4 | 6 | 4x4 | Wind | IPE 550 | IPE 500 | IPE 500 | IPE 450 | 0 | |
| 46-48 | 4 | 4 | 6 | 4x4 | Seismic+Wind | IPE 400 | IPE 360 | IPE 400 | IPE 360 | 0 | |
| 49-51 | 4 | 4 | 6 | 5x4 | Wind | IPE 500 | IPE 450 | IPE 550 | IPE 500 | 0 | |
| 52-54 | 4 | 4 | 6 | 5x4 | Seismic+Wind | IPE 400 | IPE 360 | IPE 450 | IPE 400 | 0 | |
| 55-57 | 4 | 4 | 10 | 5x3 | Wind | IPE 600 | IPE 500 | HE 600 A | HE 550 A | 0 | |
| 58-60 | 4 | 4 | 10 | 5x3 | Seismic+Wind | IPE 500 | IPE 450 | IPE 600 | IPE 400 | 0 | |
| 61-63 | 4 | 4 | 10 | 4x4 | Wind | HE 600 A | HE 550 A | HE 550 A | HE 500 A | 0 | |
| 64-66 | 4 | 4 | 10 | 4x4 | Seismic+Wind | IPE 600 | IPE 600 | IPE 500 | IPE 450 | 0 | |
| 67-69 | 4 | 4 | 10 | 5x4 | Wind | HE 600 A | HE 500 A | HE 600 A | HE 500 A | 0 | |
| 70-72 | 4 | 4 | 10 | 5x4 | Seismic+Wind | IPE 600 | IPE 500 | IPE 600 | IPE 450 | 0 | |
| 73-75 | 8 | 3 | 6 | 5x3 | Wind | IPE 550 | IPE 500 | IPE 450 | IPE 600 | IPE 550 | IPE 500 |
| 76-78 | 8 | 3 | 6 | 5x3 | Seismic+Wind | IPE 500 | IPE 450 | IPE 400 | IPE 600 | IPE 500 | IPE 400 |
| 79-81 | 8 | 3 | 6 | 4x4 | Wind | HE 600 A | HE 550 A | HE 500 A | IPE 550 | IPE 500 | IPE 450 |
| 82-84 | 8 | 3 | 6 | 4x4 | Seismic+Wind | IPE 600 | IPE 500 | IPE 400 | IPE 550 | IPE 450 | IPE 360 |
| 85-87 | 8 | 3 | 6 | 5x4 | Wind | IPE 550 | IPE 500 | IPE 450 | IPE 600 | IPE 550 | IPE 500 |
| 88-90 | 8 | 3 | 6 | 5x4 | Seismic+Wind | IPE 550 | IPE 500 | IPE 450 | IPE 600 | IPE 500 | IPE 360 |
| 91-93 | 8 | 3 | 10 | 5x3 | Wind | HE 550 A | HE 500 A | HE 450 A | HE 700 A | HE 650 A | HE 600 A |
| 94-96 | 8 | 3 | 10 | 5x3 | Seismic+Wind | IPE 550 | IPE 550 | IPE 550 | IPE 550 | IPE 500 | IPE 360 |
| 97-99 | 8 | 3 | 10 | 4x4 | Wind | HE 700 A | HE 650 A | HE 600 A | HE 600 A | HE 550 A | HE 500 A |
| 100-102 | 8 | 3 | 10 | 4x4 | Seismic+Wind | IPE 550 | IPE 550 | IPE 550 | IPE 550 | IPE 500 | IPE 360 |
| 103-105 | 8 | 3 | 10 | 5x4 | Wind | HE 600 A | HE 550 A | HE 500 A | HE 650 A | HE 600 A | HE 550 A |
| 106-108 | 8 | 3 | 10 | 5x4 | Seismic+Wind | IPE 550 | IPE 550 | IPE 550 | IPE 550 | IPE 500 | IPE 360 |
| 109-111 | 8 | 4 | 6 | 5x3 | Wind | HE 600 A | HE 550 A | HE 500 A | HE 800 A | HE 700 A | HE 600 A |
| 112-114 | 8 | 4 | 6 | 5x3 | Seismic+Wind | IPE 550 | IPE 500 | IPE 400 | HE 700 A | HE 400 A | HE 400 A |
| 115-117 | 8 | 4 | 6 | 4x4 | Wind | HE 800 A | HE 700 A | HE 600 A | HE 600 A | HE 500 A | HE 450 A |
| 118-120 | 8 | 4 | 6 | 4x4 | Seismic+Wind | HE 600 A | HE 500 A | HE 400 A | HE 500 A | HE 450 A | HE 360 A |
| 121-123 | 8 | 4 | 6 | 5x4 | Wind | HE 700 A | HE 650 A | HE 600 A | HE 700 A | HE 650 A | HE 600 A |
| 124-126 | 8 | 4 | 6 | 5x4 | Seismic+Wind | HE 550 A | HE 450 A | HE 360 A | HE 500 A | HE 450 A | HE 360 A |
| 127-129 | 8 | 4 | 10 | 5x3 | Wind | HE 800 A | HE 700 A | HE 650 A | HE 1000 A | HE 900 A | HE 800 A |
| 130-132 | 8 | 4 | 10 | 5x3 | Seismic+Wind | IPE 550 | IPE 550 | IPE 550 | HE 550 A | HE 500 A | HE 280 A |
| 133-135 | 8 | 4 | 10 | 4x4 | Wind | HE 1000 A | HE 900 A | HE 800 A | HE 800 A | HE 700 A | HE 650 A |
| 136-138 | 8 | 4 | 10 | 4x4 | Seismic+Wind | IPE 550 | IPE 550 | IPE 550 | HE 550 A | HE 500 A | HE 280 A |
| 139-141 | 8 | 4 | 10 | 5x4 | Wind | HE 900 A | HE 800 A | HE 700 A | HE 900 A | HE 800 A | HE 700 A |
| 142-144 | 8 | 4 | 10 | 5x4 | Seismic+Wind | IPE 550 | IPE 550 | IPE 550 | HE 550 A | HE 500 A | HE 280 A |
2.3. Monitored Parameters
The robustness of steel frames is typically evaluated by the Alternative Load Path method (ALP). However, as shown by Khandelwal et al. [14] the ALP cannot provide further information about the reserve capacity of the system. Several alternative approaches to measure the robustness have been proposed by different Authors based on risk [30], energy [12] or on deterministic indexes. However, it is not currently possible to establish which is the most accurate [31, 32].
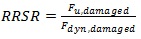
In the present study a local deterministic robustness measure was adopted, based on the Residual Reserve Strength Ratio (RRSR) of the structural system. The RRSR is defined as the ratio between the ultimate capacity of the system in the damaged configuration (Fu,damaged) and the equivalent dynamically amplified force for which the system reaches equilibrium (Fdyn,damaged), as given by the following equation:
 |
(1) |
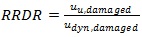
In order to measure the rotational reserve capacity of the structures, a ductility measure was introduced and designated as Residual Reserve Ductility Ratio (RRDR). The RRDR is defined as the ratio between the system’s displacement immediately prior to global collapse (uu,damaged) and the equivalent dynamic displacement at equilibrium (udyn,damaged), as given by the following expression:
 |
(2) |
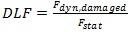
Moreover, Dynamic Load Factors (DLFs) were computed as follows:
 |
(3) |
Where Fdyn,damaged is the equivalent peak dynamic load obtained from the nonlinear static pushdown response at equilibrium and Fstat is the value of the static gravity loads on the resisting element prior to removal as introduced by Izzudin et al. [12].
| MODEL # | N | H | S | T | D | MRF Column Sections - XZ PLANES | MRF Column Sections - YZ PLANES | ||||
|---|---|---|---|---|---|---|---|---|---|---|---|
| (*) | Found..- -2nd St. |
2nd- -5th St.(*) |
5th- -8th St. |
Found.- -2nd St. |
2nd- -5th St.(*) |
5th- -8th St. |
|||||
| - | - | m | m | - | - | - | - | - | - | - | - |
| 1-3 | 4 | 3 | 6 | 5x3 | Wind | HE 280 A | HE 280 A | HE 300 A | HE 300 A | ||
| 4-6 | 4 | 3 | 6 | 5x3 | Seismic+Wind | HE 450 B | HE 450 B | HE 500 B | HE 340 B | ||
| 7-9 | 4 | 3 | 6 | 4x4 | Wind | HE 340 A | HE 320 A | HE 260 A | HE 240 A | ||
| 10-12 | 4 | 3 | 6 | 4x4 | Seismic+Wind | HE 450 B | HE 450 B | HE 450 B | HE 300 A | ||
| 13-15 | 4 | 3 | 6 | 5x4 | Wind | HE 300 A | HE 280 A | HE 280 A | HE 260 A | ||
| 16-18 | 4 | 3 | 6 | 5x4 | Seismic+Wind | HE 500 B | HE 450 A | HE 450 B | HE 340 A | ||
| 19-21 | 4 | 3 | 10 | 5x3 | Wind | HE 360 B | HE 360 A | HE 450 A | HE 450 A | ||
| 22-24 | 4 | 3 | 10 | 5x3 | Seismic+Wind | HE 800 B | HE 600 A | HE 1000 B | HE 800 B | ||
| 25-27 | 4 | 3 | 10 | 4x4 | Wind | HE 450 B | HE 450 A | HE 360 A | HE 360 A | ||
| 28-30 | 4 | 3 | 10 | 4x4 | Seismic+Wind | HE 900 B | HE 700 B | HE 900 B | HE 650 A | ||
| 31-33 | 4 | 3 | 10 | 5x4 | Wind | HE 360 B | HE 360 A | HE 360 A | HE 360 A | ||
| 34-36 | 4 | 3 | 10 | 5x4 | Seismic+Wind | HE 1000 B | HE 800 B | HE 900 B | HE 700 B | ||
| 37-39 | 4 | 4 | 6 | 5x3 | Wind | HE 300 B | HE 280 A | HE 360 A | HE 340 A | ||
| 40-42 | 4 | 4 | 6 | 5x3 | Seismic+Wind | HE 600 B | HE 450 A | HE 600 B | HE 450 A | ||
| 43-45 | 4 | 4 | 6 | 4x4 | Wind | HE 400 A | HE 360 A | HE 300 A | HE 280 A | ||
| 46-48 | 4 | 4 | 6 | 4x4 | Seismic+Wind | HE 700 B | HE 450 A | HE 500 B | HE 360 A | ||
| 49-51 | 4 | 4 | 6 | 5x4 | Wind | HE 320 B | HE 300 A | HE 320 A | HE 300 A | ||
| 52-54 | 4 | 4 | 6 | 5x4 | Seismic+Wind | HE 650 B | HE 500 A | HE 600 B | HE 400 A | ||
| 55-57 | 4 | 4 | 10 | 5x3 | Wind | HE 360 B | HE 340 A | HE 450 B | HE 450 A | ||
| 58-60 | 4 | 4 | 10 | 5x3 | Seismic+Wind | HE 1000 B | HE 900 A | HE 1000 B | HE 900 A | ||
| 61-63 | 4 | 4 | 10 | 4x4 | Wind | HE 500 A | HE 450 A | HE 360 B | HE 360 A | ||
| 64-66 | 4 | 4 | 10 | 4x4 | Seismic+Wind | HE 1000 B | HE 1000 B | HE 1000 B | HE 900 B | ||
| 67-69 | 4 | 4 | 10 | 5x4 | Wind | HE 360 B | HE 360 B | HE 400 A | HE 400 A | ||
| 70-72 | 4 | 4 | 10 | 5x4 | Seismic+Wind | HE 1000 B | HE 1000 B | HE 1000 B | HE 900 B | ||
| 73-75 | 8 | 3 | 6 | 5x3 | Wind | HE 320 A | HE 320 A | HE 300 A | HE 450 A | HE 400 A | HE 360 A |
| 76-78 | 8 | 3 | 6 | 5x3 | Seismic+Wind | HE 650 B | HE 550 A | HE 400 A | HE 650 B | HE 550 A | HE 450 A |
| 79-81 | 8 | 3 | 6 | 4x4 | Wind | HE 400 A | HE 400 A | HE 360 A | HE 340 A | HE 320 A | HE 300 A |
| 82-84 | 8 | 3 | 6 | 4x4 | Seismic+Wind | HE 800 B | HE 700 A | HE 550 A | HE 600 B | HE 500 A | HE 400 A |
| 85-87 | 8 | 3 | 6 | 5x4 | Wind | HE 400 A | HE 400 A | HE 360 A | HE 360 A | HE 340 A | HE 320 A |
| 88-90 | 8 | 3 | 6 | 5x4 | Seismic+Wind | HE 800 B | HE 650 A | HE 500 A | HE 800 B | HE 650 A | HE 450 A |
| 91-93 | 8 | 3 | 10 | 5x3 | Wind | HE 500 A | HE 450 A | HE 400 A | HE 550 A | HE 550 A | HE 500 A |
| 94-96 | 8 | 3 | 10 | 5x3 | Seismic+Wind | X HE 800 B | X HE 550 B | X HE 550 B | X HE 800 B | X HE 550 B | X HE 550 B |
| 97-99 | 8 | 3 | 10 | 4x4 | Wind | HE 650 A | HE 600 A | HE 500 A | HE 450 A | HE 450 A | HE 400 A |
| 100-102 | 8 | 3 | 10 | 4x4 | Seismic+Wind | X HE 800 B | X HE 550 B | X HE 550 B | X HE 800 B | X HE 550 B | X HE 550 B |
| 103-105 | 8 | 3 | 10 | 5x4 | Wind | HE 550 A | HE 500 A | HE 450 A | HE 500 A | HE 500 A | HE 450 A |
| 106-108 | 8 | 3 | 10 | 5x4 | Seismic+Wind | X HE 800 B | X HE 550 B | X HE 550 B | X HE 800 B | X HE 550 B | X HE 550 B |
| 109-111 | 8 | 4 | 6 | 5x3 | Wind | HE 450 A | HE 400 A | HE 360 A | HE 550 A | HE 500 A | HE 450 A |
| 112-114 | 8 | 4 | 6 | 5x3 | Seismic+Wind | HE 900 B | HE 700 B | HE 500 A | HE 1000 B | HE 900 A | HE 800 A |
| 115-117 | 8 | 4 | 6 | 4x4 | Wind | HE 600 A | HE 550 A | HE 500 A | HE 450 A | HE 450 A | HE 400 A |
| 118-120 | 8 | 4 | 6 | 4x4 | Seismic+Wind | HE 1000 B | HE 1000 B | HE 1000 B | HE 800 B | HE 700 A | HE 500 A |
| 121-123 | 8 | 4 | 6 | 5x4 | Wind | HE 500 A | HE 450 A | HE 400 A | HE 500 A | HE 450 A | HE 400 A |
| 124-126 | 8 | 4 | 6 | 5x4 | Seismic+Wind | HE 1000 B | HE 800 A | HE 600 A | HE 900 B | HE 700 A | HE 550 A |
| 127-129 | 8 | 4 | 10 | 5x3 | Wind | HE 550 A | HE 550 A | HE 500 A | HE 800 A | HE 700 A | HE 650 A |
| 130-132 | 8 | 4 | 10 | 5x3 | Seismic+Wind | HE 1000 B | HE 700 B | HE 700 B | HE 1000 B | HE 700 B | HE 700 B |
| 133-135 | 8 | 4 | 10 | 4x4 | Wind | HE 800 A | HE 700 A | HE 650 A | HE 600 A | HE 550 A | HE 500 A |
| 136-138 | 8 | 4 | 10 | 4x4 | Seismic+Wind | HE 1000 B | HE 700 B | HE 700 B | HE 1000 B | HE 700 B | HE 700 B |
| 139-141 | 8 | 4 | 10 | 5x4 | Wind | HE 650 A | HE 600 A | HE 550 A | HE 650 A | HE 600 A | HE 550 A |
| 142-144 | 8 | 4 | 10 | 5x4 | Seismic+Wind | HE 1000 B | HE 700 B | HE 700 B | HE 1000 B | HE 700 B | HE 700 B |
(*) 2nd-4th St. for structures the 4 storey structures.
NOTE: Column sections preceeded by “X” correspond to cruciform type cross sections.
3. PUSHDOWN ANALYSIS
3.1. Analysis Methodology
Three procedures are generally used to assess the robustness for progressive collapse, namely the Linear Static Procedure (LSP), the Nonlinear Static Procedure (NSP) and the Nonlinear Dynamic Procedure (NDP) [27]. In this study, the NSP was adopted and combined with the energy balance method proposed by Izzuddin et al. [12], which allows computing the system pseudo-static capacity by imposing a zero kinetic energy condition. The methodology consists of three stages, namely: i) Determination of the nonlinear static response of the structure under gravitational loading; ii) Simplified dynamic assessment through energy balance to establish the maximum dynamic response and iii) Ductility assessment of the connections. The computation of the response implicitly assumes that the part of the structure directly affected by the column removal behaves as a Single Degree of Freedom (SDOF) system. Jahromi [16] demonstrated the validity of this hypothesis for the assessment of structural robustness .
The typical structural response curve is shown in Fig. (2) and consists of an initial linear elastic segment, followed by a nonlinear transition due to geometric and material nonlinearity, and finally by an eventual hardening phase due to catenary effect, or by a softening phase due to buckling or failure of structural elements. The computation of the response implicitly assumes that the zone directly affected by the column loss behaves as an equivalent SDOF system.
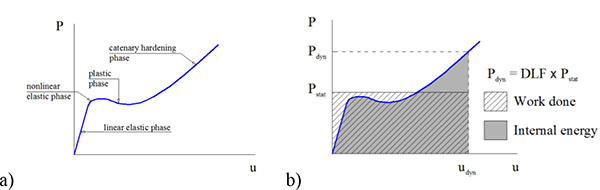
The application of the energy balance method implies the computation of both the external work done, which is equal to the product of the axial force in the column prior to removal and the vertical displacement at each step of the pushdown, and the internal energy, which is given by integral of the Force-Displacement system response curve. When the work done equals the internal energy, the system reaches equilibrium for a vertical displacement equal to the dynamic displacement. In cases in which energy balance is not achieved, the zero kinetic energy condition is not reached and the system fails. Subsequently, the maximum dynamic displacement is compared to the ductility limit, taken as the minimum value at which the ductility demand exceeds the ductility capacity.
3.2. Modelling Assumptions
The numerical simulations were conducted using the finite element analysis software SAP 2000. The beams that were designed for gravity loads only were considered as pinned at both ends, whereas full-strength rigid connections were considered at the ends of the MRF beams [25, 33]. The beams of MRF spans are all-steel members without any composite interaction with the slab.
The geometric nonlinearities were considered through the P-Delta formulation under large displacements. Material nonlinearity was modelled through lumped plasticity with discrete plastic hinges distributed along the elements. The modelling parameters and acceptance criteria for the plastic hinges were adopted in accordance with the FEMA Report 356 [29].
The pushdown analyses were carried out under displacement control until global structural failure was reached. This method allows estimating the equivalent dynamic displacement at equilibrium, but it accounts for neither the oscillation around the equilibrium position nor the effect of damping. For the column removal, the internal forces were initially determined for the accidental load combination given in the EN 1991-1-7 [26]. Subsequently, increasing vertical displacements were imposed to the node where the equivalent column loads were applied. In the following Sections, the results from pushdown analyses are shown in terms of vertical force-displacement pushdown response curves.
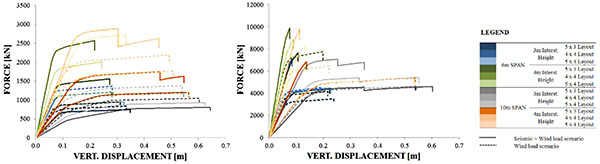
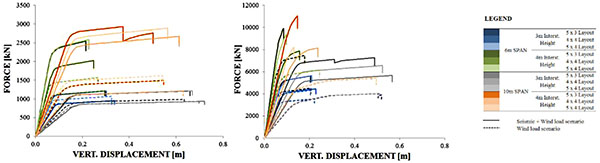
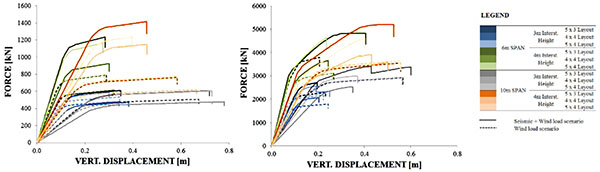
3.3. Discussion of Results: Failure Mechanisms
The conducted pushdown analyses are shown in Figs. (3-5), for the 4 and 8 storey structures under large façade, short façade and corner column loss scenarios.
The pushdown analyses enabled to identify three types of global failure mechanism (see Fig. 6), namely:
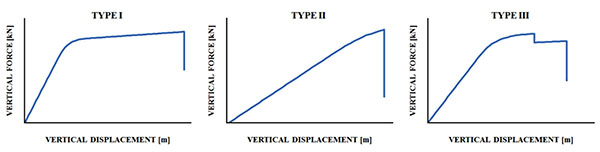
- Type I, which is characterized by high ductility due to the distribution of plasticity throughout the beam elements of the directly affected zone;
- Type II, which is characterized by poor ductility and is typically conditioned by brittle column failure between the ground floor and the first storey and
- Type III, corresponding to a semi-ductile mechanism that is characterized either by column failure in the segment between the last elevated storey and the roof or by simultaneous failure in beam and column members.
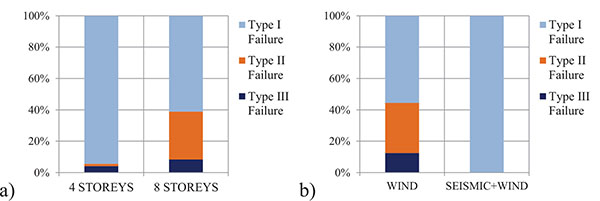
The occurrence distributions of type the failure mode are shown in Fig. (7) as a function of the number of storeys and of the lateral load design scenario. In particular, Fig. (7) shows that the ductile Type I failure is clearly dominant for the 4-storey buildings, while greater susceptibility to low ductility collapse modes can be observed for the 8-storey structures. For what concerns the influence of the lateral load design scenario, Fig. (7b) shows that all seismically designed structures present ductile failure, whereas for the strong beam – weak column structures, about 40% of failures were semi-ductile or brittle.
3.4. Discussion of Results: Residual Reserve Strength and Ductility Ratios
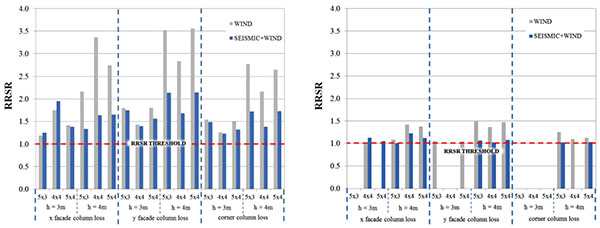
The RRSRs for the 4-storey structures are presented in Fig. (8). The minimum RRSR value for a structure is equal to 1.0, and it is obtained when the equivalent dynamically amplified force is equal to the ultimate capacity of the system. In those cases where the internal energy did not balance the external work done, equilibrium was not reached and the RRSR was taken as equal to 0.
The results show that the 10 m span structures present lower values of RRSR than the 6 m span ones. For the 10 m span structures, several cases of failure occurred and small RRSR values can be observed.
The numerical results indicate that the wind designed structures (strong beam – weak column) present higher values of RRSR than the seismically designed frames. The Type I mechanism is predominant for 4-storey buildings, where Vierendeel action develops, allowing for larger overall ductility. The activation of the Vierendeel mechanism requires girders to be stiff in bending so as to enable internal load redistribution following column loss. Considering that the wind designed structures present deeper beams, their capacity is comparatively higher than that of the seismic designed structures.
The buildings with taller interstorey height are characterized by the higher RRSR values, which can be explained considering that these frames have deeper girders than those belonging to frames with shorter interstorey height. The larger size of beams depends on the need to control storey drifts, which is more demanding for taller buildings.
The location of column loss significantly influences RRSRs as also observed in [34, 35]. The cases for corner column loss are characterized by limited redistribution capacity, which corresponds to a reduced robustness because the alternative load path involves only a reduced portion of moment resisting bays. However, column loss location by itself does not enable to establish a tendency for RRSRs. On the contrary, the MRF plan layout plays an important role. For structures where the MRF in one direction is composed of few elements (e.g. 4×4 bay layout in the x-z plan), design leads to cross sections with very high resistance, leading to higher robustness levels. A small variation of the number of spans of the plane of the directly affected zone showed to have an influence on RRSRs.
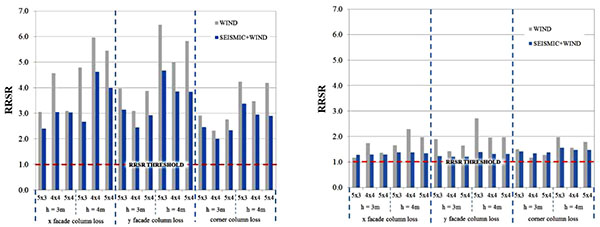
The RRSRs for the 8-storey structures are presented in Fig. (9), where it can be noted that no collapses occurred and that those frames present higher robustness than 4-storey structures. The large span structures exhibit the lower RRSR values. Regarding the influence of seismic detailing, numerical results showed that the strong beam – weak column (wind designed) consistently have higher values of RRSR.
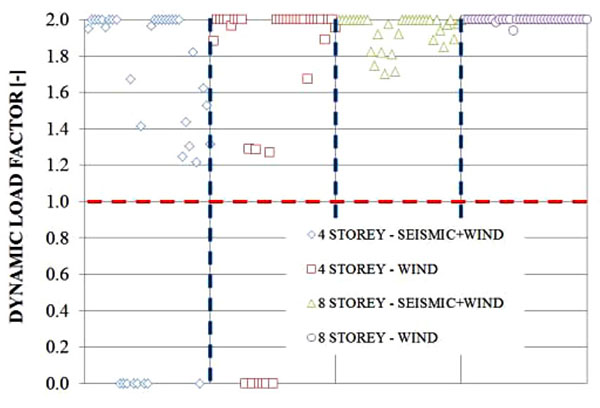
Even though most 8-storey wind designed structures are characterised by a non-ductile collapse mechanism, most structures are able to arrest collapse while remaining in the elastic domain, as seen by the estimated DLFs (previously defined in Eq. (3)) shown in Fig. (10). The 4-storey structures are typically able to exploit the post-yield regime, although their lower robustness resulted in some collapses. Most 8-storey structures, namely the wind designed structures, remained in the elastic regime (DLF=2.0).
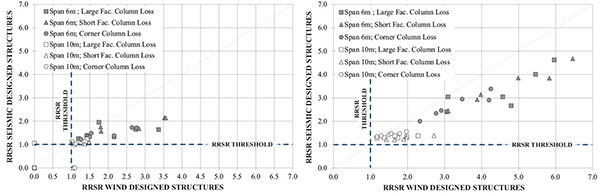
A comparison between the RRSR for the seismic-designed structures (weak beam – strong column) and the wind-designed structures (weak column – strong beam) is presented in Fig. (11), showing that the latter generally present the higher robustness, and that the 8 storey structures tend to have the higher RRSR values. The seismic designed structures present a comparatively low dispersion of RRSRs for non-collapsed structures, with the 4-storey structures presenting RRSR varying between 1.01 and 2.14, and the 8-storey ones varying between 1.20 and 4.68. The value dispersion is considerably lower for the 10 m span structures.
The comparison of Residual Reserve Ductility Ratios (defined in Eq. (2)) is presented in Fig. (12), where a value of 0 for the RRDR represents a structure for which equilibrium subsequent to column loss could not be reached and a value of 1 represents the minimum value for the ductility ratio, corresponding to the case in which the maximum dynamic displacement equals the system’s ultimate displacement in the damaged state.
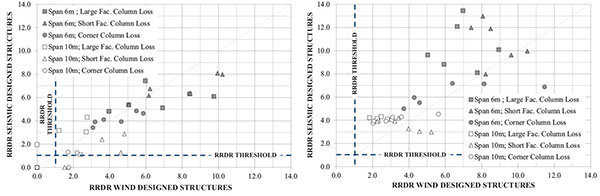
When comparing the results in terms of the number of storeys, the RRSDs for the four storey structures present similar values for both seismic and wind designed structures, whereas for the eight storey structures, the ductility ratios tend to present higher values, which is consistent with the Capacity Design methodology. For the four storey structures, the results indicate that the type of lateral load design scenario is not a distinguishing factor in terms of ductility. Indeed, for low-rise wind-designed structures the failure modes are of Type I for 89% of cases, Type II for 3% of cases and 8% for Type III, implying that collapse is typically controlled by the Vierendeel action, for which beam ductility is key. Given that the wind-designed structures present weak column – strong beam frames, the beam members present high ductility capacities, which are on par with the ductility capacities displayed by the seismically designed structures.
The resistance to progressive collapse depends on local behaviour, namely on bay/MRF layout, local beam and column capacities and number of elements above the removed column which can be mobilized through Vierendeel action.
The higher dispersion of RRSRs for the wind-designed structures is due to the occurrence of all three types of collapse, leading to differences case by case in terms of ultimate capacity and subsequently of the RRSR values.
Although no direct relation between seismic provisions and enhanced robustness can be observed, it can be recognized that seismic detailing results in more predictable and ductile global failure modes. However, wind-designed structures are still capable providing sufficient robustness.
Numerical results highlight that the robustness mostly depends on the capacity of the beam elements of the directly affected zone.
CONCLUSION
A parametric study based on pushdown analysis was conducted which investigated the behaviour of 48 MRF structures for three column loss scenarios (namely a total number of 144 analysis cases). The robustness was measured through Residual Reserve Strength Ratios and three types of global collapse mechanisms were identified, providing different ductility levels.
It was observed that the wind-designed 8-storey buildings are prone to semi-ductile or brittle global failure modes.
The numerical results also showed that 4-storey – 10 m span structures exhibit progressive collapse, whereas no collapses occurs for the 8-storey – 10 m span structures. The medium rise 8-storey structures provided higher values of robustness than low-rise structures, indicating that the number of elements above the removed column that can be mobilized through Vierendeel action is a key parameter in arresting a progressive collapse.
The obtained Dynamic Load Factors (DLF) highlight that 4-storey structures are more sensitive to post yield structural ductility, while 8-storey strong beam – weak column structures tend to remain elastic.
The importance of seismic detailing for robustness was also investigated, and results show that structures designed according to the EN1998-1 [1] have smaller Residual Reserve Strength Ratios (RRSRs), although the failure modes are more predictable.
Numerical results show that wind-designed frames with strong beam – weak column details respond in the elastic domain after column loss, displaying higher RRSR values. These outcomes are mainly due to the strength and stiffness properties of the girders of the MRF parts above the directly affected zone, since wind-designed frames have deeper girders than seismically designed structures. Therefore, based on the obtained results it can be observed that capacity design principles recommended by EN1998-1 [1] do not guarantee adequate robustness under column loss scenarios.
LIST OF SYMBOLS
| Fu, damaged | = Ultimate force capacity of the system in the damaged configuration |
| Fdyn, damaged | = Equivalent peak dynamic load obtained from the nonlinear static pushdown response at equilibrium for the zero kinetic energy condition |
| Uu, damaged | = Ultimate displacement capacity of the system in the damaged configuration |
| Udyn, damaged | = Equivalent peak dynamic displacement obtained from the nonlinear static pushdown response at equilibrium for the zero kinetic energy condition |
| Fstat | = Value of the static gravity loads on the resisting element prior to notional removal |
LIST OF ABBREVIATIONS
| ALP | = Alternative Load Path method |
| DLF | = Dynamic Load Factor |
| GSA | = General Services Administration |
| LSP | = Linear Static Procedure |
| MRF | = Moment Resisting Frame |
| NDP | = Nonlinear Dynamic Procedure |
| NSP | = Nonlinear Static Procedure |
| RRDR | = Residual Reserve Ductility Ratio |
| RRSR | = Residual Reserve Strength Ratio |
| SDOF | = Single Degree Of Freedom |
| UFC | = United Facilities Criteria |
CONFLICT OF INTEREST
The authors confirm that this article content has no conflict of interest.
ACKNOWLEDGEMENTS
Declared none.
REFERENCES
| [1] | CEN, EN 1998-1 – Eurocode 8 – Design of buildings for earthquake resistance – Part 1: General rules, seismic actions and rules for buildings. 2004. |
| [2] | M. D’Aniello, R. Landolfo, V. Piluso, and G. Rizzano, "Ultimate behaviour of steel beams under non-uniform bending", J. Constr. Steel Res., vol. 78, pp. 144-158, 2012. [http://dx.doi.org/10.1016/j.jcsr.2012.07.003] |
| [3] | E.M. Güneyisi, M. D'Aniello, R. Landolfo, and K. Mermerdaş, "A novel formulation of the flexural overstrength factor for steel beams", J. Constr. Steel Res., vol. 90, pp. 60-71, 2013. [http://dx.doi.org/10.1016/j.jcsr.2013.07.022] |
| [4] | M. D'Aniello, E.M. Güneyisi, R. Landolfo, and K. Mermerdaş, "Analytical prediction of available rotation capacity of cold-formed rectangular and square hollow section beams", Thin-wall. Struct., vol. 77, pp. 141-152, 2014. [http://dx.doi.org/10.1016/j.tws.2013.09.015] |
| [5] | E.M. Güneyisi, M. D'Aniello, R. Landolfo, and K. Mermerdaş, "Prediction of the flexural overstrength factor for steel beams using artificial neural network", Steel Compos. Struct., vol. 17, no. 3, pp. 215-236, 2014. [http://dx.doi.org/10.12989/scs.2014.17.3.215] |
| [6] | M. D'Aniello, E.M. Güneyisi, R. Landolfo, and K. Mermerdaş, "Predictive models of the flexural overstrength factor for steel thin-walled circular hollow section beams", Thin-wall. Struct., vol. 94, pp. 67-78, 2015. [http://dx.doi.org/10.1016/j.tws.2015.03.020] |
| [7] | G. Della Corte, M. D’Aniello, and F.M. Mazzolani, "Inelastic response of shear links with axial restraints: Numerical vs. analytical results", In: 5th International Conference on Advances in Steel Structures, ICASS, Singapore, 2007. |
| [8] | G. Della Corte, M. D’Aniello, and R. Landolfo, "Analytical and numerical study of plastic overstrength of shear links", J. Construct. Steel Res., vol. 82, pp. 19-32, 2013. [http://dx.doi.org/10.1016/j.jcsr.2012.11.013] |
| [9] | A. Tenchini, M. D’Aniello, C. Rebelo, R. Landolfo, L.S. da Silva, and L. Lima, "Seismic performance of dual-steel moment resisting frames", J. Constr. Steel Res., vol. 101, pp. 437-454, 2014. [http://dx.doi.org/10.1016/j.jcsr.2014.06.007] |
| [10] | A. Tenchini, M. D'Aniello, C. Rebelo, R. Landolfo, L. da Silva, and L. Lima, "High strength steel in chevron concentrically braced frames designed according to Eurocode 8", Eng. Struct., vol. 124, pp. 167-185, 2016. [http://dx.doi.org/10.1016/j.engstruct.2016.06.001] |
| [11] | S. El-Tawil, H. Li, and S. Kunnath, "Computational simulation of gravity-induced progressive collapse of steel-frame buildings: current trends and future research needs", J. Struct. Eng., vol. 140, no. 8, p. A2513001, 2014. |
| [12] | B.A. Izzuddin, A.G. Vlassis, A.Y. Elghazouli, and D.A. Nethercot, "Progressive collapse of multi-story buildings due to sudden column loss – part I: simplified assessment framework", Eng. Struct., vol. 30, pp. 1308-1318, 2008. [http://dx.doi.org/10.1016/j.engstruct.2007.07.011] |
| [13] | D.G. Lu, S.S. Cui, P.Y. Song, and Z.H. Chen, "Robustness assessment for progressive collapse of framed structures using pushdown analysis method", In: REC, 4thInternational Workshop on Reliable Engineering Computing: Singapore, 2010. |
| [14] | K. Khandelwal, S. El-Tawil, S. Kunnath, and H. Lew, "Macromodel-based simulation of progressive collapse: steel frame structures", J. Struct. Eng., vol. 134, no. 7, pp. 1070-1078, 2008. [http://dx.doi.org/10.1061/(ASCE)0733-9445(2008)134:7(1070)] |
| [15] | J. Hayes, S. Woodson, R. Pekelnicky, C. Poland, W. Corley, and M. Sozen, "Can strengthening for earthquake improve blast and progressive collapse resistance?", J. Struct. Eng., vol. 131, no. 8, pp. 1157-1177, 2005. [http://dx.doi.org/10.1061/(ASCE)0733-9445(2005)131:8(1157)] |
| [16] | H. Jahromi, "Progressive Collapse of Building Structures – Influence of Membrane Action in Floor Slabs", MSc Thesis,, Department of Civil and Environmental Engineering, Imperial College London, London, 2009. |
| [17] | B.I. Song, and H. Sezen, "Experimental and analytical progressive collapse assessment of a steel frame building", Eng. Struct., vol. 56, pp. 664-672, 2013. [http://dx.doi.org/10.1016/j.engstruct.2013.05.050] |
| [18] | Y. Alashker, L. Honghao, and S. El-Tawil, "Approximations in progressive collapse modelling", J. Struct. Eng., vol. 137, pp. 914-924, 2011. [http://dx.doi.org/10.1061/(ASCE)ST.1943-541X.0000452] |
| [19] | L. Comeliau, J.F. Demonceau, and J.P. Jaspart, "Robustness of steel and composite buildings under impact loading", In: E. Batista, P. Vellasco, and L. de Lima, Eds., Proceedings of SDSS’Rio 2010 Stability and Ductility of Steel Structures., Rio de Janeiro, Brazil, 2010. |
| [20] | F. Fu, "3-D nonlinear dynamic progressive collapse analysis of multi-storey steel composite frame buildings – Parametric study", Eng. Struct., vol. 32, pp. 3974-3980, 2010. [http://dx.doi.org/10.1016/j.engstruct.2010.09.008] |
| [21] | T. Kim, and J. Kim, "Collapse analysis of steel moment frames with various seismic connections", J. Constr. Steel Res., vol. 65, pp. 1316-1322, 2009. [http://dx.doi.org/10.1016/j.jcsr.2008.11.006] |
| [22] | P. Ruth, K. Marchand, and E. Williamson, "Static equivalency in progressive collapse alternate path analysis: Reducing conservatism while retaining structural integrity", J. Perform. Constr. Facil., vol. 20, no. 4, pp. 349-364, 2006. [http://dx.doi.org/10.1061/(ASCE)0887-3828(2006)20:4(349)] |
| [23] | M. Liu, "A new Dynamic Increase Factor for nonlinear static alternate path analysis of building frames against progressive collapse", Eng. Struct., vol. 48, pp. 666-673, 2013. [http://dx.doi.org/10.1016/j.engstruct.2012.12.011] |
| [24] | U. Starossek, and M. Haberland, "Approahes to measures of structural robustness", In: Proceedings of IABMAS’08, 4thInternational Conference on Bridge Maintenance, Safety and Management.: Seoul, Korea, 2008. |
| [25] | D. Cassiano, M. D’Aniello, C. Rebelo, R. Landolfo, and L. da Silva, "Influence of seismic design rules on the robustness of steel moment resisting frames", Steel Compos. Struct., vol. 21, no. 3, pp. 479-500, 2016. [http://dx.doi.org/10.12989/scs.2016.21.3.479] |
| [26] | CEN, EN 1991-1-7 - Eurocode 1 – Actions on structures - Part 1-7: General actions - Accidental actions. 2004. |
| [27] | United States of America Department of Defense, United Facilities Criteria (UFC) - Design of buildings to resist progressive collapse, 2009. |
| [28] | CEN, EN 1993:1-1 – Eurocode 3 – Design of steel structures – Part 1: General rules for buildings, 2004. |
| [29] | Prestandard and Commentary for the Seismic Rehabilitation of Buildings – FEMA 356., Federal Emergency Management Agency: Washington, D.C., 2000. |
| [30] | G. Xu, and B. Ellingwood, "Probabilistic robustness assessment of pre-northridge steel moment resisting frames", J. Struct. Eng., vol. 137, pp. 925-934, 2011. [http://dx.doi.org/10.1061/(ASCE)ST.1943-541X.0000403] |
| [31] | ARUP, Review of International Research on Structural Robustness and Disproportionate Collapse., Department for Communities and Local Government: London, 2011. |
| [32] | J.W. Baker, M. Schubert, and M.H. Faber, "On the assessment of robustness", Struct. Saf., vol. 30, pp. 253-267, 2008. [http://dx.doi.org/10.1016/j.strusafe.2006.11.004] |
| [33] | M. D’Aniello, R. Tartaglia, S. Costanzo, and R. Landolfo, "Seismic design of extended stiffened end-plate joints in the framework of Eurocodes", J. Constr. Steel Res., vol. 128, pp. 512-527, 2017. [http://dx.doi.org/10.1016/j.jcsr.2016.09.017] |
| [34] | A. Formisano, R. Landolfo, and F.M. Mazzolani, "Robustness assessment approaches for steel framed structures under catastrophic events", Comput. Structr., vol. 147, pp. 216-228, 2015. [http://dx.doi.org/10.1016/j.compstruc.2014.09.010] |
| [35] | A. Formisano, and F.M. Mazzolani, "Progressive Collapse and Robustness of Steel Framed Structures", In: B.H.V. Topping, Ed., Proceedings of the 11th International Conference on Computational Structures Technology, Civil-Comp Press, Stirlingshire, UK, 2012. [http://dx.doi.org/10.4203/ccp.99.13] |

